8 Oligopoly - Luiscabral.net
8 Oligopoly - Luiscabral.net
8 Oligopoly - Luiscabral.net

Create successful ePaper yourself
Turn your PDF publications into a flip-book with our unique Google optimized e-Paper software.
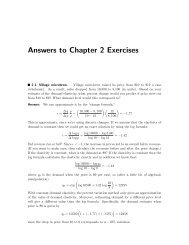
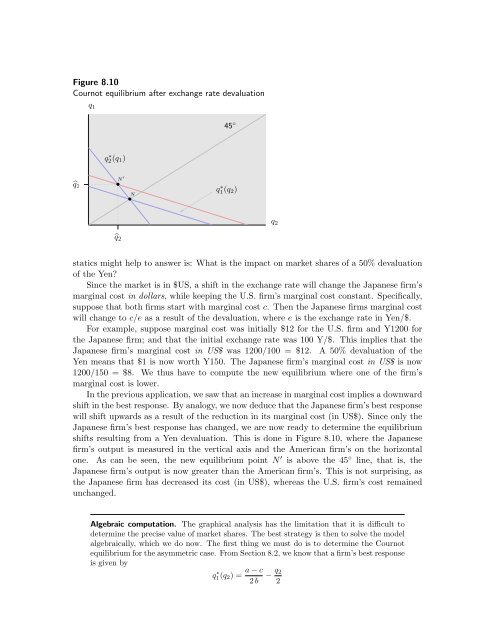
Figure 8.10<br />
Cournot equilibrium after exchange rate devaluation<br />
q 1<br />
45 ◦<br />
q 2<br />
q ∗ 2(q 1 )<br />
̂q 1<br />
̂q 2<br />
• N ′<br />
N<br />
•<br />
q ∗ 1(q 2 )<br />
... .... .... .... .... ... ... ... .... .<br />
............<br />
. .<br />
statics might help to answer is: What is the impact on market shares of a 50% devaluation<br />
of the Yen?<br />
Since the market is in $US, a shift in the exchange rate will change the Japanese firm’s<br />
marginal cost in dollars, while keeping the U.S. firm’s marginal cost constant. Specifically,<br />
suppose that both firms start with marginal cost c. Then the Japanese firms marginal cost<br />
will change to c/e as a result of the devaluation, where e is the exchange rate in Yen/$.<br />
For example, suppose marginal cost was initially $12 for the U.S. firm and Y1200 for<br />
the Japanese firm; and that the initial exchange rate was 100 Y/$. This implies that the<br />
Japanese firm’s marginal cost in US$ was 1200/100 = $12. A 50% devaluation of the<br />
Yen means that $1 is now worth Y150. The Japanese firm’s marginal cost in US$ is now<br />
1200/150 = $8. We thus have to compute the new equilibrium where one of the firm’s<br />
marginal cost is lower.<br />
In the previous application, we saw that an increase in marginal cost implies a downward<br />
shift in the best response. By analogy, we now deduce that the Japanese firm’s best response<br />
will shift upwards as a result of the reduction in its marginal cost (in US$). Since only the<br />
Japanese firm’s best response has changed, we are now ready to determine the equilibrium<br />
shifts resulting from a Yen devaluation. This is done in Figure 8.10, where the Japanese<br />
firm’s output is measured in the vertical axis and the American firm’s on the horizontal<br />
one. As can be seen, the new equilibrium point N ′ is above the 45 ◦ line, that is, the<br />
Japanese firm’s output is now greater than the American firm’s. This is not surprising, as<br />
the Japanese firm has decreased its cost (in US$), whereas the U.S. firm’s cost remained<br />
unchanged.<br />
Algebraic computation. The graphical analysis has the limitation that it is difficult to<br />
determine the precise value of market shares. The best strategy is then to solve the model<br />
algebraically, which we do now. The first thing we must do is to determine the Cournot<br />
equilibrium for the asymmetric case. From Section 8.2, we know that a firm’s best response<br />
is given by<br />
q1(q ∗ 2 ) = a − c − q 2<br />
2 b 2