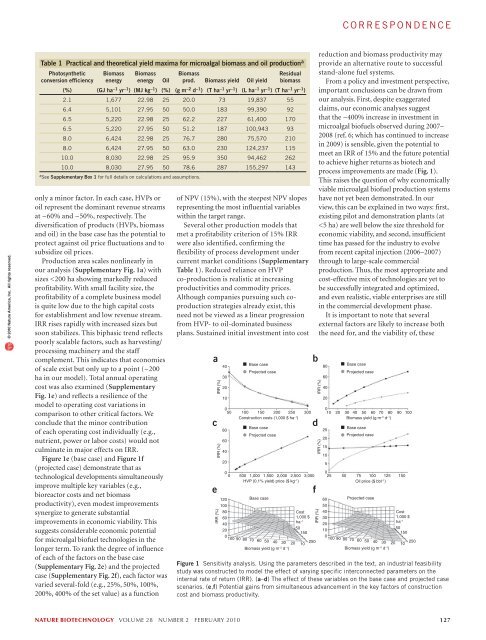
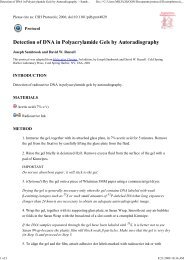
correspondence© 2010 Nature America, Inc. All rights reserved.pharmacology and clinical safety canbe minimized by installing appropriatecounter measures. The costs and effortsinvolved as well as the disadvantages inpositioning relative to stabilized competitordrugs, however, strongly suggest to us thatsuch development routes should no longerbe considered.COMPETING INTERESTS STATEMENTThe authors declare competing financialinterests: details accompany the full-text HTMLversion of the paper at http://www.nature.com/naturebiotechnology/.Aran F Labrijn, Janine Schuurman,Jan G J van de Winkel & Paul W H I ParrenGenmab, Utrecht, The Netherlands.e-mail: p.parren@genmab.com1. Labrijn, A.F. et al. Nat. Biotechnol. 27, 767–771(2009).2. van der Neut Kolfschoten, M. et al. Science 317, 1554–1557 (2007).3. Burton, D.R. & Wilson, I.A. Science 317, 1507–1508(2007).4. Hansen, K. et al. Mol. Immunol. 46, 3269–3277(2009).5. De Rubertis, F., Fleck, R. & Lanthaler, W. Nat.Biotechnol. 27, 595–597 (2009).An economic and technicalevaluation of microalgal biofuelsTo the Editor:In her News Feature “Biotech’s green gold” 1 ,Emily Waltz details the ‘hype’ being propagatedaround emerging microalgal biofueltechnologies, which often exceeds the physicaland thermodynamic constraints that ultimatelydefine their economic viability. Ourcalculations (Supplementary Box 1) countersuch excessive claims 1,2 and demonstrate that22 MJ m –2 d –1 solar radiationsupports practical yieldmaxima of ~60 to 100 kl oilha –1 y –1 (~6,600 to 10,800gal ac –1 y –1 ) and an absolutetheoretical ceiling of ~94 to155 kl oil ha –1 y –1 , assuminga maximum photosyntheticconversion efficiency of 10%(ref.3) (results summarizedin Table 1). To evaluateclaims and provide an accurateanalysis of the potentialof microalgal biofuel systems,we have conductedindustrial feasibility studies and sensitivityanalyses based on peer-reviewed data andindustrial expertise. Given that microalgalbiofuel research is still young and its developmentstill in flux, we anticipate that thestringent assessment of the technology’s economicpotential presented below will assistR&D investment and policy development inthe area going forward.If sustainable and profitable processescan be developed, the potential benefitsof these technologies for the commongood appear compelling and include theproduction on nonarable land of biodiesel,methane, butanol, ethanol, aviationfuel and hydrogen, using waste or salinewater, as well as CO 2 from industrial oratmospheric sources. We have examinedindustrial feasibility models of microalgalsystems to identify the key economicdrivers and provide an industrially relevantupdate on previous economic analyses 4,5 .Two of our models are described here as‘base case’ (that is, integrating currenttechnology) and ‘projectedcase’, which is consideredachievable but has notyet been demonstratedat commercial scale. The30-year internal rate ofreturn (IRR; Fig. 1 andSupplementary Fig. 1) andnet present value (NPV;Supplementary Fig. 2) areused as a measure of theprofitability of differentproduction scenarios.IRR values of 15% andabove are considered toindicate the potential for economic viability.Importantly, all subsidies including carboncredits have been deliberately excluded, ashave financial optimization techniques, toprovide a substantial financial contingency.The base case is intended to represent anemerging scenario from the industry andinvolves the following assumptions:(i) production of microalgal biomass using500 ha of microalgal production systems; (ii)the extraction of oil; (iii) the co-productionand extraction of a high value product(HVP; e.g., β-carotene at 0.1% of biomass,$600/kg); and (iv) the sale of the remainingbiomass as feedstock (e.g., soymeal orfishmeal substitute). In contrast, theprojected case is intended to represent themicroalgal biofuel industry at maturity andno longer incorporates the co-productionof HVPs. The base case is essentially a selfsubsidizing,co-production model. Althoughit produces ~100 times more oil than HVPon a per tonnage basis, the revenue fromHVPs is ~10 times that of oil due to theirdifference in value. In reality, deployment ofthis co-production approach will require theservicing of a diversity of HVP markets, asHVP markets are small and easily saturable.Consequently, a major consideration is thatthe technical developments required forthe commercialization of individual HVPscan be as challenging as those required forbiofuel production. Therefore, the existenceof one or more suitable market-readyHVPs represents a central decision pointfor would-be biofuel producers. Improvedmicroalgal productivity approaching thetargets identified in the projected case willreduce the reliance on co-production (Table1) as the industry matures.All assumptions (variable settings) in thismodel are detailed in the SupplementaryData and are based on what are consideredto be realistically achievable and publishedpeer-reviewed values. The key findingsof this model are summarized in Figure1 (also see Supplementary Figs. 1 and2) as sensitivity analysis plots in whichindividual or multiple settings (e.g.,biomass productivity and constructioncosts) are varied to evaluate their effect onthe IRR. For example, as construction costsare reduced (Fig. 1a), the IRR increases.The appropriateness of using the IRR asa measure for profitability in this study isdemonstrated in the Supplementary Dataand Supplementary Figure 2. Detailedfigures for NPV are also provided. Thismodel deliberately does not discriminatebetween open pond and closed bioreactorsystems, the pros and cons of whichare hotly debated; instead, it comparesconstruction costs versus yield (Fig. 1e,f) asthis is the critical factor (that is, low cost/lowyield and high cost/high yield reactors cantheoretically be equally profitable).We illustrate how key factors affect theIRR of both case studies (Fig. 1). Thesewere (i) capital costs for construction ofthe ponds/reactors (Fig. 1a) and (ii) thebiomass productivity (g m –2 day –1 ) (Fig.1b). In the base case, the third key factorwas the role of HVPs (Fig. 1c), whereas inthe projected case, the corresponding effectwas oil price (Fig. 1d), but biomass oilcontent (see Supplementary Fig. 1d) was126 volume 28 number 2 february 2010 nature biotechnology
correspondence© 2010 Nature America, Inc. All rights reserved.Table 1 Practical and theoretical yield maxima for microalgal biomass and oil production aPhotosyntheticconversion efficiencyBiomassenergyBiomassenergyonly a minor factor. In each case, HVPs oroil represent the dominant revenue streamsat ~60% and ~50%, respectively. Thediversification of products (HVPs, biomassand oil) in the base case has the potential toprotect against oil price fluctuations and tosubsidize oil prices.Production area scales nonlinearly inour analysis (Supplementary Fig. 1a) withsizes
- Page 3 and 4: volume 28 number 2 february 2010COM
- Page 5 and 6: in this issue© 2010 Nature America
- Page 7 and 8: © 2010 Nature America, Inc. All ri
- Page 10 and 11: NEWS© 2010 Nature America, Inc. Al
- Page 12 and 13: NEWS© 2010 Nature America, Inc. Al
- Page 14 and 15: NEWS© 2010 Nature America, Inc. Al
- Page 16 and 17: © 2010 Nature America, Inc. All ri
- Page 18 and 19: © 2010 Nature America, Inc. All ri
- Page 20 and 21: © 2010 Nature America, Inc. All ri
- Page 22 and 23: NEWS feature© 2010 Nature America,
- Page 24 and 25: uilding a businessComing to termsDa
- Page 26 and 27: uilding a business© 2010 Nature Am
- Page 28 and 29: correspondence© 2010 Nature Americ
- Page 32 and 33: correspondence© 2010 Nature Americ
- Page 34 and 35: correspondence© 2010 Nature Americ
- Page 36 and 37: case studyNever againcommentaryChri
- Page 38 and 39: COMMENTARY© 2010 Nature America, I
- Page 40 and 41: COMMENTARY© 2010 Nature America, I
- Page 42 and 43: patents© 2010 Nature America, Inc.
- Page 44 and 45: patents© 2010 Nature America, Inc.
- Page 46 and 47: news and viewsChIPs and regulatory
- Page 48 and 49: news and viewsFrom genomics to crop
- Page 50 and 51: news and views© 2010 Nature Americ
- Page 52 and 53: news and views© 2010 Nature Americ
- Page 54 and 55: e s o u r c eRational association o
- Page 56 and 57: e s o u r c e© 2010 Nature America
- Page 58 and 59: e s o u r c e© 2010 Nature America
- Page 60 and 61: e s o u r c e© 2010 Nature America
- Page 62 and 63: © 2010 Nature America, Inc. All ri
- Page 64 and 65: B r i e f c o m m u n i c at i o n
- Page 66 and 67: i e f c o m m u n i c at i o n sAUT
- Page 68 and 69: lettersa1.5 kb hVPrIntron 112.5 kbA
- Page 70 and 71: letters© 2010 Nature America, Inc.
- Page 72 and 73: letters© 2010 Nature America, Inc.
- Page 74 and 75: l e t t e r sReal-time imaging of h
- Page 76 and 77: l e t t e r sFigure 2 Time-lapse li
- Page 78 and 79: l e t t e r s© 2010 Nature America
- Page 80 and 81:
l e t t e r sRational design of cat
- Page 82 and 83:
l e t t e r s© 2010 Nature America
- Page 84 and 85:
l e t t e r s© 2010 Nature America
- Page 86 and 87:
sample fluorescence was measured as
- Page 88 and 89:
careers and recruitmentFourth quart