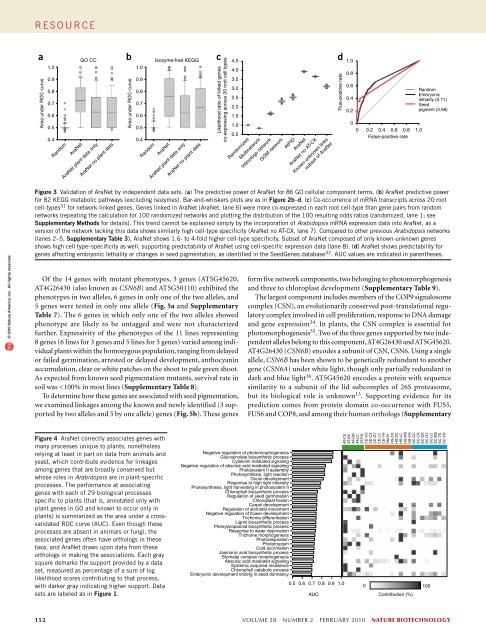
e s o u r c e© 2010 Nature America, Inc. All rights reserved.Figure 2 Predictive power of AraNet for conservedand plant-specific biological processes. AraNet’spredictive capacity was measured using crossvalidatedreceiver operator characteristic (ROC)curve analysis, as illustrated in (a). For a givenprocess, each gene in the Arabidopsis genomeis rank-ordered by the sum of its network linkagescores to the set of ‘bait’ genes already associatedwith that process (omitting each bait gene from thebait set for purposes of evaluation). High-scoringgenes are most tightly connected to the bait set andare the most likely new candidates to participatein that process. This trend is evident in a ROC plotmeasuring recovery of bait genes as a function ofrank, calculating the true-positive prediction rate(sensitivity; TP/(TP+FN)) versus the false-positiveprediction rate (1−specificity; FP/(FP+TN)). If baitgenes are highly interconnected (red circles), unlikerandom genes (blue circles), additional genesconnected to the bait genes (green circles) are morelikely to be involved in the same process. The areaunder the cross-validated ROC curve (AUC) providesa measure of predictability, ranging from ~0.5 forrandom expectation (blue curve) to 1 for perfectpredictions (red curve). (b) Distributions of AUCvalues are plotted for network-based identificationof genes for each of the 318 GO biological processterms with annotations, (c) for each of the 151biological process terms with annotations sharedbetween plant and animal or between plant andyeast and (d) for each of the 167 biological processterms with annotations found in plants but absentfrom animals and fungi. In bar-and-whiskers plots,abArea under ROC curveeTrue-positive rate001False-positive rateGO BP (all) c GO BP (conserved)Response to0 oxidative stress (0.82) 00 0.2 0.4 0.6 0.8 1.0 0 0.2 0.4 0.6 0.8 1.01.01.00.90.90.90.80.80.80.70.70.70.60.60.60.50.50.50.40.40.4Abiotic responseRandom (0.50)1.0f 1.0Organ development0.80.60.40.2Response to waterdeprivation (0.73)Response to hydrogenperoxide (0.73)Cold acclimation (0.72)Response to heat (0.80)Response to highlight intensity (0.79)0.80.60.40.2False-positive rateFalse-positive rateRandomAraNetAraNet plantdata onlyAraNet noplant dataArea under ROC curveTrue-positive rate1RandomAraNetAraNet plantdata onlyAraNet noplant datadArea under ROC curveGO BP (plant-specific)1.0RandomAraNetAraNet plantdata onlyAraNet noplant dataRandom (0.50)Root development (0.62)Cuticledevelopment (0.61)Stamendevelopment (0.64)Stomatal complexmorphogenesis (0.71)Trichomemorphogenesis (0.73)Carpeldevelopment (0.75)Ovuledevelopment (0.81)the central horizontal line in the box indicates the median AUC and the boundaries of the box indicate the first and third quartiles of the AUC distribution. Whiskersindicate the 10th and 90th percentiles, and circles indicate individual outliers. AraNet specifically identified genes associated with (e) plant abiotic stress responsegenes and (f) organ developmental processes, as annotated by GO. AUC values are indicated in parentheses.True-positive rateLinked genes share cell type–specific expression patternsMany traits in multicellular organisms pertain to specific tissues orcell types. The predictive strength shown by AraNet for such processesraises the question of how a global gene network, incorporatingdiverse samples and data from orthologs, can correctly identifygenes for cell type– and tissue-specific processes. Using measurementsof transcript observations in 20 root cell types 31 that werenot used in building AraNet, we measured the extent to which geneslinked in AraNet were spatiotemporally co-expressed in these cells.We find that linked genes show strong cell-specific co-expression inArabidopsis (Fig. 3c)—indeed, far stronger than in previous networksof Arabidopsis genes (Supplementary Table 3) 27–30 —with linkedgenes four times more likely to be expressed in the same cell typesthan expected by chance. Thus, although different individual networkswere not constructed for each cell type, such cell and tissue specificityis nonetheless at least in part implicitly encoded in AraNet linkages.This correlation between functional association and spatiotemporalco-expression of genes likely enhances prediction strength for manytraits, and is evident even for linkages between characterized anduncharacterized genes (Fig. 3c), supporting applicability of AraNetto uncharacterized genes.Associating genes with specific mutant phenotypesBecause linked genes in AraNet tend to operate in the same processes(Figs. 1–4), we might expect that they often affect the same phenotypictraits 3,5 . This allows association of new candidate genes with traits ofinterest based on network connections. To test this, we used resultsfrom large-scale mutant seed phenotyping 32 and analyzed geneswhose disruption induced embryonic lethality or changes in seed(embryo) pigmentation. Genes involved in each trait were interlinkedsignificantly more often compared to chance (p < 10 −31 for embryoniclethality and P < 10 −10 for seed pigmentation, normal distribution)(Fig. 3d). Unlike AraNet, previous Arabidopsis gene networks 27–30 donot significantly predict either phenotype (Supplementary Fig. 4).Thus, AraNet offers a feasible approach for selecting genes likely tobe associated with specific plant traits.Tenfold enrichment for seed pigmentation genesTo experimentally test the association of new genes with a trait, weused 23 known seed pigmentation genes (Supplementary Table 4) tosearch AraNet for new pigmentation genes. Genes in this phenotypicclass generally affect chloroplast development or photomorphogenesis,and mutant seedlings show early developmental defects, with albino,pale green, purple or variegated leaves 33 .From AraNet’s top 200 candidate genes, we screened all geneswith available homozygous T-DNA insertional mutant lines(Supplementary Table 5). We screened 90 candidate genes (representedby 118 mutant lines), of which 14 genes (represented by 17lines) exhibited color and morphology defects in young seedlings,reminiscent of seed pigmentation mutants (Supplementary Tables 6and 7). This represents a tenfold enrichment in the discovery rate ofthe mutant phenotype (P ≤ 10 −12 , binomial distribution) over thatobserved during screens of T-DNA insertional lines 33 (see OnlineMethods). This discovery rate compares well to animal networks, forexample, in C. elegans 16 tumor suppressor effectors were identifiedfrom 170 candidates 5 .nature biotechnology VOLUME 28 NUMBER 2 FEBRUARY 2010 151
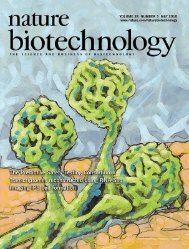
e s o u r c e© 2010 Nature America, Inc. All rights reserved.a bc dArea under ROC curve1.00.90.80.70.60.50.4GO CCRandomAraNetAraNet plant data onlyAraNet no plant dataArea under ROC curve1.00.90.80.70.60.50.4Isozyme-free KEGGRandomAraNetAraNet plant data onlyAraNet no plant dataLikelihood ratio of linked genesco-expressing across 20 root cell typesOf the 14 genes with mutant phenotypes, 3 genes (AT5G45620,AT4G26430 (also known as CSN6B) and AT5G50110) exhibited thephenotypes in two alleles, 6 genes in only one of the two alleles, and5 genes were tested in only one allele (Fig. 5a and SupplementaryTable 7). The 6 genes in which only one of the two alleles showedphenotype are likely to be untagged and were not characterizedfurther. Expressivity of the phenotypes of the 11 lines representing8 genes (6 lines for 3 genes and 5 lines for 5 genes) varied among individualplants within the homozygous population, ranging from delayedor failed germination, arrested or delayed development, anthocyaninaccumulation, clear or white patches on the shoot to pale green shoot.As expected from known seed pigmentation mutants, survival rate insoil was
- Page 3 and 4:
volume 28 number 2 february 2010COM
- Page 5 and 6: in this issue© 2010 Nature America
- Page 7 and 8: © 2010 Nature America, Inc. All ri
- Page 10 and 11: NEWS© 2010 Nature America, Inc. Al
- Page 12 and 13: NEWS© 2010 Nature America, Inc. Al
- Page 14 and 15: NEWS© 2010 Nature America, Inc. Al
- Page 16 and 17: © 2010 Nature America, Inc. All ri
- Page 18 and 19: © 2010 Nature America, Inc. All ri
- Page 20 and 21: © 2010 Nature America, Inc. All ri
- Page 22 and 23: NEWS feature© 2010 Nature America,
- Page 24 and 25: uilding a businessComing to termsDa
- Page 26 and 27: uilding a business© 2010 Nature Am
- Page 28 and 29: correspondence© 2010 Nature Americ
- Page 30 and 31: correspondence© 2010 Nature Americ
- Page 32 and 33: correspondence© 2010 Nature Americ
- Page 34 and 35: correspondence© 2010 Nature Americ
- Page 36 and 37: case studyNever againcommentaryChri
- Page 38 and 39: COMMENTARY© 2010 Nature America, I
- Page 40 and 41: COMMENTARY© 2010 Nature America, I
- Page 42 and 43: patents© 2010 Nature America, Inc.
- Page 44 and 45: patents© 2010 Nature America, Inc.
- Page 46 and 47: news and viewsChIPs and regulatory
- Page 48 and 49: news and viewsFrom genomics to crop
- Page 50 and 51: news and views© 2010 Nature Americ
- Page 52 and 53: news and views© 2010 Nature Americ
- Page 54 and 55: e s o u r c eRational association o
- Page 58 and 59: e s o u r c e© 2010 Nature America
- Page 60 and 61: e s o u r c e© 2010 Nature America
- Page 62 and 63: © 2010 Nature America, Inc. All ri
- Page 64 and 65: B r i e f c o m m u n i c at i o n
- Page 66 and 67: i e f c o m m u n i c at i o n sAUT
- Page 68 and 69: lettersa1.5 kb hVPrIntron 112.5 kbA
- Page 70 and 71: letters© 2010 Nature America, Inc.
- Page 72 and 73: letters© 2010 Nature America, Inc.
- Page 74 and 75: l e t t e r sReal-time imaging of h
- Page 76 and 77: l e t t e r sFigure 2 Time-lapse li
- Page 78 and 79: l e t t e r s© 2010 Nature America
- Page 80 and 81: l e t t e r sRational design of cat
- Page 82 and 83: l e t t e r s© 2010 Nature America
- Page 84 and 85: l e t t e r s© 2010 Nature America
- Page 86 and 87: sample fluorescence was measured as
- Page 88 and 89: careers and recruitmentFourth quart