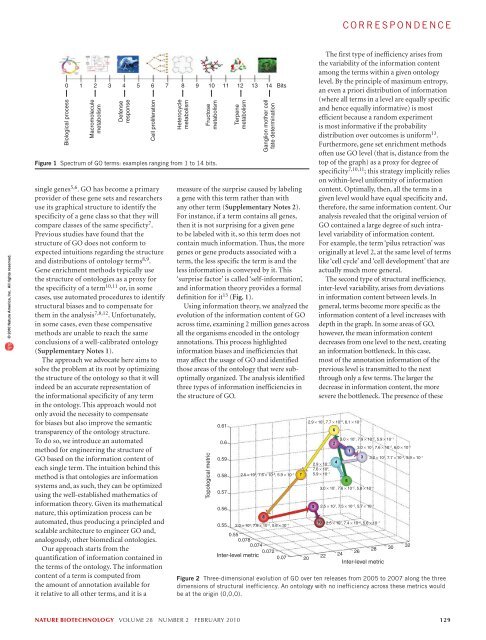
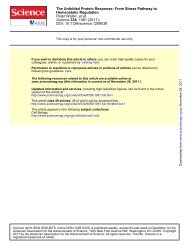
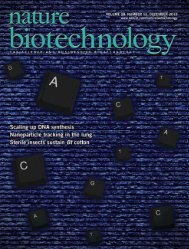
correspondence© 2010 Nature America, Inc. All rights reserved.0 1 2 3 4 5 6 7 8 9 10 11 12 13 14 BitsBiological processMacromoleculemetabolismDefenseresponseCell proliferationsingle genes 5,6 . GO has become a primaryprovider of these gene sets and researchersuse its graphical structure to identify thespecificity of a gene class so that they willcompare classes of the same specificty 7 .Previous studies have found that thestructure of GO does not conform toexpected intuitions regarding the structureand distributions of ontology terms 8,9 .Gene enrichment methods typically usethe structure of ontologies as a proxy forthe specificity of a term 10,11 or, in somecases, use automated procedures to identifystructural biases and to compensate forthem in the analysis 7,8,12 . Unfortunately,in some cases, even these compensativemethods are unable to reach the sameconclusions of a well-calibrated ontology(Supplementary Notes 1).The approach we advocate here aims tosolve the problem at its root by optimizingthe structure of the ontology so that it willindeed be an accurate representation ofthe informational specificity of any termin the ontology. This approach would notonly avoid the necessity to compensatefor biases but also improve the semantictransparency of the ontology structure.To do so, we introduce an automatedmethod for <strong>engineering</strong> the structure ofGO based on the information content ofeach single term. The intuition behind thismethod is that ontologies are informationsystems and, as such, they can be optimizedusing the well-established mathematics ofinformation theory. Given its mathematicalnature, this optimization process can beautomated, thus producing a principled andscalable architecture to engineer GO and,analogously, other biomedical ontologies.Our approach starts from thequantification of information contained inthe terms of the ontology. The informationcontent of a term is computed fromthe amount of annotation available forit relative to all other terms, and it is aHeterocyclemetabolismFructosemetabolismFigure 1 Spectrum of GO terms: examples ranging from 1 to 14 bits.TerpenemetabolismGanglion mother cellfate determinationmeasure of the surprise caused by labelinga gene with this term rather than withany other term (Supplementary Notes 2).For instance, if a term contains all genes,then it is not surprising for a given geneto be labeled with it, so this term does notcontain much information. Thus, the moregenes or gene products associated with aterm, the less specific the term is and theless information is conveyed by it. This‘surprise factor’ is called ‘self-information’,and information theory provides a formaldefinition for it 13 (Fig. 1).Using information theory, we analyzed theevolution of the information content of GOacross time, examining 2 million genes acrossall the organisms encoded in the ontologyannotations. This process highlightedinformation biases and inefficiencies thatmay affect the usage of GO and identifiedthose areas of the ontology that were suboptimallyorganized. The analysis identifiedthree types of information inefficiencies inthe structure of GO.Topological metric0.610.60.590.580.570.560.552.5 × 10 1 , 7.6 × 10 −2 , 5.9 × 10 −10.550.0780.0740.072Inter-level metric 0.0720The first type of inefficiency arises fromthe variability of the information contentamong the terms within a given ontologylevel. By the principle of maximum entropy,an even a priori distribution of information(where all terms in a level are equally specificand hence equally informative) is mostefficient because a random experimentis most informative if the probabilitydistribution over outcomes is uniform 13 .Furthermore, gene set enrichment methodsoften use GO level (that is, distance from thetop of the graph) as a proxy for degree ofspecificity 7,10,11 ; this strategy implicitly relieson within-level uniformity of informationcontent. Optimally, then, all the terms in agiven level would have equal specificity and,therefore, the same information content. Ouranalysis revealed that the original version ofGO contained a large degree of such intralevelvariability of information content.For example, the term ‘pilus retraction’ wasoriginally at level 2, at the same level of termslike ‘cell cycle’ and ‘cell development’ that areactually much more general.The second type of structural inefficiency,inter-level variability, arises from deviationsin information content between levels. Ingeneral, terms become more specific as theinformation content of a level increases withdepth in the graph. In some areas of GO,however, the mean information contentdecreases from one level to the next, creatingan information bottleneck. In this case,most of the annotation information of theprevious level is transmitted to the nextthrough only a few terms. The larger thedecrease in information content, the moresevere the bottleneck. The presence of these2.9 × 10 1 , 7.7 × 10 −2 , 6.1 × 10 −13.0 × 10 1 , 7.9 × 10 −2 , 5.9 × 10 −13.0 × 10 1 , 7.6 × 10 −2 , 6.0 × 10 −13.2 × 10 1 , 7.7 × 10 −2 , 5.9 × 10 −12.9 × 10 −1 ,7.6 × 10 2 ,5.9 × 10 −13.0 × 10 1 , 7.6 × 10 −2 , 5.8 × 10 −12.5 × 10 1 , 7.5 × 10 −2 , 5.7 × 10 −12.0 × 10 1 , 7.6 × 10 −2 , 5.6 × 10 −1 2.5 × 10 1 , 7.4 × 10 −2 , 5.6 × 10 −1262824Inter-level metricFigure 2 Three-dimensional evolution of GO over ten releases from 2005 to 2007 along the threedimensions of structural inefficiency. An ontology with no inefficiency across these metrics wouldbe at the origin (0,0,0).223032nature biotechnology volume 28 number 2 february 2010 129
correspondence© 2010 Nature America, Inc. All rights reserved.areas of suboptimal information distributionviolate the assumption of gene set enrichmentanalysis methods 7,12 that the specificity in GOterms effectively increases from one level tothe next (Supplementary Notes 3).The third type of structural inefficiency,topological variability, arises from thesuboptimal organization of the branches.The principle of maximum entropy dictatesthat the closer a topological structure is touniform, the greater is the information thatexperiments can derive from it 8 . We usedentropy rate to quantify the uniformity ofthe GO branch structure (SupplementaryNotes 4) so that a higher entropy rateindicates that the ontology structure iscloser to uniform.We analyzed the evolution of GO alongthese three dimensions of structuralinefficiency using ten releases of GOcontaining over 2 million unique genes 14 .Figure 2 plots their structural inefficienciesfor each release of GO and illustrateshow they have been decreasing over time(Supplementary Notes 5). For instance,with time point 8 (February 1, 2007), interlevelvariability and topological variabilitysaw substantive improvements, coincidingwith introduction of the [‘is_a complete’]property in GO 15 . In contrast, intra-levelvariability saw comparatively modestimprovements over the evolution of GO.One of the greatest dangers of structuralinefficiencies in GO is the impact they canhave on the functional interpretation of theresults of high-throughput experiments. Wethus optimized the information distributionof GO by introducing single-level changesand modifying 1,001 relationships and 11%of GO terms, thus significantly improvingthe overall intra-variability (P < 10 −3 )(Supplementary Notes 6).We used this optimization methodto create a modified, improved GO andwe compared it to the current GO in theinterpretation of 10,117 gene expressionsignatures from DNA microarrayexperiments 16 . Each signature containsgenes differentially expressed between twobiological conditions, and we comparedthe results of gene enrichment analysis ofthese signatures obtained by the originaland the modified GO. We found that thesechanges significantly affected the functionalinterpretations of 97.5% (P < 10 −3 ) of theexperimental gene signatures and alteredthe resulting set of GO categories by 14.6%on average (Supplementary Notes 7). Onthe basis of this analysis, we presented 14recommendations to the GO Consortiumand most of these new annotations (12)will be introduced in the next release of GO(Supplementary Notes 8).Finally, as a result of our analysis, weapplied this approach to more complicatedmulti-level structural changes. We suggestedthe GO Consortium move 12 terms. Theterms all underwent the standard curatorialvalidation of the GO consortium, and 11 ofthem are now included in the current releaseof GO. The twelfth term, pigmentation(GO:0043473) had few annotations at thetime but was not moved as it was expectedthat many more genes would be annotatedwith that term in the future.The most striking result of ourexperiment was to show the convergenceof mathematical optimality and biologicalvalidity and that a formal, automatedanalysis is able to uncover sound biologicalinformation hidden in the structure of theontology. By altering the ontology itself, ourapproach improves gene enrichment resultsin ways that cannot be obtained by simplychanging the underlying gene enrichmentmethod (Supplementary Notes 1).Our analysis also reveals that GOcontains more information than iscurrently used. By optimizing thedistribution of information within GO,our method can be used to aid the designof more efficiently organized knowledgerepositories—leading to a more effectiveuse of biological information. This methodis already being used to achieve this aim bythe GO Consortium and other ontologies,such as the Phenotypic Quality <strong>Ontology</strong>(PATO) 17 in the OBO Foundry 18 . We expectthat formal and automated methods willbecome the standard for the <strong>engineering</strong> ofbiomedical ontologies.Note: Supplementary information is available on theNature Biotechnology website.ACKNOWLEDGMENTSThis work was supported in part by the NationalLibrary of Medicine (NLM/NIH) under grants1K99LM009826 and 5T15LM007092 and by theNational Human Genome Research Institute(NHGRI/NIH) under grants 2P41HG02273,1R01HG003354, and 1R01HG004836. The authorsare grateful to the anonymous reviewers for theirhelpful suggestions.COMPETING INTERESTS STATEMENTThe authors declare no competing financial interests.Gil Alterovitz 1–3 , Michael Xiang 1,2 ,David P Hill 4 , Jane Lomax 5 , Jonathan Liu 6 ,Michael Cherkassky 2 , Jonathan Dreyfuss 1,2 ,Chris Mungall 7 , Midori A Harris 5 , Mary E Dolan 4 ,Judith A Blake 4 & Marco F Ramoni 1,21 Children’s Hospital Informatics Program,Harvard-MIT Division of Health Sciencesand Technology, Harvard Medical School,Boston, Massachusetts, USA. 2 PartnersHealthcare Center for Personalized GeneticMedicine, Boston, Massachusetts, USA.3 Department of Electrical Engineering andComputer Science, Massachusetts Institute ofTechnology, Cambridge, Massachusetts, USA.4 Jackson Laboratory, Bar Harbor, Maine,USA. 5 EMBL-EBI, Wellcome Trust GenomeCampus, Hinxton, UK. 6 Department ofBiology, Massachusetts Institute of Technology,Cambridge, Massachusetts, USA. 7 LawrenceBerkeley National Laboratory, Berkeley,California, USA.e-mail: gil_alterovitz@hms.harvard.edu ormarco_ramoni@harvard.edu.1. Ashburner, M. et al. Nat. Genet. 25, 25–29 (2000).2. Davis, D.A., Ciurea, I., Flanagan, T.M. & Perrier, L.Med. J. Aust. 180, S68–S71 (2004).3. Camon, E. et al. Nucleic Acids Res. 32, D262–D266(2004).4. Harris, M. et al. Nucleic Acids Res. 32, D258–D261(2004).5. Subramanian, A. et al. Proc. Natl. Acad. Sci. USA 102,15545–15550 (2005).6. Doniger, S.W. et al. Genome Biol. 4, R7 (2003).7. Al-Shahrour, F., Diaz-Uriarte, R. & Dopazo, J.Bioinformatics 20, 578–580 (2004).8. Alterovitz, G., Xiang, M., Mohan, M. & Ramoni, M.F.G.O.Nucleic Acids Res. 35, D322–D327 (2007).9. Ogren, P.V., Cohen, K.B. & Hunter, L. Pac. Symp.Biocomput. 174–185 (2005).10. Dennis, G. Jr. et al. Genome Biol. 4, 3 (2003).11. Zhou, M. & Cui, Y. In Silico Biol. 4, 323–333(2004).12. Raychaudhuri, S., Chang, J.T., Sutphin, P.D. & Altman,R.B. Genome Res. 12, 203–214 (2002).13. MacKay, D.J.C. Information Theory, Inference, AndLearning Algorithms, xii (Cambridge University Press,Cambridge, U.K.; New York, 2003).14. Wu, C.H. et al. Nucleic Acids Res. 34, D187–D191(2006).15. The Gene <strong>Ontology</strong> Consortium. Nucleic Acids Res. 36,D440–D444 (2008).16. Yi, Y., Li, C., Miller, C. & George, A.L. Jr. Genome Biol.8, R133 (2007).17. Gkoutos, G.V. et al. Comp. Funct. Genomics 5, 545–551 (2004).18. Smith, B. et al. Nat. Biotechnol. 25, 1251–1255(2007).130 volume 28 number 2 february 2010 nature biotechnology
- Page 3 and 4: volume 28 number 2 february 2010COM
- Page 5 and 6: in this issue© 2010 Nature America
- Page 7 and 8: © 2010 Nature America, Inc. All ri
- Page 10 and 11: NEWS© 2010 Nature America, Inc. Al
- Page 12 and 13: NEWS© 2010 Nature America, Inc. Al
- Page 14 and 15: NEWS© 2010 Nature America, Inc. Al
- Page 16 and 17: © 2010 Nature America, Inc. All ri
- Page 18 and 19: © 2010 Nature America, Inc. All ri
- Page 20 and 21: © 2010 Nature America, Inc. All ri
- Page 22 and 23: NEWS feature© 2010 Nature America,
- Page 24 and 25: uilding a businessComing to termsDa
- Page 26 and 27: uilding a business© 2010 Nature Am
- Page 28 and 29: correspondence© 2010 Nature Americ
- Page 30 and 31: correspondence© 2010 Nature Americ
- Page 32 and 33: correspondence© 2010 Nature Americ
- Page 36 and 37: case studyNever againcommentaryChri
- Page 38 and 39: COMMENTARY© 2010 Nature America, I
- Page 40 and 41: COMMENTARY© 2010 Nature America, I
- Page 42 and 43: patents© 2010 Nature America, Inc.
- Page 44 and 45: patents© 2010 Nature America, Inc.
- Page 46 and 47: news and viewsChIPs and regulatory
- Page 48 and 49: news and viewsFrom genomics to crop
- Page 50 and 51: news and views© 2010 Nature Americ
- Page 52 and 53: news and views© 2010 Nature Americ
- Page 54 and 55: e s o u r c eRational association o
- Page 56 and 57: e s o u r c e© 2010 Nature America
- Page 58 and 59: e s o u r c e© 2010 Nature America
- Page 60 and 61: e s o u r c e© 2010 Nature America
- Page 62 and 63: © 2010 Nature America, Inc. All ri
- Page 64 and 65: B r i e f c o m m u n i c at i o n
- Page 66 and 67: i e f c o m m u n i c at i o n sAUT
- Page 68 and 69: lettersa1.5 kb hVPrIntron 112.5 kbA
- Page 70 and 71: letters© 2010 Nature America, Inc.
- Page 72 and 73: letters© 2010 Nature America, Inc.
- Page 74 and 75: l e t t e r sReal-time imaging of h
- Page 76 and 77: l e t t e r sFigure 2 Time-lapse li
- Page 78 and 79: l e t t e r s© 2010 Nature America
- Page 80 and 81: l e t t e r sRational design of cat
- Page 82 and 83: l e t t e r s© 2010 Nature America
- Page 84 and 85:
l e t t e r s© 2010 Nature America
- Page 86 and 87:
sample fluorescence was measured as
- Page 88 and 89:
careers and recruitmentFourth quart