news and viewsChIPs and regulatory bitsXin He & Saurabh SinhaMachine learning reveals combinatorial patterns of transcription factor binding that drive gene expression.© 2010 Nature America, Inc. All rights reserved.Gene expression patterns are orchestrated largelyby promoters and enhancers, which integratea multitude of signaling and transcriptionalinputs 1 . But exactly how these cis-regulatorymodules control transcription on a global scalehas been devilishly hard to decipher. A recentstudy by Zinzen et al. 2 in Nature marks excitingprogress on this problem. The authors’ key innovationis a technique to predict the expressionactivity driven by any genomic segment usingtranscription factor occupancy data generatedfrom high-throughput chromatin immunoprecipitation(ChIP) assays. The approach led tothe discovery of dozens of novel cis-regulatorymodules involved in mesoderm and muscledevelopment in the Drosophila melanogasterembryo, while providing new insights into theunderlying regulatory code.In parallel with experimental studies, therehave been two main computational directionsfor explaining the mode of action of cis-regulatorymodules—that is, how several transcriptionfactor binding sites in a module integrate theintracellular concentrations of transcription factorsto determine gene expression. Approachesbased on fundamental physical-chemical principleshave made significant headway in predictingfunction directly from sequence 3,4 buthave been limited by gaps in our understandingof the underlying molecular mechanisms,such as the combined effects of simultaneousprotein-DNA and protein-protein interactions.In addition, statistical approaches have beenused to associate specific expression states withthe patterns of binding site occurrence sharedby the corresponding regulatory sequences 5 . Acommon hurdle in both paradigms is the nontrivialnature of predicting transcription factoroccupancy from sequence alone.Xin He and Saurabh Sinha are at theUniversity of Illinois at Urbana-Champaign,Urbana, Illinois.e-mail: xinhe2@illinois.edu orsinhas@illinois.eduZinzen et al. 2 adopted a pragmatic solutionthat circumvents this challenge by usingChIP-chip technology to directly measure theoccupancy levels of five transcription factorsknown to be involved in mesoderm specification(Twi, Bin, Tin, Mef2 and Bap). Theyidentified candidate cis-regulatory modulesas clusters of ChIP-binding peaks and tackledthe problem of mapping quantitative measurementsof transcription factor occupancywithin these modules to one of five predeterminedclasses of expression patterns, eachof which corresponded to a specific tissue ordevelopmental stage (Fig. 1).A machine learning technique called supportvector machine was used to achieve highaccuracy in this classification task, sidesteppingthe need for mechanistic details of theregulatory process. Loosely speaking, thistechnique treats each module’s occupancyprofile as a point in space and learns how tobest draw boundaries that separate pointscorresponding to known modules with differentexpression patterns. Then, any candidatemodule’s expression pattern can be predictedbased on where it lies in space relative tothese boundaries. The authors experimentallyvalidated 35 of 36 predicted cis-regulatorymodules for mesoderm specification, demonstratinga remarkable success rate.The method of Zinzen et al. 2 uses transcriptionfactor occupancy information onan entire genomic segment rather than atindividual binding sites. Its success thereforeseems to support the ‘information display’model of cis-regulatory module function 6 ,which contends that regulatory functiondepends on the number and types of bindingsites in a genomic segment and not on theirprecise arrangement. However, arrangementsof sites may have an important role in determiningnet transcription factor occupancyor in fine-tuning the expression activity; thepaper’s findings do not rule out either possibility.It is also worth noting that the transcriptionfactor occupancy information used by Zinzenet al. 2 was obtained from whole-embryo measurements.That the method does not requirespatial information on the concentrations ofregulatory proteins is a practical advantage butalso raises questions about its generalizability.For example, would it be possible to modelthe expression patterns of genes involved inanterior-posterior axis specification withoutreading the spatial patterns of the transcriptionfactors themselves? Or is there a fundamentaldifference between models appropriatefor regulatory networks that respond to a morphogengradient versus more downstream networksthat impart tissue-specific expression?Notably, Zinzen et al. 2 found that differenttranscription factor occupancy profiles mayyield the same regulatory activity. Althoughthis has been implicit in existing models of cisregulatorylogic 4 , definitive examples such asthose highlighted here are rare. Moreover, theauthors observed that diverse cis-regulatorymodules with similar activity were bound bya key common regulator (e.g., Twi for mesodermand Bin for visceral muscle), with othertranscription factors acting on specific cis-regulatorymodules to modulate the gene expressionpattern. This may prove to be a generaldesign principle for achieving expression patternsthat exhibit the same tissue specificitywhile allowing for minor differences.The novelty of the authors’ approach liesin predicting expression solely from quantitativetranscription factor occupancy values.This raises the possibility of incorporatingdirect occupancy measurements (from ChIPchipor ChIP-Seq experiments) into previous,sequence-based models of expression 4 , whichattempt to predict transcription factor occupanciesand use these to explain the expressionpattern. Such a combination might leadto greater predictive power compared withapproaches based on sequence or occupancyalone. Future modeling efforts are also likely142 volume 28 number 2 february 2010 nature biotechnology
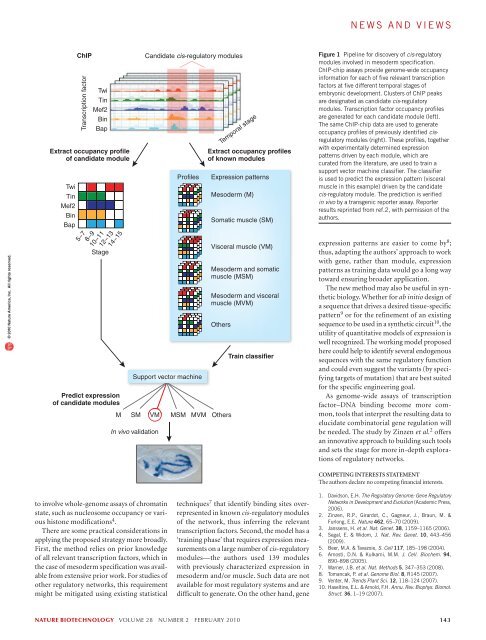
news and views© 2010 Nature America, Inc. All rights reserved.TwiTinMef2BinBapChIPTranscription factorTwiTinMef2BinBapExtract occupancy profileof candidate module5−78−9Stage10−1112−1314−15Predict expressionof candidate modulesProfilesSupport vector machineM SM VMIn vivo validationCandidate cis-regulatory modulesExtract occupancy profilesof known modulesExpression patternsMesoderm (M)Somatic muscle (SM)Visceral muscle (VM)Mesoderm and somaticmuscle (MSM)Mesoderm and visceralmuscle (MVM)OthersMSM MVM OthersTemporal stageTrain classifierFigure 1 Pipeline for discovery of cis-regulatorymodules involved in mesoderm specification.ChIP-chip assays provide genome-wide occupancyinformation for each of five relevant transcriptionfactors at five different temporal stages ofembryonic development. Clusters of ChIP peaksare designated as candidate cis-regulatorymodules. Transcription factor occupancy profilesare generated for each candidate module (left).The same ChIP-chip data are used to generateoccupancy profiles of previously identified cisregulatorymodules (right). These profiles, togetherwith experimentally determined expressionpatterns driven by each module, which arecurated from the literature, are used to train asupport vector machine classifier. The classifieris used to predict the expression pattern (visceralmuscle in this example) driven by the candidatecis-regulatory module. The prediction is verifiedin vivo by a transgenic reporter assay. Reporterresults reprinted from ref.2, with permission of theauthors.expression patterns are easier to come by 8 ;thus, adapting the authors’ approach to workwith gene, rather than module, expressionpatterns as training data would go a long waytoward ensuring broader application.The new method may also be useful in syntheticbiology. Whether for ab initio design ofa sequence that drives a desired tissue-specificpattern 9 or for the refinement of an existingsequence to be used in a synthetic circuit 10 , theutility of quantitative models of expression iswell recognized. The working model proposedhere could help to identify several endogenoussequences with the same regulatory functionand could even suggest the variants (by specifyingtargets of mutation) that are best suitedfor the specific <strong>engineering</strong> goal.As genome-wide assays of transcriptionfactor–DNA binding become more common,tools that interpret the resulting data toelucidate combinatorial gene regulation willbe needed. The study by Zinzen et al. 2 offersan innovative approach to building such toolsand sets the stage for more in-depth explorationsof regulatory networks.COMPETING INTERESTS STATEMENTThe authors declare no competing financial interests.to involve whole-genome assays of chromatinstate, such as nucleosome occupancy or varioushistone modifications 4 .There are some practical considerations inapplying the proposed strategy more broadly.First, the method relies on prior knowledgeof all relevant transcription factors, which inthe case of mesoderm specification was availablefrom extensive prior work. For studies ofother regulatory networks, this requirementmight be mitigated using existing statisticaltechniques 7 that identify binding sites overrepresentedin known cis-regulatory modulesof the network, thus inferring the relevanttranscription factors. Second, the model has a‘training phase’ that requires expression measurementson a large number of cis-regulatorymodules—the authors used 139 moduleswith previously characterized expression inmesoderm and/or muscle. Such data are notavailable for most regulatory systems and aredifficult to generate. On the other hand, gene1. Davidson, E.H. The Regulatory Genome: Gene RegulatoryNetworks in Development and Evolution (Academic Press,2006).2. Zinzen, R.P., Girardot, C., Gagneur, J., Braun, M. &Furlong, E.E. Nature 462, 65–70 (2009).3. Janssens, H. et al. Nat. Genet. 38, 1159–1165 (2006).4. Segal, E. & Widom, J. Nat. Rev. Genet. 10, 443–456(2009).5. Beer, M.A. & Tavazoie, S. Cell 117, 185–198 (2004).6. Arnosti, D.N. & Kulkarni, M.M. J. Cell. Biochem. 94,890–898 (2005).7. Warner, J.B. et al. Nat. Methods 5, 347–353 (2008).8. Tomancak, P. et al. Genome Biol. 8, R145 (2007).9. Venter, M. Trends Plant Sci. 12, 118–124 (2007).10. Haseltine, E.L. & Arnold, F.H. Annu. Rev. Biophys. Biomol.Struct. 36, 1–19 (2007).nature biotechnology volume 28 number 2 february 2010 143
- Page 3 and 4: volume 28 number 2 february 2010COM
- Page 5 and 6: in this issue© 2010 Nature America
- Page 7 and 8: © 2010 Nature America, Inc. All ri
- Page 10 and 11: NEWS© 2010 Nature America, Inc. Al
- Page 12 and 13: NEWS© 2010 Nature America, Inc. Al
- Page 14 and 15: NEWS© 2010 Nature America, Inc. Al
- Page 16 and 17: © 2010 Nature America, Inc. All ri
- Page 18 and 19: © 2010 Nature America, Inc. All ri
- Page 20 and 21: © 2010 Nature America, Inc. All ri
- Page 22 and 23: NEWS feature© 2010 Nature America,
- Page 24 and 25: uilding a businessComing to termsDa
- Page 26 and 27: uilding a business© 2010 Nature Am
- Page 28 and 29: correspondence© 2010 Nature Americ
- Page 30 and 31: correspondence© 2010 Nature Americ
- Page 32 and 33: correspondence© 2010 Nature Americ
- Page 34 and 35: correspondence© 2010 Nature Americ
- Page 36 and 37: case studyNever againcommentaryChri
- Page 38 and 39: COMMENTARY© 2010 Nature America, I
- Page 40 and 41: COMMENTARY© 2010 Nature America, I
- Page 42 and 43: patents© 2010 Nature America, Inc.
- Page 44 and 45: patents© 2010 Nature America, Inc.
- Page 48 and 49: news and viewsFrom genomics to crop
- Page 50 and 51: news and views© 2010 Nature Americ
- Page 52 and 53: news and views© 2010 Nature Americ
- Page 54 and 55: e s o u r c eRational association o
- Page 56 and 57: e s o u r c e© 2010 Nature America
- Page 58 and 59: e s o u r c e© 2010 Nature America
- Page 60 and 61: e s o u r c e© 2010 Nature America
- Page 62 and 63: © 2010 Nature America, Inc. All ri
- Page 64 and 65: B r i e f c o m m u n i c at i o n
- Page 66 and 67: i e f c o m m u n i c at i o n sAUT
- Page 68 and 69: lettersa1.5 kb hVPrIntron 112.5 kbA
- Page 70 and 71: letters© 2010 Nature America, Inc.
- Page 72 and 73: letters© 2010 Nature America, Inc.
- Page 74 and 75: l e t t e r sReal-time imaging of h
- Page 76 and 77: l e t t e r sFigure 2 Time-lapse li
- Page 78 and 79: l e t t e r s© 2010 Nature America
- Page 80 and 81: l e t t e r sRational design of cat
- Page 82 and 83: l e t t e r s© 2010 Nature America
- Page 84 and 85: l e t t e r s© 2010 Nature America
- Page 86 and 87: sample fluorescence was measured as
- Page 88 and 89: careers and recruitmentFourth quart