Annual Report 2003-2004 - UCLA Graduate Division
Annual Report 2003-2004 - UCLA Graduate Division
Annual Report 2003-2004 - UCLA Graduate Division

You also want an ePaper? Increase the reach of your titles
YUMPU automatically turns print PDFs into web optimized ePapers that Google loves.
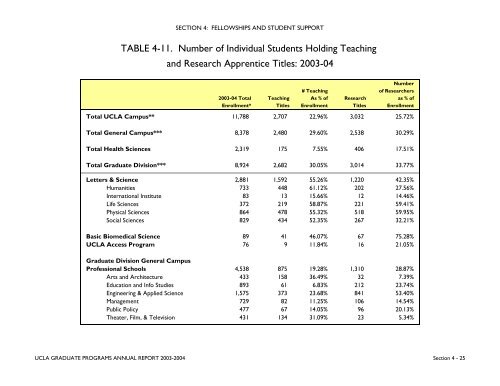
SECTION 4: FELLOWSHIPS AND STUDENT SUPPORTTABLE 4-11. Number of Individual Students Holding Teachingand Research Apprentice Titles: <strong>2003</strong>-04Number# Teaching of Researchers<strong>2003</strong>-04 Total Teaching As % of Research as % ofEnrollment* Titles Enrollment Titles EnrollmentTotal <strong>UCLA</strong> Campus** 11,788 2,707 22.96% 3,032 25.72%Total General Campus*** 8,378 2,480 29.60% 2,538 30.29%Total Health Sciences 2,319 175 7.55% 406 17.51%Total <strong>Graduate</strong> <strong>Division</strong>*** 8,924 2,682 30.05% 3,014 33.77%Letters & Science 2,881 1,592 55.26% 1,220 42.35%Humanities 733 448 61.12% 202 27.56%International Institute 83 13 15.66% 12 14.46%Life Sciences 372 219 58.87% 221 59.41%Physical Sciences 864 478 55.32% 518 59.95%Social Sciences 829 434 52.35% 267 32.21%Basic Biomedical Science 89 41 46.07% 67 75.28%<strong>UCLA</strong> Access Program 76 9 11.84% 16 21.05%<strong>Graduate</strong> <strong>Division</strong> General CampusProfessional Schools 4,538 875 19.28% 1,310 28.87%Arts and Architecture 433 158 36.49% 32 7.39%Education and Info Studies 893 61 6.83% 212 23.74%Engineering & Applied Science 1,575 373 23.68% 841 53.40%Management 729 82 11.25% 106 14.54%Public Policy 477 67 14.05% 96 20.13%Theater, Film, & Television 431 134 31.09% 23 5.34%<strong>UCLA</strong> GRADUATE PROGRAMS ANNUAL REPORT <strong>2003</strong>-<strong>2004</strong> Section 4 - 25