Annual Report 2003-2004 - UCLA Graduate Division
Annual Report 2003-2004 - UCLA Graduate Division
Annual Report 2003-2004 - UCLA Graduate Division

You also want an ePaper? Increase the reach of your titles
YUMPU automatically turns print PDFs into web optimized ePapers that Google loves.
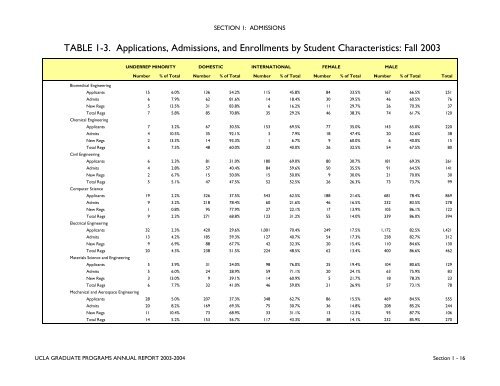
SECTION 1: ADMISSIONSTABLE 1-3. Applications, Admissions, and Enrollments by Student Characteristics: Fall <strong>2003</strong>UNDERREP MINORITY DOMESTIC INTERNATIONAL FEMALEMALENumber % of Total Number % of Total Number % of Total Number % of Total Number % of Total TotalBiomedical EngineeringApplicants 15 6.0% 136 54.2% 115 45.8% 84 33.5% 167 66.5% 251Admits 6 7.9% 62 81.6% 14 18.4% 30 39.5% 46 60.5% 76New Regs 5 13.5% 31 83.8% 6 16.2% 11 29.7% 26 70.3% 37Total Regs 7 5.8% 85 70.8% 35 29.2% 46 38.3% 74 61.7% 120Chemical EngineeringApplicants 7 3.2% 67 30.5% 153 69.5% 77 35.0% 143 65.0% 220Admits 4 10.5% 35 92.1% 3 7.9% 18 47.4% 20 52.6% 38New Regs 2 13.3% 14 93.3% 1 6.7% 9 60.0% 6 40.0% 15Total Regs 6 7.5% 48 60.0% 32 40.0% 26 32.5% 54 67.5% 80Civil EngineeringApplicants 6 2.3% 81 31.0% 180 69.0% 80 30.7% 181 69.3% 261Admits 4 2.8% 57 40.4% 84 59.6% 50 35.5% 91 64.5% 141New Regs 2 6.7% 15 50.0% 15 50.0% 9 30.0% 21 70.0% 30Total Regs 5 5.1% 47 47.5% 52 52.5% 26 26.3% 73 73.7% 99Computer ScienceApplicants 19 2.2% 326 37.5% 543 62.5% 188 21.6% 681 78.4% 869Admits 9 3.2% 218 78.4% 60 21.6% 46 16.5% 232 83.5% 278New Regs 1 0.8% 95 77.9% 27 22.1% 17 13.9% 105 86.1% 122Total Regs 9 2.3% 271 68.8% 123 31.2% 55 14.0% 339 86.0% 394Electrical EngineeringApplicants 32 2.3% 420 29.6% 1,001 70.4% 249 17.5% 1,172 82.5% 1,421Admits 13 4.2% 185 59.3% 127 40.7% 54 17.3% 258 82.7% 312New Regs 9 6.9% 88 67.7% 42 32.3% 20 15.4% 110 84.6% 130Total Regs 20 4.3% 238 51.5% 224 48.5% 62 13.4% 400 86.6% 462Materials Science and EngineeringApplicants 5 3.9% 31 24.0% 98 76.0% 25 19.4% 104 80.6% 129Admits 5 6.0% 24 28.9% 59 71.1% 20 24.1% 63 75.9% 83New Regs 3 13.0% 9 39.1% 14 60.9% 5 21.7% 18 78.3% 23Total Regs 6 7.7% 32 41.0% 46 59.0% 21 26.9% 57 73.1% 78Mechanical and Aerospace EngineeringApplicants 28 5.0% 207 37.3% 348 62.7% 86 15.5% 469 84.5% 555Admits 20 8.2% 169 69.3% 75 30.7% 36 14.8% 208 85.2% 244New Regs 11 10.4% 73 68.9% 33 31.1% 13 12.3% 93 87.7% 106Total Regs 14 5.2% 153 56.7% 117 43.3% 38 14.1% 232 85.9% 270<strong>UCLA</strong> GRADUATE PROGRAMS ANNUAL REPORT <strong>2003</strong>-<strong>2004</strong> Section 1 - 16