Annual Report 2003-2004 - UCLA Graduate Division
Annual Report 2003-2004 - UCLA Graduate Division
Annual Report 2003-2004 - UCLA Graduate Division

You also want an ePaper? Increase the reach of your titles
YUMPU automatically turns print PDFs into web optimized ePapers that Google loves.
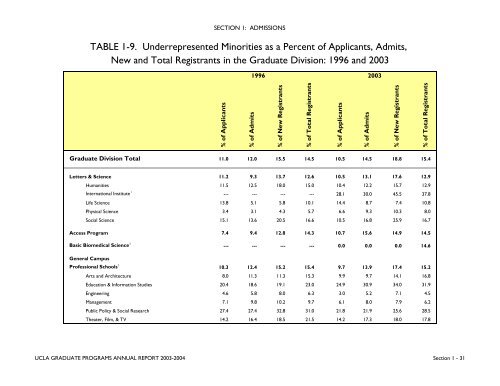
SECTION 1: ADMISSIONSTABLE 1-9. Underrepresented Minorities as a Percent of Applicants, Admits,New and Total Registrants in the <strong>Graduate</strong> <strong>Division</strong>: 1996 and <strong>2003</strong>1996 <strong>2003</strong>% of Applicants% of Admits% of New Registrants% of Total Registrants% of Applicants% of Admits% of New Registrants% of Total Registrants<strong>Graduate</strong> <strong>Division</strong> Total 11.0 12.0 15.5 14.5 10.5 14.5 18.8 15.4Letters & Science 11.2 9.3 13.7 12.6 10.5 13.1 17.6 12.9Humanities 11.5 12.5 18.0 15.0 10.4 12.2 15.7 12.9International Institute 1 --- --- --- --- 28.1 30.0 45.5 37.8Life Science 13.8 5.1 5.8 10.1 14.4 8.7 7.4 10.8Physical Science 3.4 3.1 4.3 5.7 6.6 9.3 10.3 8.0Social Science 15.1 13.6 20.5 16.6 10.5 16.8 25.9 16.7Access Program 7.4 9.4 12.8 14.3 10.7 15.6 14.9 14.5Basic Biomedical Science 2 --- --- --- --- 0.0 0.0 0.0 14.6General CampusProfessional Schools 3 10.3 12.4 15.2 15.4 9.7 13.9 17.4 15.2Arts and Architecture 8.0 11.3 11.3 15.3 9.9 9.7 14.1 16.8Education & Information Studies 20.4 18.6 19.1 23.0 24.9 30.9 34.0 31.9Engineering 4.6 5.8 8.0 6.3 3.0 5.2 7.1 4.5Management 7.1 9.8 10.2 9.7 6.1 8.0 7.9 6.2Public Policy & Social Research 27.4 27.4 32.8 31.0 21.8 21.9 25.6 28.5Theater, Film, & TV 14.2 16.4 18.5 21.5 14.2 17.3 18.0 17.8<strong>UCLA</strong> GRADUATE PROGRAMS ANNUAL REPORT <strong>2003</strong>-<strong>2004</strong> Section 1 - 31