Annual Report 2003-2004 - UCLA Graduate Division
Annual Report 2003-2004 - UCLA Graduate Division
Annual Report 2003-2004 - UCLA Graduate Division

You also want an ePaper? Increase the reach of your titles
YUMPU automatically turns print PDFs into web optimized ePapers that Google loves.
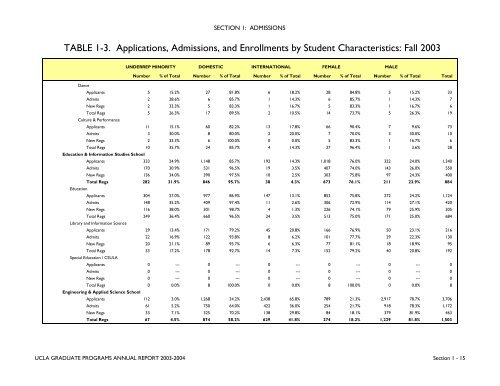
SECTION 1: ADMISSIONSTABLE 1-3. Applications, Admissions, and Enrollments by Student Characteristics: Fall <strong>2003</strong>UNDERREP MINORITY DOMESTIC INTERNATIONAL FEMALEMALENumber % of Total Number % of Total Number % of Total Number % of Total Number % of Total TotalDanceApplicants 5 15.2% 27 81.8% 6 18.2% 28 84.8% 5 15.2% 33Admits 2 28.6% 6 85.7% 1 14.3% 6 85.7% 1 14.3% 7New Regs 2 33.3% 5 83.3% 1 16.7% 5 83.3% 1 16.7% 6Total Regs 5 26.3% 17 89.5% 2 10.5% 14 73.7% 5 26.3% 19Culture & PerformanceApplicants 11 15.1% 60 82.2% 13 17.8% 66 90.4% 7 9.6% 73Admits 3 30.0% 8 80.0% 2 20.0% 7 70.0% 3 30.0% 10New Regs 2 33.3% 6 100.0% 0 0.0% 5 83.3% 1 16.7% 6Total Regs 10 35.7% 24 85.7% 4 14.3% 27 96.4% 1 3.6% 28Education & Information Studies SchoolApplicants 333 24.9% 1,148 85.7% 192 14.3% 1,018 76.0% 322 24.0% 1,340Admits 170 30.9% 531 96.5% 19 3.5% 407 74.0% 143 26.0% 550New Regs 136 34.0% 390 97.5% 10 2.5% 303 75.8% 97 24.3% 400Total Regs 282 31.9% 846 95.7% 38 4.3% 673 76.1% 211 23.9% 884EducationApplicants 304 27.0% 977 86.9% 147 13.1% 852 75.8% 272 24.2% 1,124Admits 148 35.2% 409 97.4% 11 2.6% 306 72.9% 114 27.1% 420New Regs 116 38.0% 301 98.7% 4 1.3% 226 74.1% 79 25.9% 305Total Regs 249 36.4% 660 96.5% 24 3.5% 513 75.0% 171 25.0% 684Library and Information ScienceApplicants 29 13.4% 171 79.2% 45 20.8% 166 76.9% 50 23.1% 216Admits 22 16.9% 122 93.8% 8 6.2% 101 77.7% 29 22.3% 130New Regs 20 21.1% 89 93.7% 6 6.3% 77 81.1% 18 18.9% 95Total Regs 33 17.2% 178 92.7% 14 7.3% 152 79.2% 40 20.8% 192Special Education / CSULAApplicants 0 --- 0 --- 0 --- 0 --- 0 --- 0Admits 0 --- 0 --- 0 --- 0 --- 0 --- 0New Regs 0 --- 0 --- 0 --- 0 --- 0 --- 0Total Regs 0 0.0% 8 100.0% 0 0.0% 8 100.0% 0 0.0% 8Engineering & Applied Science SchoolApplicants 112 3.0% 1,268 34.2% 2,438 65.8% 789 21.3% 2,917 78.7% 3,706Admits 61 5.2% 750 64.0% 422 36.0% 254 21.7% 918 78.3% 1,172New Regs 33 7.1% 325 70.2% 138 29.8% 84 18.1% 379 81.9% 463Total Regs 67 4.5% 874 58.2% 629 41.8% 274 18.2% 1,229 81.8% 1,503<strong>UCLA</strong> GRADUATE PROGRAMS ANNUAL REPORT <strong>2003</strong>-<strong>2004</strong> Section 1 - 15