Annual Report 2003-2004 - UCLA Graduate Division
Annual Report 2003-2004 - UCLA Graduate Division
Annual Report 2003-2004 - UCLA Graduate Division

You also want an ePaper? Increase the reach of your titles
YUMPU automatically turns print PDFs into web optimized ePapers that Google loves.
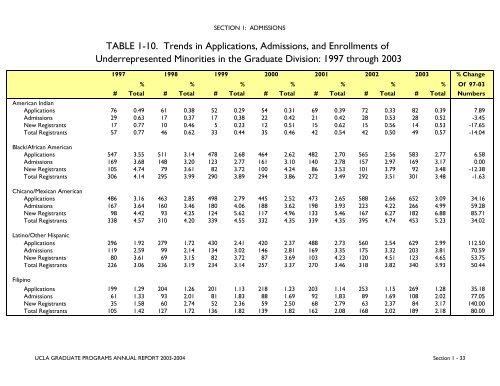
SECTION 1: ADMISSIONS% Change% % % % % % % Of 97-03# Total # Total # Total # Total # Total # Total # Total NumbersAmerican IndianApplications 76 0.49 61 0.38 52 0.29 54 0.31 69 0.39 72 0.33 82 0.39 7.89Admissions 29 0.63 17 0.37 17 0.38 22 0.42 21 0.42 28 0.53 28 0.52 -3.45New Registrants 17 0.77 10 0.46 5 0.23 12 0.51 15 0.62 15 0.56 14 0.53 -17.65Total Registrants 57 0.77 46 0.62 33 0.44 35 0.46 42 0.54 42 0.50 49 0.57 -14.04Black/African AmericanApplications 547 3.55 511 3.14 478 2.68 464 2.62 482 2.70 565 2.56 583 2.77 6.58Admissions 169 3.68 148 3.20 123 2.77 161 3.10 140 2.78 157 2.97 169 3.17 0.00New Registrants 105 4.74 79 3.61 82 3.72 100 4.24 86 3.53 101 3.79 92 3.48 -12.38Total Registrants 306 4.14 295 3.99 290 3.89 294 3.86 272 3.49 292 3.51 301 3.48 -1.63Chicano/Mexican AmericanApplications 486 3.16 463 2.85 498 2.79 445 2.52 473 2.65 588 2.66 652 3.09 34.16Admissions 167 3.64 160 3.46 180 4.06 188 3.62 198 3.93 223 4.22 266 4.99 59.28New Registrants 98 4.42 93 4.25 124 5.62 117 4.96 133 5.46 167 6.27 182 6.88 85.71Total Registrants 338 4.57 310 4.20 339 4.55 332 4.35 339 4.35 395 4.74 453 5.23 34.02Latino/Other HispanicApplications 296 1.92 279 1.72 430 2.41 420 2.37 488 2.73 560 2.54 629 2.99 112.50Admissions 119 2.59 99 2.14 134 3.02 146 2.81 169 3.35 175 3.32 203 3.81 70.59New Registrants 80 3.61 69 3.15 82 3.72 87 3.69 103 4.23 120 4.51 123 4.65 53.75Total Registrants 226 3.06 236 3.19 234 3.14 257 3.37 270 3.46 318 3.82 340 3.93 50.44FilipinoTABLE 1-10. Trends in Applications, Admissions, and Enrollments ofUnderrepresented Minorities in the <strong>Graduate</strong> <strong>Division</strong>: 1997 through <strong>2003</strong>1997 19981999 2000 2001 2002 <strong>2003</strong>Applications 199 1.29 204 1.26 201 1.13 218 1.23 203 1.14 253 1.15 269 1.28 35.18Admissions 61 1.33 93 2.01 81 1.83 88 1.69 92 1.83 89 1.69 108 2.02 77.05New Registrants 35 1.58 60 2.74 52 2.36 59 2.50 68 2.79 63 2.37 84 3.17 140.00Total Registrants 105 1.42 127 1.72 136 1.82 139 1.82 162 2.08 168 2.02 189 2.18 80.00<strong>UCLA</strong> GRADUATE PROGRAMS ANNUAL REPORT <strong>2003</strong>-<strong>2004</strong> Section 1 - 33