Annual Report 2003-2004 - UCLA Graduate Division
Annual Report 2003-2004 - UCLA Graduate Division
Annual Report 2003-2004 - UCLA Graduate Division

You also want an ePaper? Increase the reach of your titles
YUMPU automatically turns print PDFs into web optimized ePapers that Google loves.
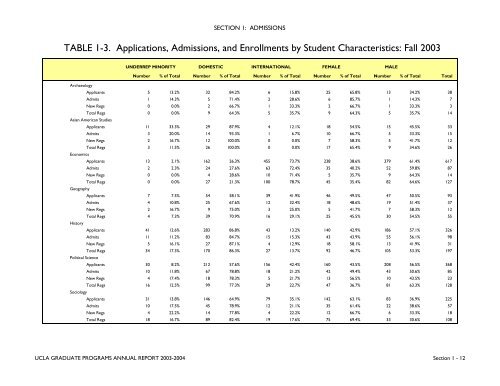
SECTION 1: ADMISSIONSTABLE 1-3. Applications, Admissions, and Enrollments by Student Characteristics: Fall <strong>2003</strong>UNDERREP MINORITY DOMESTIC INTERNATIONAL FEMALEMALENumber % of Total Number % of Total Number % of Total Number % of Total Number % of Total TotalArchaeologyApplicants 5 13.2% 32 84.2% 6 15.8% 25 65.8% 13 34.2% 38Admits 1 14.3% 5 71.4% 2 28.6% 6 85.7% 1 14.3% 7New Regs 0 0.0% 2 66.7% 1 33.3% 2 66.7% 1 33.3% 3Total Regs 0 0.0% 9 64.3% 5 35.7% 9 64.3% 5 35.7% 14Asian American StudiesApplicants 11 33.3% 29 87.9% 4 12.1% 18 54.5% 15 45.5% 33Admits 3 20.0% 14 93.3% 1 6.7% 10 66.7% 5 33.3% 15New Regs 2 16.7% 12 100.0% 0 0.0% 7 58.3% 5 41.7% 12Total Regs 3 11.5% 26 100.0% 0 0.0% 17 65.4% 9 34.6% 26EconomicsApplicants 13 2.1% 162 26.3% 455 73.7% 238 38.6% 379 61.4% 617Admits 2 2.3% 24 27.6% 63 72.4% 35 40.2% 52 59.8% 87New Regs 0 0.0% 4 28.6% 10 71.4% 5 35.7% 9 64.3% 14Total Regs 0 0.0% 27 21.3% 100 78.7% 45 35.4% 82 64.6% 127GeographyApplicants 7 7.5% 54 58.1% 39 41.9% 46 49.5% 47 50.5% 93Admits 4 10.8% 25 67.6% 12 32.4% 18 48.6% 19 51.4% 37New Regs 2 16.7% 9 75.0% 3 25.0% 5 41.7% 7 58.3% 12Total Regs 4 7.3% 39 70.9% 16 29.1% 25 45.5% 30 54.5% 55HistoryApplicants 41 12.6% 283 86.8% 43 13.2% 140 42.9% 186 57.1% 326Admits 11 11.2% 83 84.7% 15 15.3% 43 43.9% 55 56.1% 98New Regs 5 16.1% 27 87.1% 4 12.9% 18 58.1% 13 41.9% 31Total Regs 34 17.3% 170 86.3% 27 13.7% 92 46.7% 105 53.3% 197Political ScienceApplicants 30 8.2% 212 57.6% 156 42.4% 160 43.5% 208 56.5% 368Admits 10 11.8% 67 78.8% 18 21.2% 42 49.4% 43 50.6% 85New Regs 4 17.4% 18 78.3% 5 21.7% 13 56.5% 10 43.5% 23Total Regs 16 12.5% 99 77.3% 29 22.7% 47 36.7% 81 63.3% 128SociologyApplicants 31 13.8% 146 64.9% 79 35.1% 142 63.1% 83 36.9% 225Admits 10 17.5% 45 78.9% 12 21.1% 35 61.4% 22 38.6% 57New Regs 4 22.2% 14 77.8% 4 22.2% 12 66.7% 6 33.3% 18Total Regs 18 16.7% 89 82.4% 19 17.6% 75 69.4% 33 30.6% 108<strong>UCLA</strong> GRADUATE PROGRAMS ANNUAL REPORT <strong>2003</strong>-<strong>2004</strong> Section 1 - 12