Underrepresented Minorities*Merit-BasedFundingSECTION 4: FELLOWSHIPS AND STUDENT SUPPORTTABLE 4-4. Type of Support and Student Category for All <strong>Graduate</strong> Programs: <strong>2003</strong>-<strong>2004</strong><strong>UCLA</strong> StaffEmployment Financial Aid Loans Total FundingNumber & Pct. ofEnrollment 03-04Number Supported/Enrolled 1,115 385 326 1,040 1,564 1,720Support Received $17,709,693 $4,310,911 $2,020,286 $18,192,072 $42,232,962 14.59%Per Capita Support** $15,883 $11,197 $6,197 $17,492 $27,003% of Aid Type 12.48% 20.26% 19.97% 18.71% 15.61%% of URM Receiving 41.93% 10.21% 4.78% 43.08% 100.00%Other DomesticNumber Supported/Enrolled 4,830 1,359 1,430 3,875 6,950 8,193Support Received $83,951,725 $15,213,421 $7,344,584 $77,017,273 $183,527,003 69.50%Per Capita Support** $17,381 $11,195 $5,136 $19,875 $26,407% of Aid Type 59.15% 71.50% 72.60% 79.20% 67.83%% of Non-Minority Domestic Receiving 45.74% 8.29% 4.00% 41.97% 100.00%International StudentsNumber Supported/Enrolled 1,468 254 86 59 1,556 1,875Support Received $40,272,207 $1,752,040 $751,800 $2,030,449 $44,806,496 15.91%Per Capita Support** $27,433 $6,898 $8,742 $34,414 $28,796% of Aid Type 28.37% 8.23% 7.43% 2.09% 16.56%% of International Students Receiving 89.88% 3.91% 1.68% 4.53% 100.00%Total <strong>UCLA</strong> <strong>Graduate</strong> ProgramsNumber Supported/Enrolled 7,413 1,998 1,842 4,974 10,070 11,788Support Received $141,933,625 $21,276,372 $10,116,670 $97,239,794 $270,566,461 100.00%Per Capita Support** $19,147 $10,649 $5,492 $19,550 $26,869% of Aid Type 100.00% 100.00% 100.00% 100.00% 100.00%% of Total Receiving 52.46% 7.86% 3.74% 35.94% 100.00%FemaleNumber Supported/Enrolled 3,554 1,108 932 2,544 4,884 5,634Support Received $64,025,225 $12,739,278 $5,040,256 $46,877,823 $128,682,582 47.79%Per Capita Support** $18,015 $11,498 $5,408 $18,427 $26,348% of Aid Type 45.11% 59.88% 49.82% 48.21% 47.56%% of Females Receiving 49.75% 9.90% 3.92% 36.43% 100.00%MaleNumber Supported/Enrolled 3,859 890 910 2,430 5,186 6,154Support Received $77,908,400 $8,537,094 $5,076,414 $50,361,971 $141,883,879 52.21%Per Capita Support** $20,189 $9,592 $5,578 $20,725 $27,359% of Aid Type 54.89% 40.12% 50.18% 51.79% 52.44%% of Males Receiving 54.91% 6.02% 3.58% 35.50% 100.00%NOTES:* Underrepresented Minorities include American Indians, African-Americans, Chicanos/Mexican-Americans, Latinos/Other Hispanic, and Filipinos**Per Capita support is based on the number of students actually receiving supportSources: <strong>UCLA</strong> Student Records System, <strong>UCLA</strong> Financial Aid Management System, and <strong>UCLA</strong> Payroll System<strong>UCLA</strong> GRADUATE PROGRAMS ANNUAL REPORT <strong>2003</strong>-<strong>2004</strong> Section 4 - 18
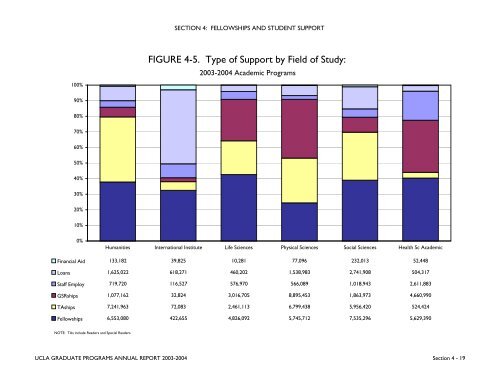
SECTION 4: FELLOWSHIPS AND STUDENT SUPPORT100%FIGURE 4-5. Type of Support by Field of Study:<strong>2003</strong>-<strong>2004</strong> Academic Programs90%80%70%60%50%40%30%20%10%0%Humanities International Institute Life Sciences Physical Sciences Social Sciences Health Sc AcademicFinancial Aid 133,182 39,825 10,281 77,096 232,013 52,448Loans 1,625,022 618,271 460,202 1,538,983 2,741,908 504,317Staff Employ 719,720 116,527 576,970 566,089 1,018,943 2,611,883GSRships 1,077,162 32,824 3,016,705 8,895,453 1,863,973 4,660,990TAships 7,241,963 72,083 2,461,113 6,799,438 5,956,420 524,424Fellowships 6,553,080 422,655 4,826,092 5,745,712 7,535,296 5,629,390NOTE: TAs include Readers and Special Readers<strong>UCLA</strong> GRADUATE PROGRAMS ANNUAL REPORT <strong>2003</strong>-<strong>2004</strong> Section 4 - 19