Annual Report 2003-2004 - UCLA Graduate Division
Annual Report 2003-2004 - UCLA Graduate Division
Annual Report 2003-2004 - UCLA Graduate Division

You also want an ePaper? Increase the reach of your titles
YUMPU automatically turns print PDFs into web optimized ePapers that Google loves.
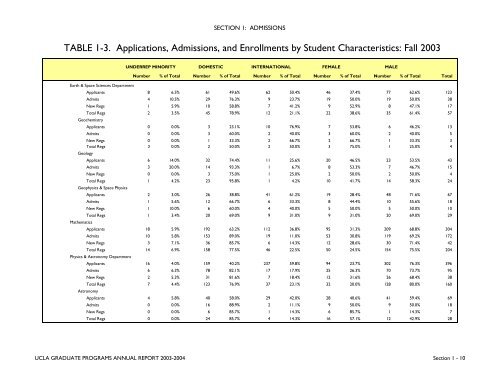
SECTION 1: ADMISSIONSTABLE 1-3. Applications, Admissions, and Enrollments by Student Characteristics: Fall <strong>2003</strong>UNDERREP MINORITY DOMESTIC INTERNATIONAL FEMALEMALEEarth & Space Sciences DepartmentNumber % of Total Number % of Total Number % of Total Number % of Total Number % of Total TotalApplicants 8 6.5% 61 49.6% 62 50.4% 46 37.4% 77 62.6% 123Admits 4 10.5% 29 76.3% 9 23.7% 19 50.0% 19 50.0% 38New Regs 1 5.9% 10 58.8% 7 41.2% 9 52.9% 8 47.1% 17Total Regs 2 3.5% 45 78.9% 12 21.1% 22 38.6% 35 61.4% 57GeochemistryApplicants 0 0.0% 3 23.1% 10 76.9% 7 53.8% 6 46.2% 13Admits 0 0.0% 3 60.0% 2 40.0% 3 60.0% 2 40.0% 5New Regs 0 0.0% 1 33.3% 2 66.7% 2 66.7% 1 33.3% 3Total Regs 0 0.0% 2 50.0% 2 50.0% 3 75.0% 1 25.0% 4GeologyApplicants 6 14.0% 32 74.4% 11 25.6% 20 46.5% 23 53.5% 43Admits 3 20.0% 14 93.3% 1 6.7% 8 53.3% 7 46.7% 15New Regs 0 0.0% 3 75.0% 1 25.0% 2 50.0% 2 50.0% 4Total Regs 1 4.2% 23 95.8% 1 4.2% 10 41.7% 14 58.3% 24Geophysics & Space PhysicsApplicants 2 3.0% 26 38.8% 41 61.2% 19 28.4% 48 71.6% 67Admits 1 5.6% 12 66.7% 6 33.3% 8 44.4% 10 55.6% 18New Regs 1 10.0% 6 60.0% 4 40.0% 5 50.0% 5 50.0% 10Total Regs 1 3.4% 20 69.0% 9 31.0% 9 31.0% 20 69.0% 29MathematicsApplicants 18 5.9% 192 63.2% 112 36.8% 95 31.3% 209 68.8% 304Admits 10 5.8% 153 89.0% 19 11.0% 53 30.8% 119 69.2% 172New Regs 3 7.1% 36 85.7% 6 14.3% 12 28.6% 30 71.4% 42Total Regs 14 6.9% 158 77.5% 46 22.5% 50 24.5% 154 75.5% 204Physics & Astronomy DepartmentApplicants 16 4.0% 159 40.2% 237 59.8% 94 23.7% 302 76.3% 396Admits 6 6.3% 78 82.1% 17 17.9% 25 26.3% 70 73.7% 95New Regs 2 5.3% 31 81.6% 7 18.4% 12 31.6% 26 68.4% 38Total Regs 7 4.4% 123 76.9% 37 23.1% 32 20.0% 128 80.0% 160AstronomyApplicants 4 5.8% 40 58.0% 29 42.0% 28 40.6% 41 59.4% 69Admits 0 0.0% 16 88.9% 2 11.1% 9 50.0% 9 50.0% 18New Regs 0 0.0% 6 85.7% 1 14.3% 6 85.7% 1 14.3% 7Total Regs 0 0.0% 24 85.7% 4 14.3% 16 57.1% 12 42.9% 28<strong>UCLA</strong> GRADUATE PROGRAMS ANNUAL REPORT <strong>2003</strong>-<strong>2004</strong> Section 1 - 10