Annual Report 2003-2004 - UCLA Graduate Division
Annual Report 2003-2004 - UCLA Graduate Division
Annual Report 2003-2004 - UCLA Graduate Division

Create successful ePaper yourself
Turn your PDF publications into a flip-book with our unique Google optimized e-Paper software.
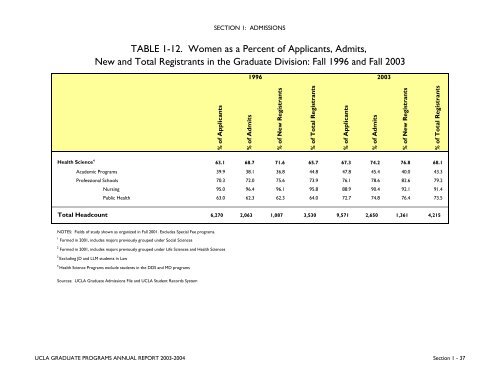
SECTION 1: ADMISSIONSTABLE 1-12. Women as a Percent of Applicants, Admits,New and Total Registrants in the <strong>Graduate</strong> <strong>Division</strong>: Fall 1996 and Fall <strong>2003</strong>1996 <strong>2003</strong>% of Applicants% of Admits% of New Registrants% of Total Registrants% of Applicants% of Admits% of New Registrants% of Total RegistrantsHealth Science 4 63.1 68.7 71.6 65.7 67.3 74.2 76.8 68.1Academic Programs 39.9 38.1 36.8 44.8 47.8 45.4 40.0 43.3Professional Schools 70.3 72.0 75.6 73.9 76.1 78.6 82.6 79.2Nursing 95.0 96.4 96.1 95.8 88.9 90.4 92.1 91.4Public Health 63.0 62.3 62.3 64.0 72.7 74.8 76.4 73.5Total Headcount 6,270 2,063 1,087 3,530 9,571 2,650 1,361 4,215NOTES: Fields of study shown as organized in Fall 2001. Excludes Special Fee programs.1 Formed in 2001, includes majors previously grouped under Social Sciences2 Formed in 2001, includes majors previously grouped under Life Sciences and Health Sciences3Excluding JD and LLM students in Law4Health Science Programs exclude students in the DDS and MD programsSources: <strong>UCLA</strong> <strong>Graduate</strong> Admissions File and <strong>UCLA</strong> Student Records System<strong>UCLA</strong> GRADUATE PROGRAMS ANNUAL REPORT <strong>2003</strong>-<strong>2004</strong> Section 1 - 37