Annual Report 2003-2004 - UCLA Graduate Division
Annual Report 2003-2004 - UCLA Graduate Division
Annual Report 2003-2004 - UCLA Graduate Division

Create successful ePaper yourself
Turn your PDF publications into a flip-book with our unique Google optimized e-Paper software.
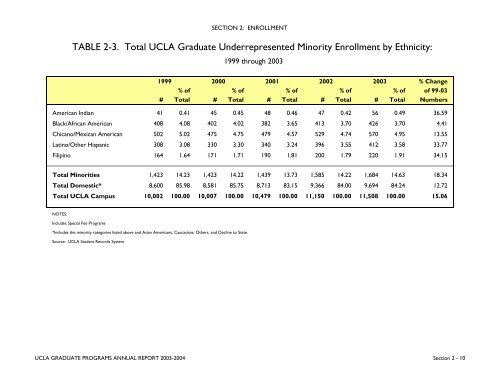
SECTION 2: ENROLLMENTTABLE 2-3. Total <strong>UCLA</strong> <strong>Graduate</strong> Underrepresented Minority Enrollment by Ethnicity:1999 through <strong>2003</strong>1999 2000 2001 2002 <strong>2003</strong> % Change% of % of % of % of % of of 99-03# Total # Total # Total # Total # Total NumbersAmerican Indian 41 0.41 45 0.45 48 0.46 47 0.42 56 0.49 36.59Black/African American 408 4.08 402 4.02 382 3.65 413 3.70 426 3.70 4.41Chicano/Mexican American 502 5.02 475 4.75 479 4.57 529 4.74 570 4.95 13.55Latino/Other Hispanic 308 3.08 330 3.30 340 3.24 396 3.55 412 3.58 33.77Filipino 164 1.64 171 1.71 190 1.81 200 1.79 220 1.91 34.15Total Minorities 1,423 14.23 1,423 14.22 1,439 13.73 1,585 14.22 1,684 14.63 18.34Total Domestic* 8,600 85.98 8,581 85.75 8,713 83.15 9,366 84.00 9,694 84.24 12.72Total <strong>UCLA</strong> Campus 10,002 100.00 10,007 100.00 10,479 100.00 11,150 100.00 11,508 100.00 15.06NOTES:Includes Special Fee Programs*Includes the minority categories listed above and Asian Americans, Caucasians, Others, and Decline to State.Source: <strong>UCLA</strong> Student Records System<strong>UCLA</strong> GRADUATE PROGRAMS ANNUAL REPORT <strong>2003</strong>-<strong>2004</strong> Section 2 - 10