Annual Report 2003-2004 - UCLA Graduate Division
Annual Report 2003-2004 - UCLA Graduate Division
Annual Report 2003-2004 - UCLA Graduate Division

You also want an ePaper? Increase the reach of your titles
YUMPU automatically turns print PDFs into web optimized ePapers that Google loves.
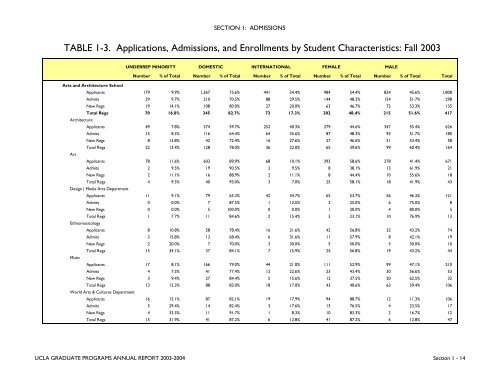
SECTION 1: ADMISSIONSTABLE 1-3. Applications, Admissions, and Enrollments by Student Characteristics: Fall <strong>2003</strong>UNDERREP MINORITY DOMESTIC INTERNATIONAL FEMALEMALENumber % of Total Number % of Total Number % of Total Number % of Total Number % of Total TotalArts and Architecture SchoolApplicants 179 9.9% 1,367 75.6% 441 24.4% 984 54.4% 824 45.6% 1,808Admits 29 9.7% 210 70.5% 88 29.5% 144 48.3% 154 51.7% 298New Regs 19 14.1% 108 80.0% 27 20.0% 63 46.7% 72 53.3% 135Total Regs 70 16.8% 345 82.7% 72 17.3% 202 48.4% 215 51.6% 417ArchitectureApplicants 49 7.8% 374 59.7% 252 40.3% 279 44.6% 347 55.4% 626Admits 15 8.3% 116 64.4% 64 35.6% 87 48.3% 93 51.7% 180New Regs 8 13.8% 42 72.4% 16 27.6% 27 46.6% 31 53.4% 58Total Regs 22 13.4% 128 78.0% 36 22.0% 65 39.6% 99 60.4% 164ArtApplicants 78 11.6% 603 89.9% 68 10.1% 393 58.6% 278 41.4% 671Admits 2 9.5% 19 90.5% 2 9.5% 8 38.1% 13 61.9% 21New Regs 2 11.1% 16 88.9% 2 11.1% 8 44.4% 10 55.6% 18Total Regs 4 9.3% 40 93.0% 3 7.0% 25 58.1% 18 41.9% 43Design | Media Arts DepartmentApplicants 11 9.1% 79 65.3% 42 34.7% 65 53.7% 56 46.3% 121Admits 0 0.0% 7 87.5% 1 12.5% 2 25.0% 6 75.0% 8New Regs 0 0.0% 5 100.0% 0 0.0% 1 20.0% 4 80.0% 5Total Regs 1 7.7% 11 84.6% 2 15.4% 3 23.1% 10 76.9% 13EthnomusicologyApplicants 8 10.8% 58 78.4% 16 21.6% 42 56.8% 32 43.2% 74Admits 3 15.8% 13 68.4% 6 31.6% 11 57.9% 8 42.1% 19New Regs 2 20.0% 7 70.0% 3 30.0% 5 50.0% 5 50.0% 10Total Regs 15 34.1% 37 84.1% 7 15.9% 25 56.8% 19 43.2% 44MusicApplicants 17 8.1% 166 79.0% 44 21.0% 111 52.9% 99 47.1% 210Admits 4 7.5% 41 77.4% 12 22.6% 23 43.4% 30 56.6% 53New Regs 3 9.4% 27 84.4% 5 15.6% 12 37.5% 20 62.5% 32Total Regs 13 12.3% 88 83.0% 18 17.0% 43 40.6% 63 59.4% 106World Arts & Cultures DepartmentApplicants 16 15.1% 87 82.1% 19 17.9% 94 88.7% 12 11.3% 106Admits 5 29.4% 14 82.4% 3 17.6% 13 76.5% 4 23.5% 17New Regs 4 33.3% 11 91.7% 1 8.3% 10 83.3% 2 16.7% 12Total Regs 15 31.9% 41 87.2% 6 12.8% 41 87.2% 6 12.8% 47<strong>UCLA</strong> GRADUATE PROGRAMS ANNUAL REPORT <strong>2003</strong>-<strong>2004</strong> Section 1 - 14