Annual Report 2009 - Isagen
Annual Report 2009 - Isagen
Annual Report 2009 - Isagen

Create successful ePaper yourself
Turn your PDF publications into a flip-book with our unique Google optimized e-Paper software.
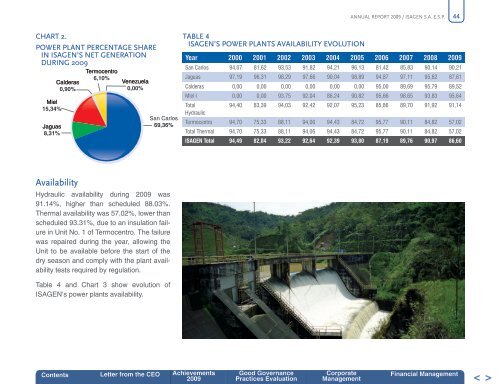
ANNUAL REPORT <strong>2009</strong> / ISAGEN S.A. E.S.P.44CHART 2.POWER PLANT PERCENTAGE SHAREIN ISAGEN’S NET GENERATIONDURING <strong>2009</strong>Miel15,34%Jaguas8,31%Calderas0,90%Termocentro6,10%Venezuela0,00%San Carlos69,36%TABLE 4ISAGEN’S POWER PLANTS AVAILABILITY EVOLUTIONYear 2000 2001 2002 2003 2004 2005 2006 2007 2008 <strong>2009</strong>San Carlos 94,07 81,62 93,53 91,82 94,21 96,13 81,42 85,83 90,14 90,21Jaguas 97,19 96,31 98,29 97,66 90,04 98,89 94,87 97,11 95,62 87,61Calderas 0,00 0,00 0,00 0,00 0,00 0,00 95,00 89,69 95,79 89,52Miel I 0,00 0,00 93,75 92,04 86,24 90,82 95,66 98,65 93,83 95,64Total94,40 83,39 94,03 92,42 92,07 95,23 85,86 89,70 91,92 91,14HydraulicTermocentro 94,70 75,33 88,11 94,06 94,43 84,72 95,77 90,11 84,82 57,02Total Thermal 94,70 75,33 88,11 94,06 94,43 84,72 95,77 90,11 84,82 57,02ISAGEN Total 94,49 82,04 93,22 92,64 92,39 93,80 87,19 89,76 90,97 86,60AvailabilityHydraulic availability during <strong>2009</strong> was91.14%, higher than scheduled 88.03%.Thermal availability was 57.02%, lower thanscheduled 93.31%, due to an insulation failurein Unit No. 1 of Termocentro. The failurewas repaired during the year, allowing theUnit to be available before the start of thedry season and comply with the plant availabilitytests required by regulation.Table 4 and Chart 3 show evolution ofISAGEN’s power plants availability.Contents Letter from the CEO Achievements<strong>2009</strong>Good GovernancePractices EvaluationCorporateManagementFinancial Management