Annual Report 2009 - Isagen
Annual Report 2009 - Isagen
Annual Report 2009 - Isagen

You also want an ePaper? Increase the reach of your titles
YUMPU automatically turns print PDFs into web optimized ePapers that Google loves.
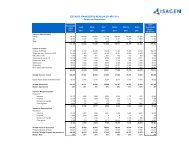
ANNUAL REPORT <strong>2009</strong> / ISAGEN S.A. E.S.P.85BALANCE SHEETIn <strong>2009</strong>, ISAGEN’s total assets amounted to $4,949,857 million, 18.2%up on 2008. Such positive variation is the result of a higher current assetsbalance, as a consequence of increased cash and investments, inturn explained by the revenues originated in the bond issues.TABLE 22.ASSETSAssets <strong>2009</strong> 2008Current Assets 1.217,909 677,208Non-Current Assets 2.696,538 2.473,918Re-Appraisals 1.035,410 1.037,219Total Assets 4.949,857 4.188,345Likewise, total liabilities grew from $1,055,854 million in 2008 to$1,603,994, an increase of 51.9% due mainly to larger debt correspondingto the first ISAGEN bond issue in the Colombian capital market for$450,000. The bonds that were 1.8x overbooked, had terms rangingbetween 7 and 15 years, 12 years weighted average term, and competitiverates. ISAGEN’s final debt balance for the year was $965,454 million,equivalent to 79.3% positive variation in financial liabilities. The followingtable shows the breakdown of ISAGEN’s financial debt:TABLE 23.DEBT BREAKDOWNLoanDenominationOriginalamountDebtBalanceDisburst.DateInterestRate%TypeofRateTermYearsTRUST LIMITED 492,497 492,497 28-Dic-05 IPC+5,25 Variable 20(OPIC - INDEXED) *CITIBANK N.A.91,827 22,957 28-Dic-05 10,4 Fixed 5(INDEXED)BONDS DPI98,856 98,856 15-Sep-09 IPC+5,93 Variable 77 YEARSBONDS DPI149,394 149,394 15-Sep-09 IPC+6,48 Variable 1010 YEARSBONDS DPI201,75 201,75 15-Sep-09 IPC+6,99 Variable 1515 YEARSTOTAL COP(million)1.034.324 965.454(*) State-guaranteed.Additionally, it is important to highlight that 100% of ISAGEN’s debt isdenominated in Colombian Pesos, 97.6% at terms longer than 7 years,97.6% is tied to the CPI, and 2.4% is hired at fixed rate. The Company’sequity, in turn, increased 6.8%.TABLE 24.LIABILITIES AND EQUITYLiabilities and Equity <strong>2009</strong> 2008Liabilities 1.603,994 1.055,854Equity 3.345,863 3.132,491Total Liabilities and Equity 4.949,857 4.188,345Contents Letter from the CEO Achievements<strong>2009</strong>Good GovernancePractices EvaluationCorporateManagementFinancial Management