
You also want an ePaper? Increase the reach of your titles
YUMPU automatically turns print PDFs into web optimized ePapers that Google loves.
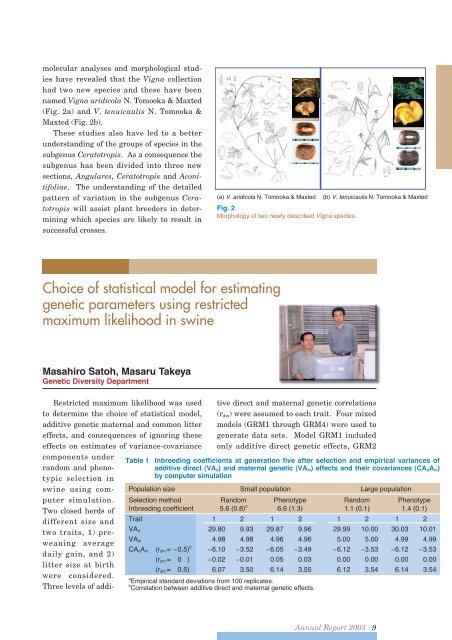
molecular analyses and morphological studieshave revealed that the Vigna collectionhad two new species and these have beennamed Vigna aridicola N. Tomooka & Maxted(Fig. 2a) and V. tenuicaulis N. Tomooka &Maxted (Fig. 2b).These studies also have led to a betterunderstanding of the groups of species in thesubgenus Ceratotropis. As a consequence thesubgenus has been divided into three newsections, Angulares, Ceratotropis and Aconitifoliae.The understanding of the detailedpattern of variation in the subgenus Ceratotropiswill assist plant breeders in determiningwhich species are likely to result insuccessful crosses.(a) V. aridicola N. Tomooka & Maxted (b) V. tenuicaulis N. Tomooka & MaxtedFig. 2Morphology of two newly described Vigna species.Choice of statistical model for estimatinggenetic parameters using restrictedmaximum likelihood in swineMasahiro Satoh, Masaru TakeyaGenetic Diversity DepartmentRestricted maximum likelihood was usedto determine the choice of statistical model,additive genetic maternal and common littereffects, and consequences of ignoring theseeffects on estimates of variance-covarianceTable 1components underrandom and phenotypicselection inswine using computersimulation.Two closed herds ofdifferent size andtwo traits, 1) preweaningaveragedaily gain, and 2)litter size at birthwere considered.Three levels of additivedirect and maternal genetic correlations(r dm ) were assumed to each trait. Four mixedmodels (GRM1 through GRM4) were used togenerate data sets. Model GRM1 includedonly additive direct genetic effects, GRM2Inbreeding coefficients at generation five after selection and empirical variances ofadditive direct (VA d ) and maternal genetic (VA m ) effects and their covariances (CA d A m )by computer simulationPopulation size Small population Large populationSelection method Random Phenotype Random PhenotypeInbreeding coefficient 5.6 (0.8) a 6.6 (1.3) 1.1 (0.1) 1.4 (0.1)Trait 1 2 1 2 1 2 1 2VA d 29.80 9.93 29.87 9.96 29.99 10.00 30.03 10.01VA m 4.98 4.98 4.96 4.96 5.00 5.00 4.99 4.99CA d A m (r dm = 0.5) b 6.10 3.52 6.05 3.49 6.12 3.53 6.12 3.53(r dm = 0 ) 0.02 0.01 0.05 0.03 0.00 0.00 0.00 0.00(r dm = 0.5) 6.07 3.50 6.14 3.55 6.12 3.54 6.14 3.54aEmpirical standard deviations from 100 replicates.bCorrelation between additive direct and maternal genetic effects.<strong>Annual</strong> <strong>Report</strong> <strong>2003</strong> 9