Response to Comments - Presidio Trust
Response to Comments - Presidio Trust
Response to Comments - Presidio Trust

You also want an ePaper? Increase the reach of your titles
YUMPU automatically turns print PDFs into web optimized ePapers that Google loves.
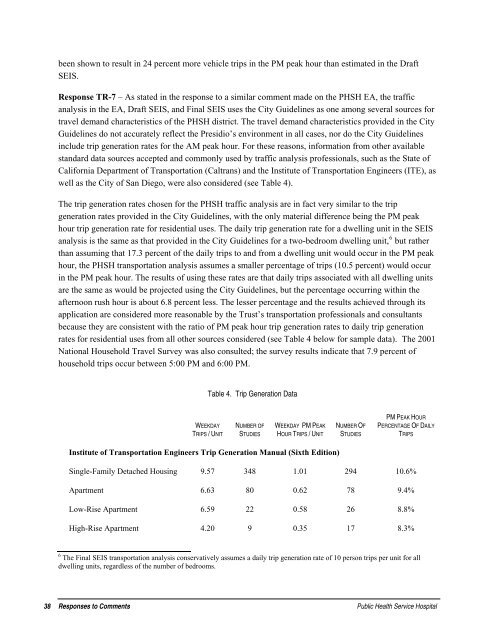
een shown <strong>to</strong> result in 24 percent more vehicle trips in the PM peak hour than estimated in the DraftSEIS.<strong>Response</strong> TR-7 – As stated in the response <strong>to</strong> a similar comment made on the PHSH EA, the trafficanalysis in the EA, Draft SEIS, and Final SEIS uses the City Guidelines as one among several sources fortravel demand characteristics of the PHSH district. The travel demand characteristics provided in the CityGuidelines do not accurately reflect the <strong>Presidio</strong>’s environment in all cases, nor do the City Guidelinesinclude trip generation rates for the AM peak hour. For these reasons, information from other availablestandard data sources accepted and commonly used by traffic analysis professionals, such as the State ofCalifornia Department of Transportation (Caltrans) and the Institute of Transportation Engineers (ITE), aswell as the City of San Diego, were also considered (see Table 4).The trip generation rates chosen for the PHSH traffic analysis are in fact very similar <strong>to</strong> the tripgeneration rates provided in the City Guidelines, with the only material difference being the PM peakhour trip generation rate for residential uses. The daily trip generation rate for a dwelling unit in the SEISanalysis is the same as that provided in the City Guidelines for a two-bedroom dwelling unit, 6 but ratherthan assuming that 17.3 percent of the daily trips <strong>to</strong> and from a dwelling unit would occur in the PM peakhour, the PHSH transportation analysis assumes a smaller percentage of trips (10.5 percent) would occurin the PM peak hour. The results of using these rates are that daily trips associated with all dwelling unitsare the same as would be projected using the City Guidelines, but the percentage occurring within theafternoon rush hour is about 6.8 percent less. The lesser percentage and the results achieved through itsapplication are considered more reasonable by the <strong>Trust</strong>’s transportation professionals and consultantsbecause they are consistent with the ratio of PM peak hour trip generation rates <strong>to</strong> daily trip generationrates for residential uses from all other sources considered (see Table 4 below for sample data). The 2001National Household Travel Survey was also consulted; the survey results indicate that 7.9 percent ofhousehold trips occur between 5:00 PM and 6:00 PM.Table 4. Trip Generation DataWEEKDAYTRIPS / UNITNUMBER OFSTUDIESWEEKDAY PM PEAKHOUR T RIPS / U NITNUMBER OFSTUDIESPM PEAK HOURPERCENTAGE OF DAILYTRIPSInstitute of Transportation Engineers Trip Generation Manual (Sixth Edition)Single-Family Detached Housing 9.57 348 1.01 294 10.6%Apartment 6.63 80 0.62 78 9.4%Low-Rise Apartment 6.59 22 0.58 26 8.8%High-Rise Apartment 4.20 9 0.35 17 8.3%6 The Final SEIS transportation analysis conservatively assumes a daily trip generation rate of 10 person trips per unit for alldwelling units, regardless of the number of bedrooms.38 <strong>Response</strong>s <strong>to</strong> <strong>Comments</strong> Public Health Service Hospital