

Foreign Direct Investment in Latin America and the Caribbean 2015
In its latest edition, the Foreign Direct Investment in Latin America and the Caribbean report analyzes in-depth the FDI received by the Caribbean, where these flows are much more significant than in the rest of the region as a proportion of Gross Domestic Product (GDP). The study also examines the impact of FDI on the environment, which has not been measured or regulated sufficiently by countries in the region.
In its latest edition, the Foreign Direct Investment in Latin America and the Caribbean report analyzes in-depth the FDI received by the Caribbean, where these flows are much more significant than in the rest of the region as a proportion of Gross Domestic Product (GDP). The study also examines the impact of FDI on the environment, which has not been measured or regulated sufficiently by countries in the region.

You also want an ePaper? Increase the reach of your titles
YUMPU automatically turns print PDFs into web optimized ePapers that Google loves.
<strong>Foreign</strong> <strong>Direct</strong> <strong>Investment</strong> <strong>in</strong> Lat<strong>in</strong> <strong>America</strong> <strong>and</strong> <strong>the</strong> <strong>Caribbean</strong> • <strong>2015</strong><br />
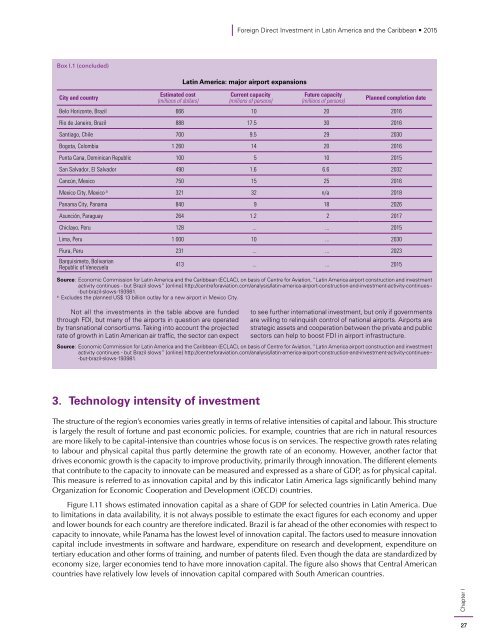
Box I.1 (concluded)<br />
City <strong>and</strong> country<br />
Estimated cost<br />
(millions of dollars)<br />
Lat<strong>in</strong> <strong>America</strong>: major airport expansions<br />
Current capacity<br />
(millions of persons)<br />
Future capacity<br />
(millions of persons)<br />
Planned completion date<br />
Belo Horizonte, Brazil 666 10 20 2016<br />
Rio de Janeiro, Brazil 888 17.5 30 2016<br />
Santiago, Chile 700 9.5 29 2030<br />
Bogota, Colombia 1 260 14 20 2016<br />
Punta Cana, Dom<strong>in</strong>ican Republic 100 5 10 <strong>2015</strong><br />
San Salvador, El Salvador 490 1.6 6.6 2032<br />
Cancún, Mexico 750 15 25 2016<br />
Mexico City, Mexico a 321 32 n/a 2018<br />
Panama City, Panama 840 9 18 2026<br />
Asunción, Paraguay 264 1.2 2 2017<br />
Chiclayo, Peru 128 ... ... <strong>2015</strong><br />
Lima, Peru 1 000 10 ... 2030<br />
Piura, Peru 231 ... ... 2023<br />
Barquisimeto, Bolivarian<br />
Republic of Venezuela<br />
413 ... ... <strong>2015</strong><br />
Source: Economic Commission for Lat<strong>in</strong> <strong>America</strong> <strong>and</strong> <strong>the</strong> <strong>Caribbean</strong> (ECLAC), on basis of Centre for Aviation, “Lat<strong>in</strong> <strong>America</strong> airport construction <strong>and</strong> <strong>in</strong>vestment<br />
activity cont<strong>in</strong>ues - but Brazil slows” [onl<strong>in</strong>e] http://centreforaviation.com/analysis/lat<strong>in</strong>-america-airport-construction-<strong>and</strong>-<strong>in</strong>vestment-activity-cont<strong>in</strong>ues--<br />
-but-brazil-slows-193981.<br />
a<br />
Excludes <strong>the</strong> planned US$ 13 billion outlay for a new airport <strong>in</strong> Mexico City.<br />
Not all <strong>the</strong> <strong>in</strong>vestments <strong>in</strong> <strong>the</strong> table above are funded<br />
through FDI, but many of <strong>the</strong> airports <strong>in</strong> question are operated<br />
by transnational consortiums. Tak<strong>in</strong>g <strong>in</strong>to account <strong>the</strong> projected<br />
rate of growth <strong>in</strong> Lat<strong>in</strong> <strong>America</strong>n air traffic, <strong>the</strong> sector can expect<br />
to see fur<strong>the</strong>r <strong>in</strong>ternational <strong>in</strong>vestment, but only if governments<br />
are will<strong>in</strong>g to rel<strong>in</strong>quish control of national airports. Airports are<br />
strategic assets <strong>and</strong> cooperation between <strong>the</strong> private <strong>and</strong> public<br />
sectors can help to boost FDI <strong>in</strong> airport <strong>in</strong>frastructure.<br />
Source: Economic Commission for Lat<strong>in</strong> <strong>America</strong> <strong>and</strong> <strong>the</strong> <strong>Caribbean</strong> (ECLAC), on basis of Centre for Aviation, “Lat<strong>in</strong> <strong>America</strong> airport construction <strong>and</strong> <strong>in</strong>vestment<br />
activity cont<strong>in</strong>ues - but Brazil slows” [onl<strong>in</strong>e] http://centreforaviation.com/analysis/lat<strong>in</strong>-america-airport-construction-<strong>and</strong>-<strong>in</strong>vestment-activity-cont<strong>in</strong>ues--<br />
-but-brazil-slows-193981.<br />
3. Technology <strong>in</strong>tensity of <strong>in</strong>vestment<br />
The structure of <strong>the</strong> region’s economies varies greatly <strong>in</strong> terms of relative <strong>in</strong>tensities of capital <strong>and</strong> labour. This structure<br />
is largely <strong>the</strong> result of fortune <strong>and</strong> past economic policies. For example, countries that are rich <strong>in</strong> natural resources<br />
are more likely to be capital-<strong>in</strong>tensive than countries whose focus is on services. The respective growth rates relat<strong>in</strong>g<br />
to labour <strong>and</strong> physical capital thus partly determ<strong>in</strong>e <strong>the</strong> growth rate of an economy. However, ano<strong>the</strong>r factor that<br />
drives economic growth is <strong>the</strong> capacity to improve productivity, primarily through <strong>in</strong>novation. The different elements<br />
that contribute to <strong>the</strong> capacity to <strong>in</strong>novate can be measured <strong>and</strong> expressed as a share of GDP, as for physical capital.<br />
This measure is referred to as <strong>in</strong>novation capital <strong>and</strong> by this <strong>in</strong>dicator Lat<strong>in</strong> <strong>America</strong> lags significantly beh<strong>in</strong>d many<br />
Organization for Economic Cooperation <strong>and</strong> Development (OECD) countries.<br />
Figure I.11 shows estimated <strong>in</strong>novation capital as a share of GDP for selected countries <strong>in</strong> Lat<strong>in</strong> <strong>America</strong>. Due<br />
to limitations <strong>in</strong> data availability, it is not always possible to estimate <strong>the</strong> exact figures for each economy <strong>and</strong> upper<br />
<strong>and</strong> lower bounds for each country are <strong>the</strong>refore <strong>in</strong>dicated. Brazil is far ahead of <strong>the</strong> o<strong>the</strong>r economies with respect to<br />
capacity to <strong>in</strong>novate, while Panama has <strong>the</strong> lowest level of <strong>in</strong>novation capital. The factors used to measure <strong>in</strong>novation<br />
capital <strong>in</strong>clude <strong>in</strong>vestments <strong>in</strong> software <strong>and</strong> hardware, expenditure on research <strong>and</strong> development, expenditure on<br />
tertiary education <strong>and</strong> o<strong>the</strong>r forms of tra<strong>in</strong><strong>in</strong>g, <strong>and</strong> number of patents filed. Even though <strong>the</strong> data are st<strong>and</strong>ardized by<br />
economy size, larger economies tend to have more <strong>in</strong>novation capital. The figure also shows that Central <strong>America</strong>n<br />
countries have relatively low levels of <strong>in</strong>novation capital compared with South <strong>America</strong>n countries.<br />
Chapter I<br />
27


