

Foreign Direct Investment in Latin America and the Caribbean 2015
In its latest edition, the Foreign Direct Investment in Latin America and the Caribbean report analyzes in-depth the FDI received by the Caribbean, where these flows are much more significant than in the rest of the region as a proportion of Gross Domestic Product (GDP). The study also examines the impact of FDI on the environment, which has not been measured or regulated sufficiently by countries in the region.
In its latest edition, the Foreign Direct Investment in Latin America and the Caribbean report analyzes in-depth the FDI received by the Caribbean, where these flows are much more significant than in the rest of the region as a proportion of Gross Domestic Product (GDP). The study also examines the impact of FDI on the environment, which has not been measured or regulated sufficiently by countries in the region.

You also want an ePaper? Increase the reach of your titles
YUMPU automatically turns print PDFs into web optimized ePapers that Google loves.
<strong>Foreign</strong> <strong>Direct</strong> <strong>Investment</strong> <strong>in</strong> Lat<strong>in</strong> <strong>America</strong> <strong>and</strong> <strong>the</strong> <strong>Caribbean</strong> • <strong>2015</strong><br />
Outward direct <strong>in</strong>vestments by companies <strong>in</strong> Lat<strong>in</strong> <strong>America</strong> <strong>and</strong> <strong>the</strong> <strong>Caribbean</strong> are still largely concentrated with<strong>in</strong><br />
<strong>the</strong> region, but as companies grow <strong>and</strong> develop a significant number of <strong>the</strong>m are start<strong>in</strong>g to <strong>in</strong>vest <strong>in</strong> o<strong>the</strong>r regions. Most<br />
of <strong>the</strong> largest trans-Lat<strong>in</strong> companies from Mexico <strong>in</strong>vest <strong>in</strong> <strong>the</strong> United States, as do some of <strong>the</strong> largest corporations<br />
from Brazil <strong>and</strong> Colombia. In recent years many companies have also been <strong>in</strong>creas<strong>in</strong>g <strong>the</strong>ir <strong>in</strong>vestments <strong>in</strong> Europe.<br />
Accord<strong>in</strong>g to data from <strong>the</strong> European countries, FDI from Lat<strong>in</strong> <strong>America</strong>n countries has <strong>in</strong>creased notably s<strong>in</strong>ce 2009<br />
(see figure I.16), reflect<strong>in</strong>g <strong>the</strong> more readily available f<strong>in</strong>ancial resources of Lat<strong>in</strong> <strong>America</strong>n companies relative to<br />
<strong>the</strong>ir European counterparts. The first reflection of this shift was <strong>the</strong> divestment by European companies of valuable<br />
assets <strong>in</strong> Lat<strong>in</strong> <strong>America</strong> <strong>in</strong> order to improve cash flows, but as <strong>the</strong> situation develops Lat<strong>in</strong> <strong>America</strong>n companies are<br />
also enter<strong>in</strong>g <strong>the</strong> European market. <strong>Investment</strong> by trans-Lat<strong>in</strong> corporations <strong>in</strong> o<strong>the</strong>r develop<strong>in</strong>g regions rema<strong>in</strong>s rare.<br />
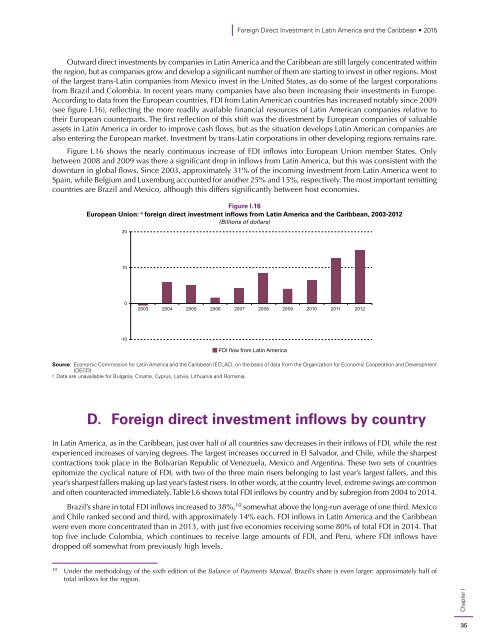
Figure I.16 shows <strong>the</strong> nearly cont<strong>in</strong>uous <strong>in</strong>crease of FDI <strong>in</strong>flows <strong>in</strong>to European Union member States. Only<br />
between 2008 <strong>and</strong> 2009 was <strong>the</strong>re a significant drop <strong>in</strong> <strong>in</strong>flows from Lat<strong>in</strong> <strong>America</strong>, but this was consistent with <strong>the</strong><br />
downturn <strong>in</strong> global flows. S<strong>in</strong>ce 2003, approximately 31% of <strong>the</strong> <strong>in</strong>com<strong>in</strong>g <strong>in</strong>vestment from Lat<strong>in</strong> <strong>America</strong> went to<br />
Spa<strong>in</strong>, while Belgium <strong>and</strong> Luxemburg accounted for ano<strong>the</strong>r 25% <strong>and</strong> 15%, respectively. The most important remitt<strong>in</strong>g<br />
countries are Brazil <strong>and</strong> Mexico, although this differs significantly between host economies.<br />
Figure I.16<br />
European Union: a foreign direct <strong>in</strong>vestment <strong>in</strong>flows from Lat<strong>in</strong> <strong>America</strong> <strong>and</strong> <strong>the</strong> <strong>Caribbean</strong>, 2003-2012<br />
(Billions of dollars)<br />
20<br />
10<br />
0<br />
2003 2004 2005 2006 2007 2008 2009 2010 2011 2012<br />
-10<br />
FDI flow from Lat<strong>in</strong> <strong>America</strong><br />
Source: Economic Commission for Lat<strong>in</strong> <strong>America</strong> <strong>and</strong> <strong>the</strong> <strong>Caribbean</strong> (ECLAC), on <strong>the</strong> basis of data from <strong>the</strong> Organization for Economic Cooperation <strong>and</strong> Development<br />
(OECD).<br />
a<br />
Data are unavailable for Bulgaria, Croatia, Cyprus, Latvia, Lithuania <strong>and</strong> Romania.<br />
D. <strong>Foreign</strong> direct <strong>in</strong>vestment <strong>in</strong>flows by country<br />
In Lat<strong>in</strong> <strong>America</strong>, as <strong>in</strong> <strong>the</strong> <strong>Caribbean</strong>, just over half of all countries saw decreases <strong>in</strong> <strong>the</strong>ir <strong>in</strong>flows of FDI, while <strong>the</strong> rest<br />
experienced <strong>in</strong>creases of vary<strong>in</strong>g degrees. The largest <strong>in</strong>creases occurred <strong>in</strong> El Salvador, <strong>and</strong> Chile, while <strong>the</strong> sharpest<br />
contractions took place <strong>in</strong> <strong>the</strong> Bolivarian Republic of Venezuela, Mexico <strong>and</strong> Argent<strong>in</strong>a. These two sets of countries<br />
epitomize <strong>the</strong> cyclical nature of FDI, with two of <strong>the</strong> three ma<strong>in</strong> risers belong<strong>in</strong>g to last year’s largest fallers, <strong>and</strong> this<br />
year’s sharpest fallers mak<strong>in</strong>g up last year’s fastest risers. In o<strong>the</strong>r words, at <strong>the</strong> country level, extreme sw<strong>in</strong>gs are common<br />
<strong>and</strong> often counteracted immediately. Table I.6 shows total FDI <strong>in</strong>flows by country <strong>and</strong> by subregion from 2004 to 2014.<br />
Brazil’s share <strong>in</strong> total FDI <strong>in</strong>flows <strong>in</strong>creased to 38%, 10 somewhat above <strong>the</strong> long-run average of one third. Mexico<br />
<strong>and</strong> Chile ranked second <strong>and</strong> third, with approximately 14% each. FDI <strong>in</strong>flows <strong>in</strong> Lat<strong>in</strong> <strong>America</strong> <strong>and</strong> <strong>the</strong> <strong>Caribbean</strong><br />
were even more concentrated than <strong>in</strong> 2013, with just five economies receiv<strong>in</strong>g some 80% of total FDI <strong>in</strong> 2014. That<br />
top five <strong>in</strong>clude Colombia, which cont<strong>in</strong>ues to receive large amounts of FDI, <strong>and</strong> Peru, where FDI <strong>in</strong>flows have<br />
dropped off somewhat from previously high levels.<br />
10<br />
Under <strong>the</strong> methodology of <strong>the</strong> sixth edition of <strong>the</strong> Balance of Payments Manual, Brazil’s share is even larger: approximately half of<br />
total <strong>in</strong>flows for <strong>the</strong> region.<br />
Chapter I<br />
35


