

Foreign Direct Investment in Latin America and the Caribbean 2015
In its latest edition, the Foreign Direct Investment in Latin America and the Caribbean report analyzes in-depth the FDI received by the Caribbean, where these flows are much more significant than in the rest of the region as a proportion of Gross Domestic Product (GDP). The study also examines the impact of FDI on the environment, which has not been measured or regulated sufficiently by countries in the region.
In its latest edition, the Foreign Direct Investment in Latin America and the Caribbean report analyzes in-depth the FDI received by the Caribbean, where these flows are much more significant than in the rest of the region as a proportion of Gross Domestic Product (GDP). The study also examines the impact of FDI on the environment, which has not been measured or regulated sufficiently by countries in the region.

Create successful ePaper yourself
Turn your PDF publications into a flip-book with our unique Google optimized e-Paper software.
<strong>Foreign</strong> <strong>Direct</strong> <strong>Investment</strong> <strong>in</strong> Lat<strong>in</strong> <strong>America</strong> <strong>and</strong> <strong>the</strong> <strong>Caribbean</strong> • <strong>2015</strong><br />
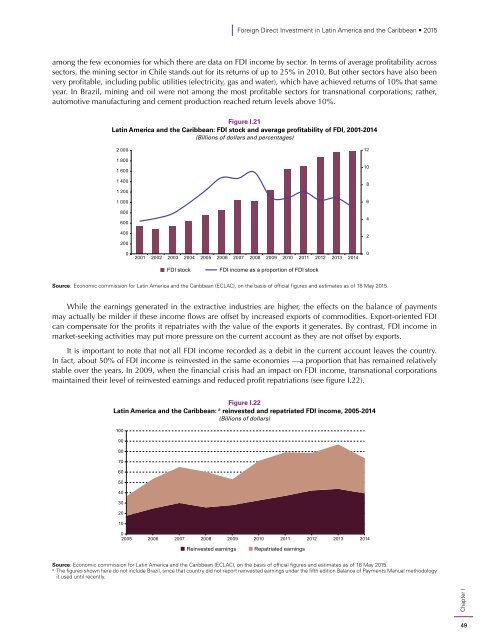
among <strong>the</strong> few economies for which <strong>the</strong>re are data on FDI <strong>in</strong>come by sector. In terms of average profitability across<br />
sectors, <strong>the</strong> m<strong>in</strong><strong>in</strong>g sector <strong>in</strong> Chile st<strong>and</strong>s out for its returns of up to 25% <strong>in</strong> 2010. But o<strong>the</strong>r sectors have also been<br />
very profitable, <strong>in</strong>clud<strong>in</strong>g public utilities (electricity, gas <strong>and</strong> water), which have achieved returns of 10% that same<br />
year. In Brazil, m<strong>in</strong><strong>in</strong>g <strong>and</strong> oil were not among <strong>the</strong> most profitable sectors for transnational corporations; ra<strong>the</strong>r,<br />
automotive manufactur<strong>in</strong>g <strong>and</strong> cement production reached return levels above 10%.<br />
Figure I.21<br />
Lat<strong>in</strong> <strong>America</strong> <strong>and</strong> <strong>the</strong> <strong>Caribbean</strong>: FDI stock <strong>and</strong> average profitability of FDI, 2001-2014<br />
(Billions of dollars <strong>and</strong> percentages)<br />
2 000<br />
1 800<br />
1 600<br />
1 400<br />
1 200<br />
1 000<br />
800<br />
600<br />
400<br />
200<br />
0<br />
2001 2002 2003 2004 2005 2006 2007 2008 2009 2010 2011 2012 2013 2014<br />
12<br />
10<br />
8<br />
6<br />
4<br />
2<br />
0<br />
FDI stock<br />
FDI <strong>in</strong>come as a proportion of FDI stock<br />
Source: Economic commission for Lat<strong>in</strong> <strong>America</strong> <strong>and</strong> <strong>the</strong> <strong>Caribbean</strong> (ECLAC), on <strong>the</strong> basis of official figures <strong>and</strong> estimates as of 18 May <strong>2015</strong>.<br />
While <strong>the</strong> earn<strong>in</strong>gs generated <strong>in</strong> <strong>the</strong> extractive <strong>in</strong>dustries are higher, <strong>the</strong> effects on <strong>the</strong> balance of payments<br />
may actually be milder if <strong>the</strong>se <strong>in</strong>come flows are offset by <strong>in</strong>creased exports of commodities. Export-oriented FDI<br />
can compensate for <strong>the</strong> profits it repatriates with <strong>the</strong> value of <strong>the</strong> exports it generates. By contrast, FDI <strong>in</strong>come <strong>in</strong><br />
market-seek<strong>in</strong>g activities may put more pressure on <strong>the</strong> current account as <strong>the</strong>y are not offset by exports.<br />
It is important to note that not all FDI <strong>in</strong>come recorded as a debit <strong>in</strong> <strong>the</strong> current account leaves <strong>the</strong> country.<br />
In fact, about 50% of FDI <strong>in</strong>come is re<strong>in</strong>vested <strong>in</strong> <strong>the</strong> same economies —a proportion that has rema<strong>in</strong>ed relatively<br />
stable over <strong>the</strong> years. In 2009, when <strong>the</strong> f<strong>in</strong>ancial crisis had an impact on FDI <strong>in</strong>come, transnational corporations<br />
ma<strong>in</strong>ta<strong>in</strong>ed <strong>the</strong>ir level of re<strong>in</strong>vested earn<strong>in</strong>gs <strong>and</strong> reduced profit repatriations (see figure I.22).<br />
Figure I.22<br />
Lat<strong>in</strong> <strong>America</strong> <strong>and</strong> <strong>the</strong> <strong>Caribbean</strong>: a re<strong>in</strong>vested <strong>and</strong> repatriated FDI <strong>in</strong>come, 2005-2014<br />
(Billions of dollars)<br />
100<br />
90<br />
80<br />
70<br />
60<br />
50<br />
40<br />
30<br />
20<br />
10<br />
0<br />
2005 2006 2007 2008 2009 2010 2011 2012 2013 2014<br />
Re<strong>in</strong>vested earn<strong>in</strong>gs<br />
Repatriated earn<strong>in</strong>gs<br />
Source: Economic commission for Lat<strong>in</strong> <strong>America</strong> <strong>and</strong> <strong>the</strong> <strong>Caribbean</strong> (ECLAC), on <strong>the</strong> basis of official figures <strong>and</strong> estimates as of 18 May <strong>2015</strong>.<br />
a<br />
The figures shown here do not <strong>in</strong>clude Brazil, s<strong>in</strong>ce that country did not report re<strong>in</strong>vested earn<strong>in</strong>gs under <strong>the</strong> fifth edition Balance of Payments Manual methodology<br />
it used until recently.<br />
Chapter I<br />
49


