

Foreign Direct Investment in Latin America and the Caribbean 2015
In its latest edition, the Foreign Direct Investment in Latin America and the Caribbean report analyzes in-depth the FDI received by the Caribbean, where these flows are much more significant than in the rest of the region as a proportion of Gross Domestic Product (GDP). The study also examines the impact of FDI on the environment, which has not been measured or regulated sufficiently by countries in the region.
In its latest edition, the Foreign Direct Investment in Latin America and the Caribbean report analyzes in-depth the FDI received by the Caribbean, where these flows are much more significant than in the rest of the region as a proportion of Gross Domestic Product (GDP). The study also examines the impact of FDI on the environment, which has not been measured or regulated sufficiently by countries in the region.

Create successful ePaper yourself
Turn your PDF publications into a flip-book with our unique Google optimized e-Paper software.
<strong>Foreign</strong> <strong>Direct</strong> <strong>Investment</strong> <strong>in</strong> Lat<strong>in</strong> <strong>America</strong> <strong>and</strong> <strong>the</strong> <strong>Caribbean</strong> • <strong>2015</strong><br />
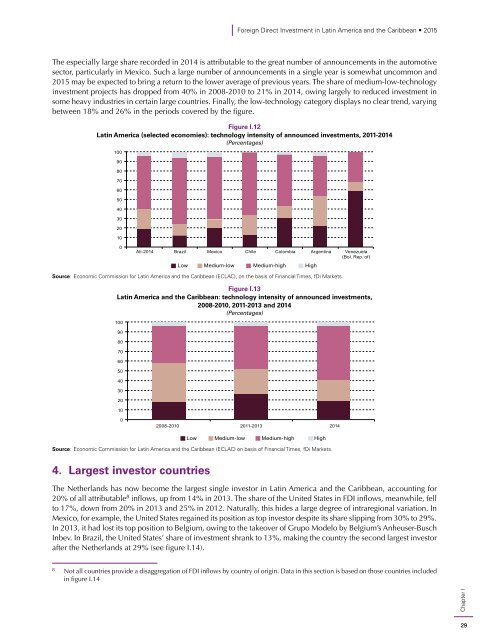
The especially large share recorded <strong>in</strong> 2014 is attributable to <strong>the</strong> great number of announcements <strong>in</strong> <strong>the</strong> automotive<br />
sector, particularly <strong>in</strong> Mexico. Such a large number of announcements <strong>in</strong> a s<strong>in</strong>gle year is somewhat uncommon <strong>and</strong><br />
<strong>2015</strong> may be expected to br<strong>in</strong>g a return to <strong>the</strong> lower average of previous years. The share of medium-low-technology<br />
<strong>in</strong>vestment projects has dropped from 40% <strong>in</strong> 2008-2010 to 21% <strong>in</strong> 2014, ow<strong>in</strong>g largely to reduced <strong>in</strong>vestment <strong>in</strong><br />
some heavy <strong>in</strong>dustries <strong>in</strong> certa<strong>in</strong> large countries. F<strong>in</strong>ally, <strong>the</strong> low-technology category displays no clear trend, vary<strong>in</strong>g<br />
between 18% <strong>and</strong> 26% <strong>in</strong> <strong>the</strong> periods covered by <strong>the</strong> figure.<br />
Figure I.12<br />
Lat<strong>in</strong> <strong>America</strong> (selected economies): technology <strong>in</strong>tensity of announced <strong>in</strong>vestments, 2011-2014<br />
(Percentages)<br />
100<br />
90<br />
80<br />
70<br />
60<br />
50<br />
40<br />
30<br />
20<br />
10<br />
0<br />
All-2014 Brazil Mexico Chile Colombia Argent<strong>in</strong>a Venezuela<br />
(Bol. Rep. of)<br />
Low Medium-low Medium-high High<br />
Source: Economic Commission for Lat<strong>in</strong> <strong>America</strong> <strong>and</strong> <strong>the</strong> <strong>Caribbean</strong> (ECLAC), on <strong>the</strong> basis of F<strong>in</strong>ancial Times, fDi Markets.<br />
Figure I.13<br />
Lat<strong>in</strong> <strong>America</strong> <strong>and</strong> <strong>the</strong> <strong>Caribbean</strong>: technology <strong>in</strong>tensity of announced <strong>in</strong>vestments,<br />
2008-2010, 2011-2013 <strong>and</strong> 2014<br />
(Percentages)<br />
100<br />
90<br />
80<br />
70<br />
60<br />
50<br />
40<br />
30<br />
20<br />
10<br />
0<br />
2008-2010 2011-2013 2014<br />
Low Medium-low Medium-high High<br />
Source: Economic Commission for Lat<strong>in</strong> <strong>America</strong> <strong>and</strong> <strong>the</strong> <strong>Caribbean</strong> (ECLAC) on basis of F<strong>in</strong>ancial Times, fDi Markets.<br />
4. Largest <strong>in</strong>vestor countries<br />
The Ne<strong>the</strong>rl<strong>and</strong>s has now become <strong>the</strong> largest s<strong>in</strong>gle <strong>in</strong>vestor <strong>in</strong> Lat<strong>in</strong> <strong>America</strong> <strong>and</strong> <strong>the</strong> <strong>Caribbean</strong>, account<strong>in</strong>g for<br />
20% of all attributable 8 <strong>in</strong>flows, up from 14% <strong>in</strong> 2013. The share of <strong>the</strong> United States <strong>in</strong> FDI <strong>in</strong>flows, meanwhile, fell<br />
to 17%, down from 20% <strong>in</strong> 2013 <strong>and</strong> 25% <strong>in</strong> 2012. Naturally, this hides a large degree of <strong>in</strong>traregional variation. In<br />
Mexico, for example, <strong>the</strong> United States rega<strong>in</strong>ed its position as top <strong>in</strong>vestor despite its share slipp<strong>in</strong>g from 30% to 29%.<br />
In 2013, it had lost its top position to Belgium, ow<strong>in</strong>g to <strong>the</strong> takeover of Grupo Modelo by Belgium’s Anheuser-Busch<br />
Inbev. In Brazil, <strong>the</strong> United States’ share of <strong>in</strong>vestment shrank to 13%, mak<strong>in</strong>g <strong>the</strong> country <strong>the</strong> second largest <strong>in</strong>vestor<br />
after <strong>the</strong> Ne<strong>the</strong>rl<strong>and</strong>s at 29% (see figure I.14).<br />
8<br />
Not all countries provide a disaggregation of FDI <strong>in</strong>flows by country of orig<strong>in</strong>. Data <strong>in</strong> this section is based on those countries <strong>in</strong>cluded<br />
<strong>in</strong> figure I.14<br />
Chapter I<br />
29


