View full report - NEEC
View full report - NEEC
View full report - NEEC
- No tags were found...

Create successful ePaper yourself
Turn your PDF publications into a flip-book with our unique Google optimized e-Paper software.
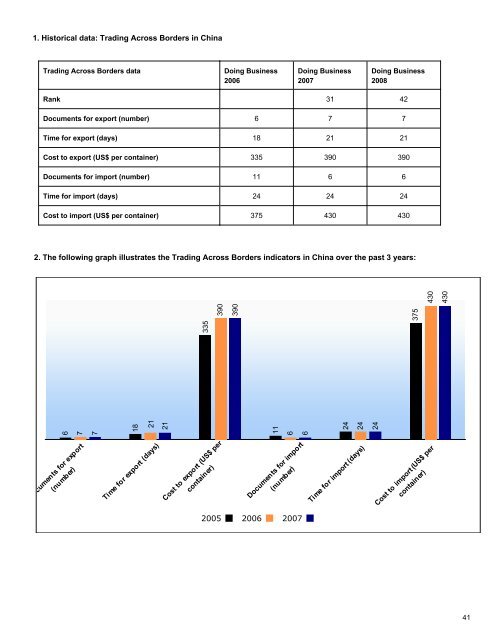
1. Historical data: Trading Across Borders in ChinaTrading Across Borders dataDoing Business2006Doing Business2007Doing Business2008Rank 31 42Documents for export (number) 6 7 7Time for export (days) 18 21 21Cost to export (US$ per container) 335 390 390Documents for import (number) 11 6 6Time for import (days) 24 24 24Cost to import (US$ per container) 375 430 4302. The following graph illustrates the Trading Across Borders indicators in China over the past 3 years:6771821211166242424335390390375430430Documents for export(number)Time for export (days)Cost to export (US$ percontainer)Documents for import(number)2005 2006 2007Time for import (days)Cost to import (US$ percontainer)41