Annual Report 2011 - Jordan Investment and Finance bank
Annual Report 2011 - Jordan Investment and Finance bank
Annual Report 2011 - Jordan Investment and Finance bank

You also want an ePaper? Increase the reach of your titles
YUMPU automatically turns print PDFs into web optimized ePapers that Google loves.
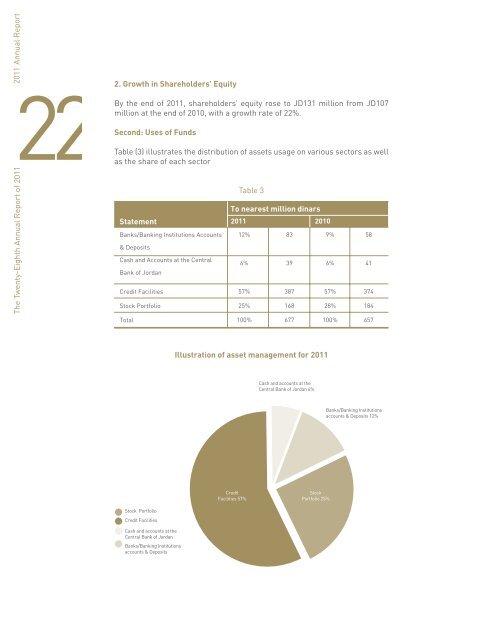
222.The Twenty-Eighth <strong>Annual</strong> <strong>Report</strong> of <strong>2011</strong>Growth in Shareholders’ EquityBy the end of <strong>2011</strong>, shareholders’ equity rose to JD131 million from JD107million at the end of 2010, with a growth rate of 22%.Second: Uses of FundsTable (3) illustrates the distribution of assets usage on various sectors as wellas the share of each sectorStatementBanks/Banking Institutions Accounts& DepositsCash <strong>and</strong> Accounts at the CentralBank of <strong>Jordan</strong>Credit FacilitiesStock PortfolioTable 3To nearest million dinars<strong>2011</strong> 201012%6%57%25%83393871689%6%57%28%5841374184The following are details of some of the items pointed out above as follows:- <strong>Investment</strong> in financial assets portfolioTable (4): Size of <strong>bank</strong>’s investments at the end of <strong>2011</strong> as compared to 2010To nearest million dinarStatementFinancial Instruments/ StockFinancial Instruments/ BondsTotal1802010<strong>2011</strong>160140120<strong>2011</strong> 2010202214816216818423The Twenty-Eighth <strong>Annual</strong> <strong>Report</strong> of <strong>2011</strong>Total100%677100%6571002010<strong>2011</strong>80Illustration of asset management for <strong>2011</strong>6040Cash <strong>and</strong> accounts at theCentral Bank of <strong>Jordan</strong> 6%20<strong>2011</strong>20100Banks/Banking Institutionsaccounts & Deposits 12%Financial Instruments/ StockFinancial Instruments/ BondsCreditFacilities 57%StockPortfolio 25%Stock PortfolioCredit FacilitiesCash <strong>and</strong> accounts at theCentral Bank of <strong>Jordan</strong>Banks/Banking Institutionsaccounts & Deposits