You also want an ePaper? Increase the reach of your titles
YUMPU automatically turns print PDFs into web optimized ePapers that Google loves.
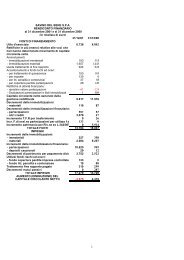
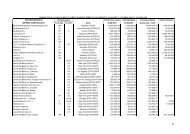
(-) Labour costs<br />
(-) Sundry costs<br />
Gross operating margin<br />
(-) Amortisation, depreciation and write-down<br />
of fixed assets<br />
(-) Write-down of current assets<br />
(-) Provisions for risks<br />
Net operating income<br />
-14,174 -7.7% -28,319 -7.3% -16,057 -8.9% -1,883 13.28%<br />
-427 -0.2% -1,098 -0.3% -618 -0.3% -191 44.73%<br />
13,759 7.5% 29,689 7.7% 9,062 5.0% -4,697 -34.14%<br />
-1,147 -0.6% -3,410 -0.9% -1,762 -1.0% -615 53.62%<br />
-452 -0.2% -1,193 -0.3% -310 -0.2% 142 -31.42%<br />
-327 -0.2% -459 -0.12% -377 -0.2% -50 15.29%<br />
11,833 6.5% 24,627 6.4% 6,613 3.7% -5,220 -44.11%<br />
+ (-) Financial income (expenses) 1,212 0.7% 811 0.2% 2,021 1.1% 809 66.75%<br />
+ Dividends and tax credits 1,639 0.9% 3,608 0.9% 1,539 0.9% -100 -6.10%<br />
(+/-) Adjustments to value of financial assets -7 0.0% -358 -0.09% 0 0.0% 7 -100%<br />
Income before taxes and extraordinary<br />
items 14,677 8.0% 28,688 7.4% 10,173 5.7% -4,504 -30.69%<br />
+ (-) Extraordinary income (expenses) -79 0.0% 1,824 0.5% 10 0.0% 89 -112.%<br />
Income before taxes 14,598 8.0% 30,512 7.9% 10,183 5.7% -4,415 -30.24%<br />
Income tax for the period 0 0.0% -13,468 -3.5% 0 0.0% 0 =<br />
Net income for the period 14,598 8.0% 17,044 4.4% 10,183 5.7% -4,415 -30.24%<br />
During the period the Company recorded sales revenues of Lire 177,826 million, with a decrease<br />
of only 2.28% with respect to the figure for six months ended 30th June 2000, despite the fact that the<br />
company's business, and particularly that regarding the American market, has undergone a significant<br />
reduction in volume. The Company has continued its policy of expanding its direct presence on new<br />
markets and during the first six months of the year 2001 it opened a new office in Padova and another<br />
three offices at Buenos Aires, at Campinas (Brazil) and at Philadelphia (USA). With respect to the first<br />
half of the previous year, the volumes of goods shipped have decreased in the sea shipment sector (-<br />
14.86%) and increased in the air sector (+3.81%), the same applies to revenues, which show a<br />
decrease in the sea shipment sector (-7.78%) and an increase in the air sector (+11.92%). The gross<br />
operating margin has fallen from Lire 13,759 million during the first six months of the year 2000 to Lire<br />
9,062 million during the first six months of the year 2001, representing a decrease of approx. 34% and<br />
the gross operating margin /total sales revenue ratio has fallen from 7.5% to 5%. The decrease in<br />
profitability is due both to the higher incidence of labour costs on revenues, which rose from 7.79% at<br />
30.6.00 to 9.03% at 30.6.01, and to the decrease in turnover per employee, which amounted to Lire<br />
490 million against Lire 551 million as at 30.6.00. Once again the contribution made to the result for the<br />
period from the company's financial management (Lire 3,560 million) was considerable, due to<br />
significant exchange gains and income from equity investments.<br />
As regards the company's performance, the table below shows the following a decrease:<br />
30.06.00 31.12.00 30.06.01<br />
Difference<br />
30.6.2001<br />
-30.6.2000<br />
% Difference<br />
30.6.2001-<br />
30.6.2000<br />
Sales revenue 181,966 384,759 177,826 -4,140 -2.28%<br />
Gross operating margin 13,759 29,689 9,062 -4,697 -34.14%<br />
Net operating income 11,833 24,627 6,613 -5,220 -44.11%<br />
Net income before taxation 14,598 30,512 10,183 -4,415 -30.24%<br />
In particular, the decrease in income has led to a reduction in the principal financial and economic<br />
ratios:<br />
30.06.00 30.06.01<br />
Gross operating margin /Total sales revenue 7.6 5.1<br />
Net operating income / Total sales revenue (ROS) 6.5 3.7<br />
Return on equity (ROE) 21.0 11.8<br />
Return on investments (ROI) 18.2 10.2<br />
Debt ratio (net liquidity/capital invested) 20.1 3.4<br />
The following table shows an analysis of sales revenue by sector, showing the variations that have<br />
taken place with respect to the figures for the year ended 31st December 2000 and the six months<br />
ended 30th June 2000:<br />
3