Create successful ePaper yourself
Turn your PDF publications into a flip-book with our unique Google optimized e-Paper software.
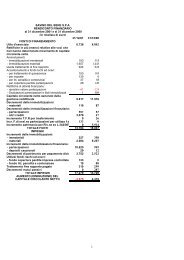
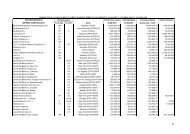
30.06.01 %<br />
North America 20,220 35.45%<br />
Central America 147 0.26%<br />
South America 1,593 2.79%<br />
Europe 27,639 48.45%<br />
Africa 104 0.18%<br />
Middle East 129 0.23%<br />
Far East 7,150 12.53%<br />
Australia and South Pacific 62 0.11%<br />
Total 57,044 100%<br />
The air sector registered an increase of 3.8% in the volume of goods transported. This result is<br />
extremely positive, given that the market as a whole registered a decrease of more than 10% during<br />
the first quarter of the current year. The following table shows the variations in the volumes shipped by<br />
air with respect to 30.6.00 and to 31.12.00 (figures expressed in thousand of Kg.) :<br />
30.06.00 % 31.12.00 % 30.06.01 %<br />
Diff.<br />
6.01- 6.00<br />
% Diff.<br />
6.01-6.00<br />
North America 6,438 69.80% 13,534 68.70% 6,447 67.33% 9 0.14%<br />
Central America 52 0.56% 176 0.89% 57 0.60% 5 9.62%<br />
South America 239 2.59% 536 2.72% 361 3.77% 122 51.05%<br />
Europe 64 0.69% 157 0.80% 72 0.75% 8 12.50%<br />
Africa 88 0.95% 181 0.92% 90 0.94% 2 2.27%<br />
Middle East 98 1.06% 213 1.08% 273 2.85% 175 178.57%<br />
Far East 2,212 23.98% 4,853 24.63% 2,018 21.08% -194 -8.77%<br />
Australia and<br />
South Pacific 33 0.36% 50 0.25% 257 2.68% 224 678.79%<br />
Total 9,224 100% 19,700 100% 9,575 100% 351 3.81%<br />
The analysis of the quantities shipped by air by point of despatch, and detailed in the table below,<br />
shows a consolidation of the quantities shipped in the previous year: the principal variations, both<br />
positive and negative, are linked to the quantities shipped by our customers, given that no significant<br />
variations took place in our customer base during the period. The table below shows the quantities<br />
shipped by air by point of despatch (figures expressed in thousands of Kg.):<br />
30.06.00 % 31.12.00 % 30.06.01 %<br />
Diff.<br />
6.01-6.00<br />
% Diff.<br />
6.01-6.00<br />
Florence 2,950 31.98% 6,054 30.73% 2,825 29.50% -125 -4.24%<br />
Bologna 0 0.00% 113 0.57% 90 0.94% 90 =<br />
Segrate (Milan) 2,406 26.08% 5,407 27.45% 2,344 24.48% -62 -2.58%<br />
Montecosaro (Mc) 555 6.02% 1,283 6.51% 807 8.43% 252 45.41%<br />
Naples 32 0.35% 62 0.31% 58 0.61% 26 81.25%<br />
Pisa 355 3.85% 732 3.72% 528 5.51% 173 48.73%<br />
Prato 213 2.31% 529 2.69% 305 3.19% 92 43.19%<br />
Santacroce sull'Arno (Pisa) 770 8.35% 1,604 8.14% 694 7.25% -76 -9.87%<br />
Treviso 318 3.45% 759 3.85% 280 2.92% -38 -11.95%<br />
Verona 118 1.28% 256 1.30% 170 1.78% 52 44.07%<br />
Padova 0 0.00% 0 0.00% 91 0.95% 91 =<br />
Vicenza 1,507 16.34% 2,901 14.73% 1,383 14.44% -124 -8.23%<br />
Total 9,224 100% 19,700 100% 9,575 100% 351 3.81%<br />
The Montecosaro office benefited from the favourable trend in footwear exports. Again, we would<br />
point out that the Padova office has absorbed part of the traffic which was previously handled by the<br />
Vicenza office.<br />
Shipments by land<br />
7