Create successful ePaper yourself
Turn your PDF publications into a flip-book with our unique Google optimized e-Paper software.
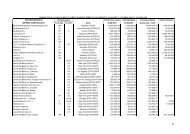
geographic area of the customer invoiced for the service. However the percentage analysis of the<br />
revenues by destination area is more or less the same as that shown in the table detailing the<br />
geographical analysis by destination of volumes shipped by sea.<br />
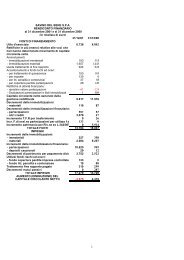
30.06.01 %<br />
North America 59,702 57.85%<br />
Central America 488 0.47%<br />
South America 2,426 2.35%<br />
Europe 36,037 34.92%<br />
Africa 158 0.15%<br />
Middle East 2,224 2.16%<br />
Far East 2,097 2.03%<br />
Australia and South Pacific 63 0.06%<br />
Total 103,195 100%<br />
During the first six months of the year 2001, the drop in the volume of goods shipped by sea (-<br />
14.86%) was only partly matched by the drop in revenues from goods shipped by sea (-7.78%). This is<br />
due principally to an increase in the rates charged to customers.<br />
The reduction in volumes shipped towards the Company's main North American market was<br />
partially compensated for by the increase registered in shipments towards the Far East (+28.6%) which<br />
represents a market with a high potential for future growth.<br />
The following table shows the variation in the volume of goods shipped by sea towards the<br />
following destinations with respect to 30.6.00 and to 31.12.00 (figures expressed in No. of Teus<br />
shipped):<br />
5