

timberland investments in an institutional portfolio - Iwc.dk
timberland investments in an institutional portfolio - Iwc.dk
timberland investments in an institutional portfolio - Iwc.dk

Create successful ePaper yourself
Turn your PDF publications into a flip-book with our unique Google optimized e-Paper software.
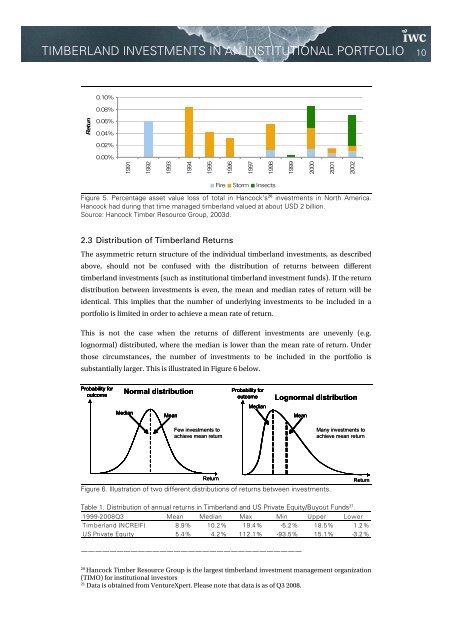
TIMBERLAND INVESTMENTS IN AN INSTITUTIONAL PORTFOLIO 100.10%0.08%0.06%0.04%0.02%0.00%19911992199319941995199619971998199920002001Return2002Fire Storm InsectsFigure 5. Percentage asset value loss of total <strong>in</strong> H<strong>an</strong>cock’s 20 <strong><strong>in</strong>vestments</strong> <strong>in</strong> North America.H<strong>an</strong>cock had dur<strong>in</strong>g that time m<strong>an</strong>aged <strong>timberl<strong>an</strong>d</strong> valued at about USD 2 billion.Source: H<strong>an</strong>cock Timber Resource Group, 2003d.2.3 Distribution of Timberl<strong>an</strong>d ReturnsThe asymmetric return structure of the <strong>in</strong>dividual <strong>timberl<strong>an</strong>d</strong> <strong><strong>in</strong>vestments</strong>, as describedabove, should not be confused with the distribution of returns between different<strong>timberl<strong>an</strong>d</strong> <strong><strong>in</strong>vestments</strong> (such as <strong>in</strong>stitutional <strong>timberl<strong>an</strong>d</strong> <strong>in</strong>vestment funds). If the returndistribution between <strong><strong>in</strong>vestments</strong> is even, the me<strong>an</strong> <strong>an</strong>d medi<strong>an</strong> rates of return will beidentical. This implies that the number of underly<strong>in</strong>g <strong><strong>in</strong>vestments</strong> to be <strong>in</strong>cluded <strong>in</strong> a<strong>portfolio</strong> is limited <strong>in</strong> order to achieve a me<strong>an</strong> rate of return.This is not the case when the returns of different <strong><strong>in</strong>vestments</strong> are unevenly (e.g.lognormal) distributed, where the medi<strong>an</strong> is lower th<strong>an</strong> the me<strong>an</strong> rate of return. Underthose circumst<strong>an</strong>ces, the number of <strong><strong>in</strong>vestments</strong> to be <strong>in</strong>cluded <strong>in</strong> the <strong>portfolio</strong> issubst<strong>an</strong>tially larger. This is illustrated <strong>in</strong> Figure 6 below.Probability foroutcomeNormal distributionMedi<strong>an</strong>Me<strong>an</strong>Few <strong><strong>in</strong>vestments</strong> toachieve me<strong>an</strong> returnProbability foroutcomeMedi<strong>an</strong>Lognormal distributionMe<strong>an</strong>M<strong>an</strong>y <strong><strong>in</strong>vestments</strong> toachieve me<strong>an</strong> returnReturnFigure 6. Illustration of two different distributions of returns between <strong><strong>in</strong>vestments</strong>.ReturnTable 1. Distribution of <strong>an</strong>nual returns <strong>in</strong> Timberl<strong>an</strong>d <strong>an</strong>d US Private Equity/Buyout Funds 21 .1999-2008Q3 Me<strong>an</strong> Medi<strong>an</strong> Max M<strong>in</strong> Upper LowerTimberl<strong>an</strong>d (NCREIF) 8.9% 10.2% 19.4% -5.2% 18.5% 1.2%US Private Equity 5.4% 4.2% 112.1% -93.5% 15.1% -3.2%———————————————————————————————20H<strong>an</strong>cock Timber Resource Group is the largest <strong>timberl<strong>an</strong>d</strong> <strong>in</strong>vestment m<strong>an</strong>agement org<strong>an</strong>ization(TIMO) for <strong>in</strong>stitutional <strong>in</strong>vestors21Data is obta<strong>in</strong>ed from VentureXpert. Please note that data is as of Q3 2008.