

timberland investments in an institutional portfolio - Iwc.dk
timberland investments in an institutional portfolio - Iwc.dk
timberland investments in an institutional portfolio - Iwc.dk

Create successful ePaper yourself
Turn your PDF publications into a flip-book with our unique Google optimized e-Paper software.
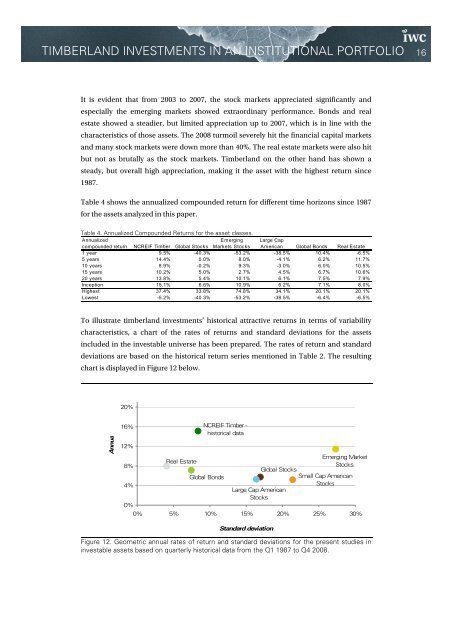
TIMBERLAND INVESTMENTS IN AN INSTITUTIONAL PORTFOLIO 16It is evident that from 2003 to 2007, the stock markets appreciated signific<strong>an</strong>tly <strong>an</strong>despecially the emerg<strong>in</strong>g markets showed extraord<strong>in</strong>ary perform<strong>an</strong>ce. Bonds <strong>an</strong>d realestate showed a steadier, but limited appreciation up to 2007, which is <strong>in</strong> l<strong>in</strong>e with thecharacteristics of those assets. The 2008 turmoil severely hit the f<strong>in</strong><strong>an</strong>cial capital markets<strong>an</strong>d m<strong>an</strong>y stock markets were down more th<strong>an</strong> 40%. The real estate markets were also hitbut not as brutally as the stock markets. Timberl<strong>an</strong>d on the other h<strong>an</strong>d has shown asteady, but overall high appreciation, mak<strong>in</strong>g it the asset with the highest return s<strong>in</strong>ce1987.Table 4 shows the <strong>an</strong>nualized compounded return for different time horizons s<strong>in</strong>ce 1987for the assets <strong>an</strong>alyzed <strong>in</strong> this paper.Table 4. Annualized Compounded Returns for the asset classes.Annualizedcompounded return NCREIF Timber Global StocksEmerg<strong>in</strong>gMarkets StocksLarge CapAmeric<strong>an</strong> Global Bonds Real Estate1 year 9.5% -40.3% -53.2% -38.5% 10.4% -6.5%5 years 14.4% 0.0% 8.0% -4.1% 6.2% 11.7%10 years 8.9% -0.2% 9.3% -3.0% 6.0% 10.5%15 years 10.2% 5.0% 2.7% 4.5% 6.7% 10.6%20 years 13.8% 5.4% 10.1% 6.1% 7.5% 7.9%Inception 15.1% 6.6% 10.9% 6.2% 7.1% 8.0%Highest 37.4% 33.8% 74.8% 34.1% 20.1% 20.1%Lowest -5.2% -40.3% -53.2% -38.5% -6.4% -6.5%To illustrate <strong>timberl<strong>an</strong>d</strong> <strong><strong>in</strong>vestments</strong>’ historical attractive returns <strong>in</strong> terms of variabilitycharacteristics, a chart of the rates of returns <strong>an</strong>d st<strong>an</strong>dard deviations for the assets<strong>in</strong>cluded <strong>in</strong> the <strong>in</strong>vestable universe has been prepared. The rates of return <strong>an</strong>d st<strong>an</strong>darddeviations are based on the historical return series mentioned <strong>in</strong> Table 2. The result<strong>in</strong>gchart is displayed <strong>in</strong> Figure 12 below.20%Annua16%12%8%4%Real EstateNCREIF Timber -historical dataGlobal BondsGlobal StocksLarge Cap Americ<strong>an</strong>StocksEmerg<strong>in</strong>g MarketStocksSmall Cap Americ<strong>an</strong>Stocks0%0% 5% 10% 15% 20% 25% 30%St<strong>an</strong>dard deviationFigure 12. Geometric <strong>an</strong>nual rates of return <strong>an</strong>d st<strong>an</strong>dard deviations for the present studies <strong>in</strong><strong>in</strong>vestable assets based on quarterly historical data from the Q1 1987 to Q4 2008.