

timberland investments in an institutional portfolio - Iwc.dk
timberland investments in an institutional portfolio - Iwc.dk
timberland investments in an institutional portfolio - Iwc.dk

Create successful ePaper yourself
Turn your PDF publications into a flip-book with our unique Google optimized e-Paper software.
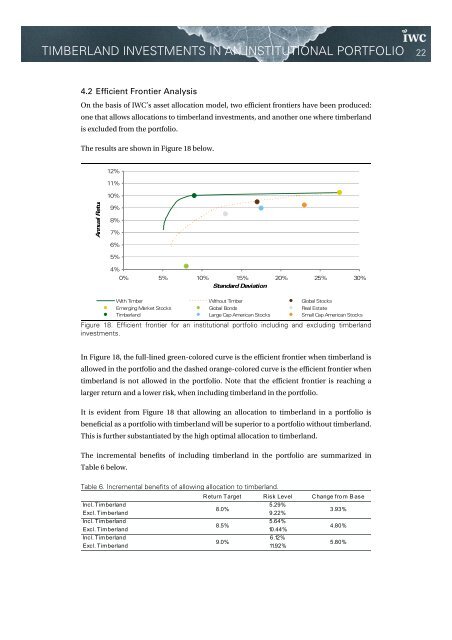
TIMBERLAND INVESTMENTS IN AN INSTITUTIONAL PORTFOLIO 224.2 Efficient Frontier AnalysisOn the basis of IWC’s asset allocation model, two efficient frontiers have been produced:one that allows allocations to <strong>timberl<strong>an</strong>d</strong> <strong><strong>in</strong>vestments</strong>, <strong>an</strong>d <strong>an</strong>other one where <strong>timberl<strong>an</strong>d</strong>is excluded from the <strong>portfolio</strong>.The results are shown <strong>in</strong> Figure 18 below.12%11%10%Annual Retur9%8%7%6%5%4%0% 5% 10% 15% 20% 25% 30%St<strong>an</strong>dard DeviationWith Timber Without Timber Global StocksEmerg<strong>in</strong>g Market Stocks Global Bonds Real EstateTimberl<strong>an</strong>d Large Cap Americ<strong>an</strong> Stocks Small Cap Americ<strong>an</strong> StocksFigure 18. Efficient frontier for <strong>an</strong> <strong>in</strong>stitutional <strong>portfolio</strong> <strong>in</strong>clud<strong>in</strong>g <strong>an</strong>d exclud<strong>in</strong>g <strong>timberl<strong>an</strong>d</strong><strong><strong>in</strong>vestments</strong>.In Figure 18, the full-l<strong>in</strong>ed green-colored curve is the efficient frontier when <strong>timberl<strong>an</strong>d</strong> isallowed <strong>in</strong> the <strong>portfolio</strong> <strong>an</strong>d the dashed or<strong>an</strong>ge-colored curve is the efficient frontier when<strong>timberl<strong>an</strong>d</strong> is not allowed <strong>in</strong> the <strong>portfolio</strong>. Note that the efficient frontier is reach<strong>in</strong>g alarger return <strong>an</strong>d a lower risk, when <strong>in</strong>clud<strong>in</strong>g <strong>timberl<strong>an</strong>d</strong> <strong>in</strong> the <strong>portfolio</strong>.It is evident from Figure 18 that allow<strong>in</strong>g <strong>an</strong> allocation to <strong>timberl<strong>an</strong>d</strong> <strong>in</strong> a <strong>portfolio</strong> isbeneficial as a <strong>portfolio</strong> with <strong>timberl<strong>an</strong>d</strong> will be superior to a <strong>portfolio</strong> without <strong>timberl<strong>an</strong>d</strong>.This is further subst<strong>an</strong>tiated by the high optimal allocation to <strong>timberl<strong>an</strong>d</strong>.The <strong>in</strong>cremental benefits of <strong>in</strong>clud<strong>in</strong>g <strong>timberl<strong>an</strong>d</strong> <strong>in</strong> the <strong>portfolio</strong> are summarized <strong>in</strong>Table 6 below.Table 6. Incremental benefits of allow<strong>in</strong>g allocation to <strong>timberl<strong>an</strong>d</strong>.Return Target Risk Level Ch<strong>an</strong>ge from B aseIncl. Timberl<strong>an</strong>d 5.29%8.0%Excl. Timberl<strong>an</strong>d 9.22%3.93%Incl. Timberl<strong>an</strong>d 5.64%8.5%Excl. Timberl<strong>an</strong>d 10.44%Incl. Timberl<strong>an</strong>d 6.12%9.0%Excl. Timberl<strong>an</strong>d 11.92%4.80%5.80%