SFUSD School Site List and Summary - San Francisco Public Schools
SFUSD School Site List and Summary - San Francisco Public Schools
SFUSD School Site List and Summary - San Francisco Public Schools
- No tags were found...

You also want an ePaper? Increase the reach of your titles
YUMPU automatically turns print PDFs into web optimized ePapers that Google loves.
<strong>San</strong> <strong>Francisco</strong>Unified <strong>School</strong> District<strong>School</strong>Elementary K-5 <strong>School</strong>s<strong>San</strong>chez ESSerra ESSheridan ESSherman ESSloat ESSpring Valley ESStevenson ESSunnyside ESSunset ESSutro ESTaylor ESTenderloin ESUlloa ESVisitacion Valley ESWebster ESWest Portal ESYick Wo ESStudentSch# CountPg 3 of 5Ethnic Representation<strong>School</strong> <strong>Site</strong> <strong>List</strong> & <strong>Summary</strong> [ Version 1.0 ]CBEDS Information Day, October 3, 2012L OW AA C J K AI F ONW45% % % % % % % % % %DS%ELL**%816 258 - 81.0 3.5 5.4 0.4 -- -- 1.2 1.2 5.0 2.3 55.0656 282 - 70.6 5.0 7.1 5.0 -- -- 0.4 2.5 5.3 4.3 50.0820 209 31.6 6.2 25.8 9.6 0.5 0.5 -- 8.6 13.4 3.8 34.0823 401 14.0 32.2 8.2 26.4 2.2 0.7 0.7 1.7 10.0 3.7 23.7488 393 9.9 31.0 5.3 32.1 1.3 1.0 0.5 5.3 9.2 4.3 26.2834 353 36.0 4.5 4.2 44.2 0.3 0.6 0.6 1.1 4.8 3.7 50.4782 493 - 2.0 4.3 0.8 74.8 0.2 -- 0.6 3.0 9.7 4.5 31.8842 359 24.5 34.0 10.0 10.0 -- 0.3 0.3 8.9 7.5 4.5 16.4750 414 6.8 31.6 1.9 38.6 1.7 0.7 1.0 1.9 10.9 4.8 18.1848 242 - 3.7 8.7 0.4 66.1 1.2 1.2 -- 3.3 13.2 2.1 40.1513 660 - 28.6 1.2 3.0 52.6 -- -- 0.2 3.0 10.2 1.2 48.9859 388 33.2 2.6 15.5 5.2 -- -- 1.5 4.4 35.1 2.6 50.3862 507 - 3.2 4.9 1.4 72.6 0.6 0.6 0.2 3.0 11.2 2.4 45.4867 468 - 14.7 0.2 14.7 46.8 -- -- 0.9 5.8 14.5 2.4 47.6497 260 - 47.3 20.8 18.1 0.8 0.8 -- 1.2 1.5 7.7 1.9 35.8876 577 - 5.2 15.6 1.7 56.2 1.9 1.2 0.3 2.8 12.1 2.9 32.9801 275 8.0 30.2 3.6 38.2 0.7 0.4 0.4 1.5 10.9 6.2 29.1Middle <strong>School</strong>sAptos MSDenman MSEverett MS<strong>Francisco</strong> MSGiannini MSHoover MSKing MSLick MSMarina MSPresidio MSRoosevelt MSVisitacion Valley MS431 1,055 31.4 13.4 9.8 26.0 0.6 0.4 0.4 6.9 6.5 4.7 11.0632 591 39.1 2.9 7.8 17.1 -- 0.5 0.8 24.0 5.6 2.2 25.4529 399 - 50.1 9.3 19.0 4.5 -- 0.8 0.5 4.8 6.8 4.3 26.1546 547 - 10.1 3.1 9.9 63.8 -- -- 1.1 2.4 7.3 2.4 41.7404 1,153 - 9.5 11.5 5.7 51.6 1.0 0.4 0.6 2.9 11.4 5.3 9.8607 1,031 24.5 6.1 4.8 44.9 1.0 0.4 0.3 3.9 8.7 5.4 15.3710 524 24.2 1.3 19.3 32.1 -- -- 0.6 7.8 12.4 2.3 19.3634 561 - 66.5 13.9 6.8 1.6 -- -- 2.5 1.2 2.7 4.8 32.6708 818 - 16.1 6.5 10.1 48.3 0.7 1.0 0.6 4.2 9.9 2.6 23.0778 1,172 9.4 18.9 5.6 39.9 3.8 0.9 0.9 3.2 11.0 6.5 8.8797 708 12.4 14.3 6.6 40.0 1.4 1.0 0.1 3.1 14.7 6.4 11.9868 390 28.5 3.3 26.7 16.4 -- -- 0.5 9.7 13.1 1.8 25.1<strong>SFUSD</strong>\RPA (10/15/12) V1.0 -- Note: Charter <strong>School</strong> student enrollment is subject to revision or may not yet be available (CALPADS, self-reporting schools).
<strong>San</strong> <strong>Francisco</strong>Unified <strong>School</strong> District<strong>School</strong>StudentSch# CountPg 4 of 5Ethnic Representation<strong>School</strong> <strong>Site</strong> <strong>List</strong> & <strong>Summary</strong> [ Version 1.0 ]CBEDS Information Day, October 3, 2012L OW AA C J K AI F ONW45% % % % % % % % % %DS%ELL**%High <strong>School</strong>sAcdmy Arts & Sci HSAsawa SF HS of ArtsBalboa HSBurton HSDowntown HSGalileo HSIndependence HSJordan Sch Equity HSLincoln HSLowell HSMarshall HSMission HSO'Connell HSS.F International HSWallenberg HSWashington HSWells HS832 341 - 46.0 14.1 8.5 12.0 0.3 0.6 0.9 6.2 8.2 3.2 11.1815 605 14.2 39.5 7.9 15.2 3.6 0.3 0.8 5.6 6.6 6.1 1.3439 1,338 26.2 6.5 7.1 35.1 0.4 0.3 0.4 12.7 8.9 2.4 14.7764 922 21.5 1.5 12.4 27.2 0.1 0.2 0.3 22.1 13.3 1.3 15.7742 261 - 55.6 2.3 21.8 2.3 -- -- 0.8 4.2 11.1 1.9 30.7559 2,100 - 14.2 3.1 4.7 60.6 0.5 0.3 0.2 3.4 9.3 3.6 19.5466 289 30.4 15.9 22.8 6.6 0.3 0.7 1.4 6.9 10.4 4.5 10.4757 252 - 53.6 3.6 25.8 4.4 -- -- 0.8 5.6 4.8 1.6 23.8405 2,014 - 16.9 5.2 7.1 50.3 0.9 0.6 0.3 5.3 10.0 3.4 21.9697 2,653 - 9.3 14.5 2.4 48.1 1.5 1.4 0.2 6.9 10.4 5.4 1.5853 552 - 22.5 0.5 13.2 47.1 -- 0.2 -- 3.3 11.4 1.8 36.8725 932 37.3 7.9 14.7 23.2 0.3 0.6 1.6 4.5 8.0 1.7 30.9651 453 - 59.4 3.5 15.7 5.5 0.7 0.4 0.2 6.8 7.3 0.4 21.6621 325 42.2 0.6 0.6 44.3 -- -- -- 2.8 8.0 1.5 84.9785 657 17.7 5.5 11.1 44.3 1.7 1.4 0.3 3.0 11.3 3.8 12.5571 1,942 - 12.8 7.4 5.8 50.6 1.5 1.3 0.6 4.1 12.9 3.0 16.4743 215 35.8 3.3 30.2 14.0 -- 0.5 0.9 2.3 11.2 1.9 20.5Alternatively Configured <strong>School</strong>sBuena Vista/ Mann K8 618 590 - 73.7 14.9 4.4 -- -- 0.2 0.5 0.8 1.5 3.9 44.2Carmichael ES 449 647 26.4 3.4 10.8 2.5 -- -- 0.8 44.0 8.2 3.9 38.2Intl Studies Acdmy HS 624 402 32.8 5.2 34.6 3.7 -- 0.5 1.5 9.7 10.7 1.2 14.2Lawton Alt K8676 607 - 4.8 6.8 3.0 59.5 1.2 1.3 0.3 3.6 13.5 6.1 20.8Lilienthal Alt K8 479 692 10.5 35.3 9.2 8.1 2.6 16.0 1.3 2.5 7.9 6.5 10.3Revere ES760 422 - 58.5 6.4 17.5 1.9 -- -- 1.2 8.1 3.8 2.6 44.3Rooftop Alt K8796 587 23.0 27.9 15.3 12.1 1.4 0.7 1.2 3.6 7.3 7.5 11.6S.F. Community ES 493 280 40.7 11.4 17.5 12.5 0.4 -- 0.4 11.4 2.9 2.9 27.9Yu Alt K8485 574 - 4.4 7.7 4.4 58.7 0.2 0.5 0.3 2.8 11.1 9.9 19.3Transition KindergartenTransition Kgn Sch TKN 129 34.1 14.7 7.0 27.9 -- 0.8 -- -- 10.1 5.4 --Charter <strong>School</strong>s -- [Enrollment subject to revision]City Arts & Tech HS 484 396 - 52.3 7.6 22.0 2.5 0.3 -- 1.3 5.6 5.6 3.0 17.7Creative Arts809 327 - 12.5 52.9 12.5 3.1 0.9 0.6 1.2 4.0 6.1 6.1 1.8Edison Charter Acdmy 517 575 - 78.1 2.3 11.3 0.7 -- 0.2 0.9 1.7 3.1 1.7 17.4Five Keys Adult HS 552 n/a -- -- -- -- -- -- -- -- -- -- --Five Keys Charter HS 543 n/a -- -- -- -- -- -- -- -- -- -- --Five Keys Indpnd HS 551 n/a -- -- -- -- -- -- -- -- -- -- --Gateway HS565 473 30.2 24.7 16.9 11.6 1.5 0.2 -- 3.0 7.0 4.9 7.4Gateway MS566 206 29.6 31.6 12.1 9.2 2.4 1.0 0.5 3.4 6.8 3.4 9.2KIPP Bayview Acdmy 658 253 - 19.0 0.4 63.6 0.8 -- -- 1.6 0.8 9.5 4.3 6.3KIPP S.F. Bay Acdmy 657 346 - 53.2 2.9 26.0 6.4 -- -- 1.2 2.0 2.0 6.4 16.2Leadership HS 678 240 - 65.4 3.8 20.0 0.8 -- -- 0.4 3.8 2.9 2.9 17.9Life Learn Acdmy HS 681 51 - 27.5 2.0 54.9 2.0 -- -- -- 2.0 5.9 5.9 7.8Metro Arts & Tech HS 720 121 - 47.1 2.5 38.0 0.8 -- -- 2.5 4.1 1.7 3.3 18.2<strong>SFUSD</strong>\RPA (10/15/12) V1.0 -- Note: Charter <strong>School</strong> student enrollment is subject to revision or may not yet be available (CALPADS, self-reporting schools).
<strong>San</strong> <strong>Francisco</strong>Unified <strong>School</strong> District<strong>School</strong>StudentSch# CountPg 5 of 5Ethnic Representation<strong>School</strong> <strong>Site</strong> <strong>List</strong> & <strong>Summary</strong> [ Version 1.0 ]CBEDS Information Day, October 3, 2012L OW AA C J K AI F ONW45% % % % % % % % % %DS%ELL**%SFCOE <strong>School</strong>sCnty Civic Ctr SecondaryCnty Court WoodsideCnty Opportunity <strong>School</strong>Cnty Special EdCnty Non-<strong>Public</strong> <strong>School</strong>269 36.1 11.2 22.7 8.9 0.4 -- 1.1 6.7 9.7 3.3 20.8126 33.3 7.1 43.7 1.6 -- 0.8 0.8 4.0 7.9 0.8 16.754 - 81.5 -- 13.0 -- -- -- -- 1.9 3.7 -- 44.415 33.3 6.7 33.3 6.7 -- -- -- -- 20.0 -- 33.3173 20.2 17.9 43.4 4.6 -- 0.6 -- 4.6 4.6 4.0 15.6<strong>SFUSD</strong>\RPA (10/15/12) V1.0 -- Note: Charter <strong>School</strong> student enrollment is subject to revision or may not yet be available (CALPADS, self-reporting schools).
<strong>San</strong> <strong>Francisco</strong> <strong>School</strong> <strong>Site</strong> <strong>List</strong> & <strong>Summary</strong> [ Version 1.0 ]Unified <strong>School</strong> District CBEDS Information Day, October 3, 2012ADDITIONAL INFORMATIONThere are 102 regular school sites, 13 charter schools, <strong>and</strong> Transition Kindergarten students in the<strong>SFUSD</strong> (<strong>School</strong> Operations Office). There are 5 “schools” that the <strong>School</strong> Operations Office hasdefined as being part of the <strong>San</strong> <strong>Francisco</strong> County Office of Education (SFCOE). The teachingsites with enrollment that comprise these SFCOE schools are listed below.CDS-CodeSFCOE: CAO= County <strong>School</strong>-- Opportunity 38-10389-3830395CCS= County <strong>School</strong>-- County Civic Center Secondary 38-10389-3830445CJC= County <strong>School</strong>-- Juvenile Court Woodside 38-10389-3830361CSE= County <strong>School</strong>-- Special Ed 38-10389-6069561CNP= County <strong>School</strong>-- Non-<strong>Public</strong> (Special Ed in Non-District <strong>School</strong>) 38-10389-0000001--------CPK= County Service-- Pre-Kgn (Special Ed), ………………..………. NoneCPP= County Service-- Private/ Parochial (Special Ed)………………. None-----------------------------------------------------------------------------------------------------------------------------------------------------------------------------------Program District SFCOE StudentNumber Description Grouping <strong>School</strong>s Count616 Hilltop CAO Cnty CAO 54482 Cnty Civic Center MS CCS Cnty CCS 5483 Cnty Civic Center HS CCS Cnty CCS 88486 Home Based Ed CCS Cnty CCS 36887 Gateway to College CCS Cnty CCS 140688 Log Cabin CJC Cnty CJC 22892 Woodside CJC Cnty CJC 16458 Early Morning Study Program Cnty CJC 43889 Principal’s Center Cnty CJC 45824 Sp Ed Home Hosp Cnty CSE 0813 18-22 Mild/Mod Prg Cnty CSE 15--------Many Sp Ed Non-Pub Sch Cnty CNP 173-------------------------------------------------------------------------------------------------------------------------------825 Sp Ed Pre-Kgn [Not in Sch] Other CPK 530827 Sp Ed Priv/Parochial Other CPP 323Students with GRADE code “PK” at an <strong>SFUSD</strong> school (99 students) are considered part of <strong>School</strong># CPKCharter <strong>School</strong>s: Student enrollment data for the charter schools is subject to revision. Five charter schoolssubmit their student data directly to the California Dept of Education (CALPADS, self-reporting) ratherthan through <strong>SFUSD</strong>: the three Five Keys Charter schools, City Arts & Tech, <strong>and</strong> Metro Arts & Tech.Transition Kindergarten: There are 5 Transition Kindergarten sites: Havard TK (#865), McLaren TK (#704),Noriega TK (#752), Rodriguez TK (#895), <strong>and</strong> Tule Elk Park TK (#860). All students enrolled attransition kindergarten sites are reported to the CDE using the CDS Code 38-68478-3868478.Ethic RepresentationCode Ethnic CategoryCode Ethnic CategoryL Latino / Hispanic J JapaneseOW Other White K KoreanAA African American F FilipinoC Chinese AI American IndianOther HeadingsCodeELLExplanationEnglish Language Learners[Limited (L) English Proficient ]** Pending (P) ELL not included in ELL countsONWDSOther Non-White [also includes Arabic,Samoan, South-East Asian (SE & IC)]Declines to State45% Indicates a predominant Ethnic Category(-) means Equal or Greater than 45%<strong>SFUSD</strong>\RPA (10/15/12) V1.0 --- This report is based on District data on CBEDS Information Day.
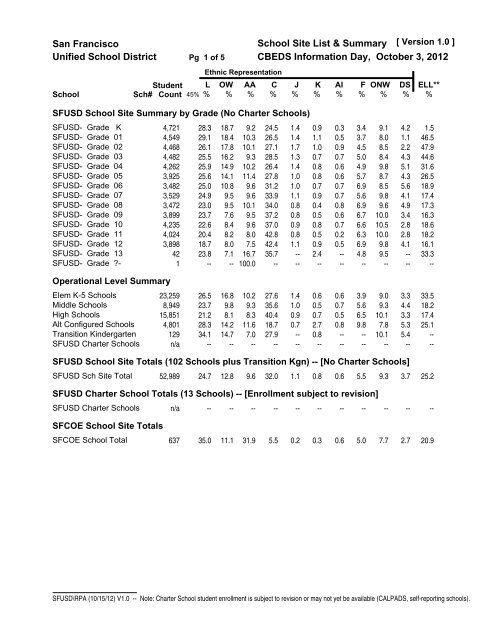
<strong>San</strong> <strong>Francisco</strong>Unified <strong>School</strong> District<strong>School</strong>StudentSch# CountPg 1 of 5Ethnic Representation<strong>School</strong> <strong>Site</strong> <strong>List</strong> & <strong>Summary</strong> [ Version 1.0 ]CBEDS Information Day, October 5, 2011L OW AA C J K AI F ONW45% % % % % % % % % %<strong>SFUSD</strong> <strong>School</strong> <strong>Site</strong> <strong>Summary</strong> by Grade (No Charter <strong>School</strong>s)<strong>SFUSD</strong>- Grade: K<strong>SFUSD</strong>- Grade: 01<strong>SFUSD</strong>- Grade: 02<strong>SFUSD</strong>- Grade: 03<strong>SFUSD</strong>- Grade: 04<strong>SFUSD</strong>- Grade: 05<strong>SFUSD</strong>- Grade: 06<strong>SFUSD</strong>- Grade: 07<strong>SFUSD</strong>- Grade: 08<strong>SFUSD</strong>- Grade: 09<strong>SFUSD</strong>- Grade: 10<strong>SFUSD</strong>- Grade: 11<strong>SFUSD</strong>- Grade: 12<strong>SFUSD</strong>- Grade: 13<strong>SFUSD</strong>- Grade: ??Operational Level <strong>Summary</strong>Elem K-5 <strong>School</strong>sMiddle <strong>School</strong>sHigh <strong>School</strong>sAlt Configured <strong>School</strong>sCharter <strong>School</strong>sDS%ELL**%4,668 29.0 19.0 10.4 25.7 1.4 1.1 0.5 3.6 8.2 1.1 8.24,590 25.8 18.3 10.4 26.3 1.7 1.0 0.9 4.5 8.5 2.5 46.74,539 25.2 16.7 9.4 28.2 1.3 0.8 0.7 5.0 8.4 4.4 50.94,332 25.7 15.7 10.5 25.7 1.5 0.8 0.5 4.8 9.4 5.4 40.94,080 25.9 14.0 12.2 26.5 1.0 1.0 0.6 5.6 8.5 4.6 33.43,833 24.8 12.0 10.6 28.6 1.2 0.7 0.7 6.4 8.3 6.8 27.73,482 24.7 9.8 9.9 33.4 1.0 0.8 0.7 5.5 10.0 4.2 22.83,454 23.1 9.6 10.2 33.3 0.8 0.5 0.7 6.8 10.0 5.0 20.03,566 22.3 8.1 10.3 36.6 0.8 0.5 0.6 6.2 10.6 3.9 18.84,085 22.5 8.1 10.1 36.8 0.9 0.8 0.5 6.5 11.1 2.8 20.24,201 21.8 7.9 9.4 40.7 0.8 0.6 0.3 5.9 10.0 2.8 20.83,994 20.4 7.7 8.3 40.5 1.0 0.8 0.6 6.4 10.0 4.2 21.04,036 18.0 7.2 8.3 45.3 1.0 0.8 0.3 6.9 10.9 1.3 18.239 23.1 5.1 20.5 35.9 -- 2.6 -- 2.6 10.3 -- 28.21 -- 100.0 -- -- -- -- -- -- -- -- --22,983 25.8 16.0 10.7 27.8 1.4 0.6 0.6 4.3 8.8 3.8 35.18,974 22.7 9.1 9.7 37.0 0.9 0.4 0.7 5.3 10.1 4.1 21.016,080 20.4 7.7 8.7 41.4 0.9 0.8 0.4 6.4 10.5 2.8 20.14,863 28.5 13.7 11.6 18.5 0.7 2.4 0.7 10.1 8.3 5.4 26.7n/a -- -- -- -- -- -- -- -- -- -- --<strong>SFUSD</strong> <strong>School</strong> <strong>Site</strong> Totals (102 <strong>School</strong>s) -- [No Charter <strong>School</strong>s]<strong>SFUSD</strong> <strong>School</strong> <strong>Site</strong>s52,900 23.9 12.1 10.0 32.6 1.1 0.8 0.6 5.6 9.5 3.7 27.4<strong>SFUSD</strong> Charter <strong>School</strong> Totals (13 <strong>School</strong>s) -- [Enrollment subject to revision]<strong>SFUSD</strong> Charter <strong>School</strong>sn/a---- -- -- -- -- -- -- -- -- --SFCOE <strong>School</strong> <strong>Site</strong> TotalsSFCOE <strong>School</strong> Totals570 27.2 13.0 36.7 4.4 0.4 0.5 0.7 5.3 9.5 2.5 19.5<strong>SFUSD</strong>\RPA (10/13/11) V1.1 -- Note: Charter <strong>School</strong> student enrollment is subject to revision or may not yet be available (CALPADS, self-reporting schools).
<strong>San</strong> <strong>Francisco</strong>Unified <strong>School</strong> District<strong>School</strong>Elementary K-5 <strong>School</strong>sAlamo ESAlvarado ESArgonne ESBryant ESCarver ESChavez ESChin ESChinese Ed Ctr ESChinese Immersion ESClarendon ESClevel<strong>and</strong> ESCobb ESDrew CP AcdyEl Dorado ESFairmount ESFeinstein ESFlynn ESGarfield ESGlen Park ESGrattan ESGuadalupe ESHarte ESHillcrest ESJefferson ESKey ESKing ESLafayette ESLakeshore ESLau ESLongfellow ESMalcolm X Acdy ESMarshall ESMcCoppin ESMcKinley ESMilk ESMiraloma ESMission Ed Ctr ESMonroe ESMoscone ESMuir ESNew Traditions ESOrtega ESParker ESParks ESPeabody ESRedding ESStudentSch# CountPg 2 of 5Ethnic Representation<strong>School</strong> <strong>Site</strong> <strong>List</strong> & <strong>Summary</strong> [ Version 1.0 ]CBEDS Information Day, October 5, 2011L OW AA C J K AI F ONW45% % % % % % % % % %DS%ELL**%413 511 - 6.8 19.4 0.8 49.1 3.3 1.0 0.2 2.7 12.5 4.1 30.3420 516 42.8 35.7 6.4 0.8 1.6 0.2 0.8 2.7 3.7 5.4 26.9435 426 8.2 27.7 4.0 41.1 2.1 0.2 0.2 1.2 10.6 4.7 32.9456 248 - 86.7 1.2 4.4 -- -- -- 1.2 2.0 2.4 2.0 64.5625 249 - 8.8 0.8 69.5 -- -- -- 2.0 0.8 15.3 2.8 7.2603 480 - 82.7 0.8 4.0 1.9 0.2 0.2 0.8 3.1 2.7 3.5 61.3872 251 - 0.8 4.0 0.4 85.3 1.2 0.8 -- 1.2 4.8 1.6 67.3476 69 -- -- -- 98.6 -- -- -- -- 1.4 -- 55.1509 232 - 1.3 25.0 2.6 54.7 0.9 1.7 -- 2.2 6.9 4.7 15.1478 572 10.7 35.0 4.2 14.3 13.6 2.3 1.2 2.6 8.2 7.9 11.4481 338 - 77.2 0.6 3.6 5.0 -- -- 1.2 6.2 5.0 1.2 61.5525 196 - 18.9 8.7 53.6 1.5 -- -- 3.1 4.6 8.2 1.5 11.2507 276 - 10.5 0.4 76.1 0.4 -- -- 0.7 1.1 5.4 5.4 5.8521 314 29.6 2.9 35.0 5.1 -- 0.3 0.3 8.0 15.6 3.2 23.2537 386 - 67.4 17.4 4.9 0.8 -- 0.3 0.8 1.8 1.8 4.9 44.3539 486 9.5 32.9 4.1 30.2 1.9 0.8 0.2 4.7 11.7 3.9 18.9680 478 - 57.3 18.6 14.9 0.2 0.2 0.4 -- 2.3 3.3 2.7 36.8562 249 - 6.8 12.0 6.8 55.4 1.6 1.2 -- 3.6 10.0 2.4 38.2575 346 - 50.9 8.1 17.3 6.1 0.3 -- 0.3 8.1 4.3 4.6 35.5589 387 - 12.1 58.1 8.3 4.9 3.9 1.6 1.0 1.0 4.9 4.1 11.9593 483 - 47.8 2.5 4.3 22.2 -- 0.2 0.8 12.8 7.0 2.3 52.0453 215 38.1 1.9 40.9 -- -- -- 1.4 1.4 14.0 2.3 34.0614 456 44.1 2.9 10.7 22.6 -- -- 0.2 6.1 10.7 2.6 47.6644 501 - 4.2 23.4 1.6 46.1 1.6 0.6 0.4 3.2 14.4 4.6 31.5544 534 - 5.6 15.9 2.1 51.7 2.6 2.2 0.4 3.6 13.7 2.2 28.8838 360 20.0 21.9 20.3 21.1 0.3 -- 0.3 1.4 10.3 4.4 20.3664 534 8.4 37.3 3.0 27.2 2.8 1.5 1.1 3.9 8.8 6.0 15.4670 537 14.5 13.6 17.5 29.1 1.5 2.4 0.4 6.0 11.5 3.5 24.8490 668 - 11.7 0.3 0.1 82.8 -- -- 0.3 0.9 2.5 1.3 62.9691 612 38.2 1.0 3.8 22.2 -- 0.2 0.3 27.6 3.9 2.8 44.1830 106 - 6.6 0.9 67.0 0.9 -- -- 0.9 4.7 16.0 2.8 4.7714 244 - 82.8 7.4 2.5 -- 0.4 -- 0.4 2.0 -- 4.5 59.4549 275 - 12.7 10.9 5.5 46.5 0.7 1.5 0.7 1.5 14.9 5.1 45.5718 345 - 13.6 48.4 17.7 3.2 0.9 0.3 1.4 3.2 6.1 5.2 8.7505 253 12.3 37.2 29.6 4.3 1.2 -- 2.4 3.2 4.7 5.1 7.9722 359 - 7.2 57.1 8.4 7.5 1.7 0.8 0.3 2.8 4.2 10.0 8.1724 47 100.0 -- -- -- -- -- -- -- -- -- 70.2729 512 - 52.3 8.8 2.7 26.8 0.6 -- 0.2 2.9 2.3 3.3 57.2723 336 - 63.1 1.8 1.5 25.3 -- 0.6 0.6 1.2 3.3 2.7 61.9650 237 - 45.1 2.5 38.8 0.8 -- -- 0.8 4.2 2.5 5.1 33.8735 240 - 13.8 45.8 20.0 3.3 0.4 0.8 2.1 4.2 5.4 4.2 8.8746 302 15.6 14.9 17.5 31.1 0.7 -- 0.7 6.6 9.6 3.3 18.9638 292 - 5.1 2.4 3.4 81.2 0.3 0.3 -- 0.7 4.8 1.7 54.8786 392 15.1 12.2 35.5 2.3 14.3 1.0 0.3 4.1 11.5 3.8 21.4569 254 11.8 43.3 4.7 10.2 2.8 3.1 0.8 5.5 10.6 7.1 16.9790 315 28.9 7.6 5.7 11.1 -- 1.0 1.6 7.6 33.0 3.5 55.9<strong>SFUSD</strong>\RPA (10/13/11) V1.1 -- Note: Charter <strong>School</strong> student enrollment is subject to revision or may not yet be available (CALPADS, self-reporting schools).
<strong>San</strong> <strong>Francisco</strong>Unified <strong>School</strong> District<strong>School</strong>Elementary K-5 <strong>School</strong>sSF Pub Montessori ES<strong>San</strong>chez ESSerra ESSheridan ESSherman ESSloat ESSpring Valley ESStevenson ESSunnyside ESSunset ESSutro ESTaylor ESTenderloin ESUlloa ESVis Valley ESWebster ESWest Portal ESYick Wo ESStudentSch# CountPg 3 of 5Ethnic Representation<strong>School</strong> <strong>Site</strong> <strong>List</strong> & <strong>Summary</strong> [ Version 1.0 ]CBEDS Information Day, October 5, 2011L OW AA C J K AI F ONW45% % % % % % % % % %DS%ELL**%814 57 - 8.8 52.6 15.8 7.0 5.3 -- 1.8 1.8 7.0 -- 8.8816 280 - 81.4 3.6 6.4 0.7 -- -- 1.8 0.7 2.9 2.5 61.1656 282 - 69.1 5.3 5.7 4.6 -- -- 1.1 3.9 5.3 5.0 53.9820 211 31.8 5.2 26.1 10.0 0.5 0.5 0.9 11.4 10.9 2.8 29.9823 414 12.6 33.3 6.8 29.2 2.2 1.2 0.7 1.2 9.4 3.4 24.6488 388 8.0 28.6 8.0 32.5 0.8 1.5 0.8 5.2 9.5 5.2 24.7834 343 35.3 5.0 4.4 44.6 0.6 0.9 0.3 0.9 4.4 3.8 51.9782 469 - 2.1 4.7 1.7 72.9 0.9 -- 0.4 3.6 8.3 5.3 35.4842 366 22.4 31.1 11.7 12.0 -- -- 0.5 9.3 7.9 4.9 18.3750 398 6.3 29.4 2.0 41.2 2.0 0.3 1.3 2.3 10.1 5.3 19.8848 240 - 3.3 10.0 1.3 66.7 0.8 0.8 -- 3.3 12.5 1.3 39.6513 665 - 27.4 1.4 3.8 52.2 -- -- 0.2 3.9 9.3 2.0 49.3859 389 32.1 2.8 13.6 6.9 -- -- 0.8 5.7 35.7 2.3 48.6862 508 - 2.4 5.5 2.0 71.1 0.6 0.4 0.2 3.7 11.2 3.0 40.4867 458 15.7 0.7 17.0 43.9 -- -- 0.9 7.0 12.7 2.2 48.7497 247 - 48.2 18.2 19.0 0.4 0.8 -- 1.2 0.8 9.3 2.0 35.6876 578 - 5.2 15.7 2.2 54.5 1.2 1.4 0.2 3.8 11.2 4.5 33.4801 271 5.9 29.2 4.1 38.4 1.1 1.1 0.4 1.5 12.2 6.3 31.7Middle <strong>School</strong>sAptos MSDenman MSEverett MS<strong>Francisco</strong> MSGiannini MSHoover MSKing MSLick MSMarina MSPresidio MSRoosevelt MSVis Valley MS431 983 32.8 13.0 8.1 24.9 0.3 0.2 0.6 7.6 7.0 5.4 17.9632 604 38.1 2.0 8.6 18.5 -- 0.7 0.5 23.3 7.1 1.2 28.0529 346 - 51.7 6.1 24.0 2.3 -- 0.3 1.2 4.6 7.2 2.6 37.9546 587 - 10.6 3.1 12.8 62.4 -- -- 0.9 1.9 7.2 1.4 41.6404 1,196 - 9.6 10.3 6.0 52.0 0.9 0.4 0.3 3.0 12.3 5.1 14.6607 1,079 24.6 7.0 5.7 44.4 1.0 0.6 0.6 3.3 8.7 4.2 17.7710 518 20.7 0.8 21.2 33.2 -- -- 0.8 5.8 16.4 1.2 22.8634 554 - 64.3 13.7 7.2 1.8 0.5 -- 2.0 1.4 3.1 6.0 29.8708 832 - 14.4 6.4 9.6 53.2 0.2 0.5 0.6 2.5 10.3 2.2 24.8778 1,177 9.2 17.3 5.4 41.8 3.1 1.0 0.8 2.7 11.5 7.1 10.7797 713 11.5 13.3 6.7 42.8 2.2 0.8 0.3 2.8 14.2 5.3 12.1868 385 22.6 2.3 27.0 16.4 -- -- 0.3 13.2 16.6 1.6 26.2<strong>SFUSD</strong>\RPA (10/13/11) V1.1 -- Note: Charter <strong>School</strong> student enrollment is subject to revision or may not yet be available (CALPADS, self-reporting schools).
<strong>San</strong> <strong>Francisco</strong>Unified <strong>School</strong> District<strong>School</strong>StudentSch# CountPg 4 of 5Ethnic Representation<strong>School</strong> <strong>Site</strong> <strong>List</strong> & <strong>Summary</strong> [ Version 1.0 ]CBEDS Information Day, October 5, 2011L OW AA C J K AI F ONW45% % % % % % % % % %DS%ELL**%High <strong>School</strong>sAcdy Arts & Sci HSAsawa SF HS of ArtsBalboa HSBurton HSDowntown HSGalileo HSIndependence HSJordan Sch Equity HSLincoln HSLowell HSMarshall HSMission HSO'Connell HSS.F International HSWallenberg HSWashington HSWells HS832 342 44.7 16.4 7.3 14.9 0.3 0.3 1.5 4.4 7.9 2.3 15.5815 600 15.2 41.0 6.3 17.7 2.5 1.2 0.2 4.5 7.2 4.3 1.8439 1,383 22.6 6.1 8.2 38.3 0.6 0.5 0.5 12.3 8.8 2.0 16.6764 877 22.7 1.6 14.0 26.5 0.1 0.3 0.3 20.6 12.5 1.3 21.3742 267 - 49.1 1.9 30.7 2.2 -- -- 1.1 5.2 9.0 0.7 29.2559 2,133 - 11.9 2.9 4.8 60.6 0.6 0.5 0.2 3.8 10.9 3.8 22.5466 289 37.4 11.4 26.6 5.5 0.3 0.7 1.4 5.9 9.0 1.7 22.1757 257 - 55.3 1.9 24.9 4.7 -- -- 0.8 4.7 5.8 1.9 26.5405 2,024 - 17.9 4.8 5.9 51.2 1.0 0.5 0.3 5.2 10.2 2.8 25.6697 2,632 - 8.8 14.8 2.3 48.8 1.7 1.4 0.3 6.9 10.6 4.4 2.0853 660 - 18.9 0.3 16.7 47.4 -- 0.2 0.5 3.2 11.5 1.4 38.3725 929 40.2 6.0 15.0 22.9 0.3 0.5 0.6 4.0 9.5 1.0 38.4651 475 - 58.1 2.7 16.2 6.5 0.2 -- 1.1 7.4 6.7 1.1 32.8621 189 - 37.0 1.1 1.1 49.2 -- -- -- 3.2 7.4 1.1 91.5785 657 18.6 3.8 12.5 44.9 1.4 1.1 0.6 2.9 10.8 3.5 16.3571 2,136 - 11.3 6.8 5.3 52.5 1.5 1.3 0.4 4.3 14.0 2.7 18.0743 230 39.6 3.9 33.0 10.0 -- 0.9 0.9 3.5 8.3 -- 26.1Alternatively Configured <strong>School</strong>sBuena Vista/ Mann K8 618 615 - 71.5 14.0 6.8 0.3 -- 0.2 0.7 1.0 2.6 2.9 44.6Carmichael ES 449 673 - 27.6 3.4 9.1 1.9 0.1 -- 0.7 45.8 8.5 2.8 41.5Intl Study Acdy HS 624 417 34.8 7.0 30.5 4.6 -- 0.2 1.0 8.9 12.5 0.7 18.2Lawton Alt K8676 611 - 4.4 5.6 3.4 60.9 1.1 1.3 0.3 3.3 12.3 7.4 23.7Lilienthal Alt K8 479 684 9.8 33.8 10.7 8.8 2.2 14.6 1.2 2.6 8.9 7.5 12.6Revere ES760 430 - 59.1 5.1 19.1 1.2 -- -- 1.2 7.2 4.0 3.3 43.5Rooftop Alt K8796 591 23.0 25.9 16.4 12.9 1.4 0.5 0.8 3.7 7.8 7.6 13.4S.F. Community ES 493 284 38.7 14.4 15.1 13.0 0.7 -- 0.7 11.6 3.2 2.5 28.2Yu Alt K8485 558 - 4.1 8.6 3.6 56.8 0.2 0.4 -- 2.7 13.1 10.6 16.3Charter <strong>School</strong>s -- [Enrollment subject to revision]City Arts & Tech HS 484 418 - 50.7 9.8 20.3 2.2 0.2 -- 1.4 6.2 6.9 2.2 18.9Creative Arts809 277 - 11.9 50.9 14.8 3.2 1.1 1.1 1.4 3.6 6.5 5.4 2.5Edison Charter Acdy 517 579 - 76.0 1.7 13.6 0.7 -- -- 0.9 1.7 3.5 1.9 19.7Five Keys Adult HS 552 n/a -- -- -- -- -- -- -- -- -- -- --Five Keys Charter HS 543 n/a -- -- -- -- -- -- -- -- -- -- --Five Keys Indpnd HS 551 n/a -- -- -- -- -- -- -- -- -- -- --Gateway HS565 481 31.0 26.2 15.0 11.2 1.2 0.2 0.2 3.3 7.3 4.4 5.4Gateway MS566 103 28.2 32.0 10.7 8.7 2.9 1.0 -- 4.9 7.8 3.9 14.6KIPP Bayview Acdy 658 251 - 17.9 -- 65.7 1.2 -- -- 1.6 1.2 9.6 2.8 8.8KIPP S.F. Bay Acdy 657 352 - 54.5 4.3 25.0 5.7 0.6 -- 1.1 2.3 2.0 4.5 17.0Leadership HS 678 254 - 61.8 3.9 18.5 2.0 -- -- 1.2 5.1 2.8 4.7 20.1Life Learn Acdy HS 681 47 - 27.7 8.5 57.4 2.1 -- -- -- -- -- 4.3 8.5Metro Arts & Tech HS 720 132 - 47.0 6.1 30.3 1.5 -- -- 2.3 3.0 6.1 3.8 23.5<strong>SFUSD</strong>\RPA (10/13/11) V1.1 -- Note: Charter <strong>School</strong> student enrollment is subject to revision or may not yet be available (CALPADS, self-reporting schools).
<strong>San</strong> <strong>Francisco</strong>Unified <strong>School</strong> District<strong>School</strong>StudentSch# CountPg 5 of 5Ethnic Representation<strong>School</strong> <strong>Site</strong> <strong>List</strong> & <strong>Summary</strong> [ Version 1.0 ]CBEDS Information Day, October 5, 2011L OW AA C J K AI F ONW45% % % % % % % % % %DS%ELL**%SFCOE <strong>School</strong>sCnty Civic Ctr SecondaryCnty Court WoodsideCnty Opportunity <strong>School</strong>Cnty Special EdCnty Non-<strong>Public</strong> <strong>School</strong>157 24.8 13.4 30.6 4.5 -- -- 1.3 8.9 14.0 2.5 20.486 31.4 7.0 39.5 4.7 -- 1.2 -- 2.3 9.3 4.7 22.170 - 64.3 4.3 24.3 -- -- -- -- 5.7 1.4 -- 31.432 25.0 15.6 28.1 12.5 3.1 -- -- 3.1 12.5 -- 28.1225 16.0 17.3 44.9 4.4 0.4 0.9 0.9 4.0 8.4 2.7 12.9<strong>SFUSD</strong>\RPA (10/13/11) V1.1 -- Note: Charter <strong>School</strong> student enrollment is subject to revision or may not yet be available (CALPADS, self-reporting schools).
<strong>San</strong> <strong>Francisco</strong> <strong>School</strong> <strong>Site</strong> <strong>List</strong> & <strong>Summary</strong> [ Version 1.1 ]Unified <strong>School</strong> District CBEDS Information Day, October 5, 2011ADDITIONAL INFORMATIONThere are 102 regular school sites <strong>and</strong> 13 charter schools in the <strong>SFUSD</strong> (<strong>School</strong> Operations Office).There are 5 “schools” that the <strong>School</strong> Operations Office has defined as being part of the<strong>San</strong> <strong>Francisco</strong> County Office of Education (SFCOE). The teaching sites (County programs,Instructional programs, etc.) with enrollment that comprise these SFCOE schools are listed below.CDS-CodeSFCOE: CAO= County <strong>School</strong>-- Opportunity 38-10389-3830395CCS= County <strong>School</strong>-- County Civic Center Secondary 38-10389-3830445CJC= County <strong>School</strong>-- Juvenile Court Woodside 38-10389-3830361CSE= County <strong>School</strong>-- Special Ed 38-10389-6069561CNP= County <strong>School</strong>-- Non-<strong>Public</strong> (Special Ed in Non-District <strong>School</strong>) 38-10389-0000001--------CPK= County Service-- Pre-Kgn (Special Ed), ………………..………. NoneCPP= County Service-- Private/ Parochial (Special Ed)………………. None-----------------------------------------------------------------------------------------------------------------------------------------------------------------------------------Program District SFCOE StudentNumber Description Grouping <strong>School</strong>s Count616 Hilltop CAO Cnty CAO 70482 Cnty Civic Center MS CCS Cnty CCS 10483 Cnty Civic Center HS CCS Cnty CCS 102486 Home Based Ed CCS Cnty CCS 45688 Log Cabin CJC Cnty CJC 19892 Woodside CJC Cnty CJC 11458 Early Morning Study Program Cnty CJC 17889 Principal’s Center Cnty CJC 39824 Sp Ed Home Hosp Cnty CSE 13813 18-22 Mild/Mod Prg Cnty CSE 19--------Many Sp Ed Non-Pub Sch Cnty CNP 225-------------------------------------------------------------------------------------------------------------------------------825 Sp Ed Pre-Kgn [Not in Sch] Other CPK 480827 Sp Ed Priv/Parochial Other CPP 315Students with GRADE code “PK” at an <strong>SFUSD</strong> school (83 students) are considered part of <strong>School</strong># CPKCharter <strong>School</strong>s: Student enrollment data for the charter schools is subject to revision. Five charter schoolssubmit their student data directly to the California Dept of Education (CALPADS, self-reporting) ratherthan through <strong>SFUSD</strong>: the three Five Keys Charter schools, City Arts & Tech, <strong>and</strong> Metro Arts & Tech.Ethic RepresentationCode Ethnic Category codes usedL Latino (SS=Hispanic)OW Other WhiteAA African American (B=Black)C ChineseJ JapaneseK KoreanAI American IndianF FilipinoONW Other Non-White [also includes Arabic,Samoan, South-East Asian (SE & IC)]DS Declines to StateOther HeadingsCodeELLExplanationEnglish Language Learners[Limited (L) English Proficient ]** Pending (P) ELL not included in ELL counts45% Indicates a predominant Ethnic Category(-) means Equal or Greater than 45%<strong>SFUSD</strong>\RPA (10/13/11) V1.1 --- This report is based on District data on CBEDS Information Day.
<strong>San</strong> <strong>Francisco</strong>Unified <strong>School</strong> District<strong>School</strong>StudentSch# CountPg 1 of 5Ethnic Representation<strong>School</strong> <strong>Site</strong> <strong>List</strong> & <strong>Summary</strong> [ Version 1.0 ]CBEDS Information Day, October 6, 2010L OW AA C J K AI F ONW45% % % % % % % % % %<strong>SFUSD</strong> <strong>School</strong> <strong>Site</strong> <strong>Summary</strong> by Grade (No Charter <strong>School</strong>s)<strong>SFUSD</strong>- Grade: K<strong>SFUSD</strong>- Grade: 01<strong>SFUSD</strong>- Grade: 02<strong>SFUSD</strong>- Grade: 03<strong>SFUSD</strong>- Grade: 04<strong>SFUSD</strong>- Grade: 05<strong>SFUSD</strong>- Grade: 06<strong>SFUSD</strong>- Grade: 07<strong>SFUSD</strong>- Grade: 08<strong>SFUSD</strong>- Grade: 09<strong>SFUSD</strong>- Grade: 10<strong>SFUSD</strong>- Grade: 11<strong>SFUSD</strong>- Grade: 12<strong>SFUSD</strong>- Grade: 13Operational Level <strong>Summary</strong>DS%ELL**%4,643 25.8 18.6 10.4 26.1 1.7 1.0 1.0 4.4 8.1 3.0 1.54,654 25.0 16.5 10.0 27.5 1.3 0.8 0.7 4.9 8.3 5.0 49.34,421 25.6 15.4 10.9 25.3 1.4 0.9 0.5 4.7 9.4 5.9 49.54,095 25.9 14.0 12.2 26.3 1.0 0.9 0.6 5.6 8.5 5.0 43.04,001 24.9 12.3 11.4 27.1 1.2 0.7 0.8 6.4 8.1 7.0 31.73,868 24.7 10.5 11.1 30.8 1.1 0.8 0.6 5.8 9.5 5.1 25.03,441 23.2 10.1 10.5 32.2 0.9 0.6 0.7 6.6 10.1 5.2 23.03,539 22.5 8.2 10.5 35.9 0.9 0.5 0.6 6.1 10.5 4.2 20.43,652 22.0 8.2 9.6 35.5 0.9 0.7 0.6 6.4 11.4 4.7 19.44,190 21.4 7.9 10.4 39.6 0.8 0.5 0.3 6.2 9.9 3.0 20.74,403 22.0 7.6 11.0 36.4 0.9 0.7 0.5 6.5 10.2 4.2 21.14,261 20.3 6.9 9.3 42.7 0.9 0.8 0.4 6.9 10.6 1.4 19.23,810 19.0 8.1 8.3 42.5 1.1 0.9 0.3 6.8 11.5 1.5 18.655 29.1 9.1 7.3 27.3 1.8 1.8 -- 1.8 21.8 -- 30.9Elem K-5 <strong>School</strong>s23,006 25.8 14.8 11.0 27.7 1.3 0.6 0.7 4.6 8.7 4.8 33.7Middle <strong>School</strong>s9,168 22.9 8.7 9.0 37.1 1.0 0.5 0.7 5.5 10.2 4.4 22.0High <strong>School</strong>s16,423 20.5 7.7 9.3 40.7 0.9 0.8 0.3 6.5 10.6 2.6 19.9Alt Config <strong>School</strong>s4,436 21.5 12.2 14.8 19.8 0.8 2.5 0.9 11.1 9.7 6.6 24.0Charter <strong>School</strong>s -- -- -- -- -- -- -- -- -- -- -- --<strong>SFUSD</strong> <strong>School</strong> <strong>Site</strong> Totals (104 <strong>School</strong>s)<strong>SFUSD</strong> <strong>School</strong> <strong>Site</strong>s53,033 23.3 11.3 10.4 32.7 1.1 0.8 0.6 5.9 9.6 4.2 26.6<strong>SFUSD</strong> Charter <strong>School</strong> Totals (11 <strong>School</strong>s) -- [Enrollment subject to revision]<strong>SFUSD</strong> Charter <strong>School</strong>s ------ -- -- -- -- -- -- -- -- --SFCOE <strong>School</strong> <strong>Site</strong> TotalsSFCOE <strong>School</strong> Totals601 26.3 9.3 42.8 5.7 0.3 0.2 1.0 3.7 8.5 2.3 18.0<strong>SFUSD</strong>\RPA (10/20/10) V1.0 -- Note: Charter <strong>School</strong> student enrollment is subject to revision <strong>and</strong> /or may not yet be available (CALPADS, self-reporting).
<strong>San</strong> <strong>Francisco</strong>Unified <strong>School</strong> District<strong>School</strong>Elementary K-5 <strong>School</strong>sAlamo ESAlvarado ESArgonne ESBryant ESBuena Vista ESCarver ESChavez ESChin ESChinese Ed Ctr ESChinese Immersion ESClarendon ESClevel<strong>and</strong> ESCobb ESDrew CP AcdyEl Dorado ESFairmount ESFeinstein ESFlynn ESGarfield ESGlen Park ESGrattan ESGuadalupe ESHarte ESHillcrest ESJefferson ESKey ESKing ESLafayette ESLakeshore ESLau ESLongfellow ESMalcolm X Acdy ESMarshall ESMcCoppin ESMcKinley ESMilk ESMiraloma ESMission Ed Ctr ESMonroe ESMoscone ESMuir ESNew Traditions ESOrtega ESParker ESParks ESPeabody ESStudentSch# CountPg 2 of 5Ethnic Representation<strong>School</strong> <strong>Site</strong> <strong>List</strong> & <strong>Summary</strong> [ Version 1.0 ]CBEDS Information Day, October 6, 2010L OW AA C J K AI F ONW45% % % % % % % % % %DS%ELL**%413 514 - 6.6 17.1 1.6 49.6 3.3 0.6 0.2 2.9 12.3 5.8 29.0420 520 - 45.0 31.9 5.6 1.5 1.2 0.2 0.8 2.9 3.5 7.5 27.7435 423 8.3 24.3 3.1 43.0 2.6 0.5 -- 1.4 10.6 6.1 28.8456 240 - 89.2 0.4 2.1 -- -- -- 1.7 2.1 1.7 2.9 59.6461 393 - 69.7 17.3 5.3 -- -- -- 0.5 1.0 1.8 4.3 42.7625 282 - 5.7 0.7 72.3 -- -- -- 1.8 1.4 14.5 3.5 5.7603 471 - 85.8 0.4 3.0 0.8 -- -- 0.8 2.5 2.1 4.5 60.1872 257 - 1.9 4.7 1.9 80.2 0.8 0.8 -- 1.6 5.4 2.7 54.5476 76 -- -- -- 100.0 -- -- -- -- -- -- 36.8509 154 - 1.9 20.1 1.9 56.5 1.3 0.6 -- 3.2 7.8 6.5 7.1478 565 8.5 33.1 5.5 14.9 13.5 2.7 1.2 2.7 8.8 9.2 13.8481 335 - 73.4 1.5 5.4 5.7 0.3 -- 0.6 7.2 4.8 1.2 56.1525 182 - 15.4 7.7 56.6 1.6 -- 0.5 0.5 4.4 11.0 2.2 14.3507 270 - 10.0 0.7 77.8 0.4 -- -- 0.4 1.5 4.8 4.4 5.6521 297 29.6 4.0 35.0 5.1 -- -- 1.0 7.4 14.1 3.7 23.6537 368 - 67.1 16.6 4.9 0.5 0.3 0.3 0.8 1.6 2.2 5.7 39.4539 471 6.2 30.4 3.4 35.5 2.5 1.3 0.2 4.7 10.6 5.3 20.4680 482 - 52.5 19.3 16.2 0.2 0.4 -- 0.6 2.9 4.4 3.5 34.9562 231 - 3.5 11.7 7.4 58.4 -- -- 0.4 3.0 12.1 3.5 44.6575 341 - 49.9 6.2 19.1 6.2 -- -- 0.6 8.5 4.7 5.0 34.6589 381 - 11.3 53.8 9.7 5.8 4.2 1.3 0.8 0.8 5.2 7.1 7.3593 478 - 45.2 2.9 4.6 22.6 -- 0.2 0.6 14.0 6.9 2.9 47.7453 240 32.5 0.4 43.8 -- -- -- 1.7 2.1 16.7 2.9 25.4614 476 43.3 2.7 11.8 18.9 -- -- 0.4 8.4 11.3 3.2 48.1644 492 - 4.9 20.9 1.6 47.0 1.2 0.8 0.4 3.0 13.4 6.7 33.5544 526 - 4.6 14.8 2.9 52.9 2.3 1.7 0.4 3.8 13.5 3.2 29.3838 345 23.5 19.4 21.4 19.7 0.3 -- 0.6 2.6 7.0 5.5 23.8664 524 7.3 36.5 3.4 24.4 2.7 2.1 1.5 4.6 10.1 7.4 15.3670 554 11.2 12.8 16.8 32.9 1.1 2.3 0.9 5.6 11.0 5.4 24.0490 666 - 10.5 0.6 0.2 83.6 -- -- 0.3 0.8 2.1 2.0 58.4691 606 34.2 1.0 5.3 22.6 -- 0.2 0.3 28.5 4.1 3.8 42.9830 87 - 12.6 -- 56.3 -- -- -- -- 3.4 24.1 3.4 4.6714 239 - 81.2 8.4 2.9 -- -- -- 0.4 1.7 0.4 5.0 57.3549 257 - 10.1 9.3 6.2 47.1 0.4 0.8 0.4 2.3 17.1 6.2 40.5718 353 16.7 42.5 19.5 3.4 0.6 -- 1.1 2.8 5.1 8.2 12.5505 246 16.7 33.3 30.5 3.7 0.8 -- 2.4 1.6 5.3 5.7 10.2722 361 - 8.3 53.7 9.1 8.3 1.4 0.6 0.3 2.5 4.2 11.6 6.4724 72 97.2 -- -- -- -- -- -- -- 2.8 -- 56.9729 510 - 48.0 9.6 2.9 27.1 0.6 -- 0.4 3.5 2.9 4.9 52.5723 331 - 59.5 1.8 1.8 28.1 -- 0.6 0.6 1.5 3.3 2.7 53.8650 225 44.9 2.2 36.0 0.4 -- -- 0.4 5.8 5.8 4.4 33.3735 229 14.0 40.2 24.0 3.9 0.9 0.4 1.7 3.9 5.7 5.2 6.6746 288 13.9 14.2 19.1 28.8 0.3 -- 0.3 7.3 10.4 5.6 21.2638 272 - 4.0 2.6 4.0 82.0 0.4 0.4 -- 0.7 4.0 1.8 53.7786 395 16.5 10.9 37.7 1.3 11.6 0.5 0.8 4.8 11.1 4.8 19.7569 252 8.3 37.7 6.3 14.3 3.2 3.6 0.8 6.0 10.7 9.1 19.4<strong>SFUSD</strong>\RPA (10/20/10) V1.0 -- Note: Charter <strong>School</strong> student enrollment is subject to revision <strong>and</strong> /or may not yet be available (CALPADS, self-reporting).
<strong>San</strong> <strong>Francisco</strong>Unified <strong>School</strong> District<strong>School</strong>Elementary K-5 <strong>School</strong>sRedding ESSF Pub Montessori ES<strong>San</strong>chez ESSerra ESSheridan ESSherman ESSloat ESSpring Valley ESStevenson ESSunnyside ESSunset ESSutro ESTaylor ESTenderloin ESUlloa ESVis Valley ESWebster ESWest Portal ESYick Wo ESStudentSch# CountPg 3 of 5Ethnic Representation<strong>School</strong> <strong>Site</strong> <strong>List</strong> & <strong>Summary</strong> [ Version 1.0 ]CBEDS Information Day, October 6, 2010L OW AA C J K AI F ONW45% % % % % % % % % %DS%ELL**%790 328 28.4 6.1 5.8 13.4 -- 1.5 1.2 8.2 31.1 4.3 51.5814 56 16.1 42.9 23.2 5.4 1.8 -- -- 5.4 -- 5.4 12.5816 260 - 82.3 1.5 5.0 1.2 -- -- 1.9 0.8 4.2 3.1 62.7656 278 - 62.6 7.2 5.4 6.1 -- -- 1.8 5.8 5.8 5.4 45.7820 215 33.0 4.2 27.4 6.0 0.9 0.5 -- 13.5 10.7 3.7 33.5823 422 11.4 31.0 4.7 34.8 1.9 0.7 0.5 0.9 9.7 4.3 29.6488 381 8.1 24.7 7.6 34.6 0.5 2.4 0.5 5.5 10.0 6.0 26.8834 343 33.2 6.1 4.4 43.4 0.6 0.9 0.6 0.9 4.7 5.2 51.0782 473 - 1.5 5.3 2.7 70.6 1.1 0.2 -- 3.6 8.0 7.0 35.5842 319 24.1 28.5 12.2 10.7 -- 0.3 -- 11.3 6.6 6.3 15.7750 392 6.1 25.3 2.0 42.3 2.8 0.3 1.3 2.3 11.2 6.4 19.1848 247 - 3.2 11.3 2.0 66.0 0.8 0.8 -- 3.6 10.9 1.2 29.6513 652 - 25.8 0.9 3.5 52.5 -- -- -- 4.0 10.6 2.8 43.9859 362 34.0 3.6 12.7 7.5 -- -- 0.8 5.0 33.4 3.0 43.4862 500 - 2.6 6.2 2.6 69.0 0.6 0.4 0.2 3.6 11.0 3.8 36.2867 434 14.5 0.7 15.7 42.4 -- -- 1.4 8.8 13.8 2.8 47.7497 229 - 50.2 13.1 19.7 0.4 -- -- 2.2 1.3 10.0 3.1 35.4876 574 - 3.8 15.0 1.2 58.4 0.9 1.4 0.3 3.3 10.1 5.6 32.6801 264 4.2 25.0 5.3 44.3 1.1 0.4 0.4 1.9 10.6 6.8 31.1Middle <strong>School</strong>sAptos MSDenman MSEverett MS<strong>Francisco</strong> MSGiannini MSHoover MSKing MSLick MSMann MSMarina MSPresidio MSRoosevelt MSVis Valley MS431 1,024 29.7 13.2 6.4 28.5 0.3 0.3 0.8 8.2 6.9 5.7 20.6632 577 34.8 3.6 10.1 15.3 0.2 0.9 0.2 25.1 8.7 1.2 27.9529 341 - 58.7 4.1 22.9 0.9 0.9 -- 1.5 4.1 5.9 1.2 41.1546 570 - 12.8 3.7 13.0 58.2 0.2 -- 1.2 2.8 6.3 1.8 43.5404 1,179 - 9.1 9.3 5.6 51.6 1.0 0.4 0.3 4.4 12.6 5.6 13.1607 1,146 23.2 7.9 5.4 42.8 1.4 0.3 0.3 4.1 9.2 5.3 16.1710 531 19.8 0.8 20.9 33.7 -- -- 0.8 6.4 16.2 1.5 25.8634 571 - 65.5 12.6 7.4 1.4 0.5 0.2 0.9 1.6 3.3 6.7 31.7618 198 - 71.7 1.0 14.1 0.5 -- -- 2.0 3.0 6.1 1.5 38.9708 881 - 14.1 5.7 8.7 53.5 0.3 0.9 0.6 2.6 11.8 1.8 24.6778 1,171 7.9 18.0 4.4 41.2 3.1 1.1 0.6 2.2 13.0 8.4 10.0797 722 - 10.0 9.1 6.8 51.9 1.8 0.7 0.7 2.4 12.0 4.6 17.3868 257 16.3 1.6 23.7 26.1 -- -- 0.8 12.5 17.1 1.9 26.5<strong>SFUSD</strong>\RPA (10/20/10) V1.0 -- Note: Charter <strong>School</strong> student enrollment is subject to revision <strong>and</strong> /or may not yet be available (CALPADS, self-reporting).
<strong>San</strong> <strong>Francisco</strong>Unified <strong>School</strong> District<strong>School</strong>StudentSch# CountPg 4 of 5Ethnic Representation<strong>School</strong> <strong>Site</strong> <strong>List</strong> & <strong>Summary</strong> [ Version 1.0 ]CBEDS Information Day, October 6, 2010L OW AA C J K AI F ONW45% % % % % % % % % %DS%ELL**%High <strong>School</strong>sAcdy Arts & Sci HSAsawa SF HS of ArtsBalboa HSBurton HSDowntown HSGalileo HSIndependence HSJordan Sch Equity HSLincoln HSLowell HSMarshall HSMission HSO'Connell HSS.F International HSWallenberg HSWashington HSWells HS832 358 39.7 16.8 9.8 16.5 1.4 0.6 0.8 4.7 7.3 2.5 16.2815 639 13.5 42.3 7.0 17.5 2.3 0.8 0.5 3.6 7.7 4.9 2.8439 1,362 21.6 6.5 7.9 37.4 0.7 0.5 0.4 14.3 9.0 1.8 17.6764 749 25.6 0.8 15.1 24.2 0.1 -- 0.4 21.2 11.2 1.3 24.4742 262 - 49.2 0.8 28.2 3.4 -- -- 0.8 7.6 9.9 -- 34.4559 2,149 - 10.1 2.9 5.0 60.7 0.6 0.6 0.2 4.3 11.8 3.7 23.2466 319 40.1 11.9 25.1 4.7 0.3 -- -- 7.8 8.2 1.9 19.4757 240 - 53.3 2.1 27.5 3.3 -- -- 0.8 3.8 7.1 2.1 23.3405 2,124 - 18.8 4.0 6.3 50.8 0.8 0.7 0.4 5.8 9.9 2.6 25.3697 2,583 - 7.8 14.2 2.5 51.5 1.4 1.5 0.2 6.2 11.0 3.7 1.7853 788 19.8 0.6 20.8 39.0 -- 0.3 0.4 3.6 14.3 1.3 31.5725 867 44.5 6.0 15.9 19.3 0.3 0.7 0.3 4.3 8.2 0.5 37.8651 604 - 61.1 2.2 15.6 5.0 -- -- 1.2 7.5 6.3 1.3 36.3621 133 - 47.4 3.0 0.8 39.1 -- -- -- 3.8 4.5 1.5 68.4785 680 20.7 4.7 14.9 38.1 1.2 0.9 0.4 4.1 10.9 4.1 13.7571 2,307 - 10.8 6.7 5.2 53.5 2.0 1.4 0.2 4.1 13.8 2.3 19.1743 259 33.2 5.8 34.0 13.1 -- 0.4 0.4 3.5 8.9 0.8 23.9Alternatively Configured <strong>School</strong>sBrown CP Acdy 858 166 - 5.4 0.6 69.3 -- -- -- 1.2 1.2 18.7 3.6 7.8Carmichael ES 449 680 - 26.5 3.1 9.3 2.1 -- -- 1.0 46.9 7.8 3.4 36.8Intl Study Acdy HS 624 434 33.9 3.7 35.9 6.0 -- -- 1.6 9.7 8.3 0.9 21.2Lawton Alt K8676 613 - 4.4 6.9 3.8 57.4 1.1 1.8 0.3 3.4 12.1 8.8 24.3Lilienthal Alt K8 479 672 10.0 32.0 10.4 9.7 1.9 13.7 1.3 2.4 9.1 9.5 13.1Revere ES760 436 - 58.9 5.0 17.0 0.9 -- 0.2 1.4 6.2 6.0 4.4 42.9Rooftop Alt K8796 594 23.4 22.2 15.7 13.5 2.2 0.5 1.0 3.9 9.6 8.1 15.3S.F. Community ES 493 289 36.7 15.9 14.2 11.8 1.0 -- 1.0 11.1 5.2 3.1 30.4Yu Alt K8485 552 - 4.0 8.3 3.6 54.9 0.2 0.4 -- 2.2 14.3 12.1 19.2Charter <strong>School</strong>s -- [Enrollment subject to revision]City Arts & Tech HS 484 -- -- -- -- -- -- -- -- -- -- -- --Creative Arts809 253 -- -- -- -- -- -- -- -- -- -- --Five Keys Adult HS 552 -- -- -- -- -- -- -- -- -- -- -- --Five Keys Charter HS 543 -- -- -- -- -- -- -- -- -- -- -- --Five Keys Indpnd HS 551 -- -- -- -- -- -- -- -- -- -- -- --Gateway HS565 464 -- -- -- -- -- -- -- -- -- -- --KIPP Bayview Acdy 658 250 -- -- -- -- -- -- -- -- -- -- --KIPP S.F. Bay Acdy 657 332 -- -- -- -- -- -- -- -- -- -- --Leadership HS 678 248 -- -- -- -- -- -- -- -- -- -- --Life Learn Acdy HS 681 48 -- -- -- -- -- -- -- -- -- -- --Metro Art & Tech HS 720 -- -- -- -- -- -- -- -- -- -- -- --<strong>SFUSD</strong>\RPA (10/20/10) V1.0 -- Note: Charter <strong>School</strong> student enrollment is subject to revision <strong>and</strong> /or may not yet be available (CALPADS, self-reporting).
<strong>San</strong> <strong>Francisco</strong>Unified <strong>School</strong> District<strong>School</strong>StudentSch# CountPg 5 of 5Ethnic Representation<strong>School</strong> <strong>Site</strong> <strong>List</strong> & <strong>Summary</strong> [ Version 1.0 ]CBEDS Information Day, October 6, 2010L OW AA C J K AI F ONW45% % % % % % % % % %DS%ELL**%SFCOE <strong>School</strong>sCnty Civic Ctr SecondaryCnty Court WoodsideCnty Opportunity SchCnty Special EdCnty Non-<strong>Public</strong> Sch144 23.6 9.7 36.1 10.4 -- -- 0.7 4.9 11.8 2.8 23.6128 29.7 3.9 42.2 9.4 -- -- 2.3 0.8 9.4 2.3 14.862 - 59.7 3.2 33.9 -- -- -- -- 1.6 1.6 -- 29.035 37.1 14.3 28.6 2.9 2.9 -- -- 8.6 5.7 -- 22.9232 - 15.5 12.9 51.7 2.6 0.4 0.4 0.9 4.3 8.2 3.0 12.5<strong>SFUSD</strong>\RPA (10/20/10) V1.0 -- Note: Charter <strong>School</strong> student enrollment is subject to revision <strong>and</strong> /or may not yet be available (CALPADS, self-reporting).
<strong>San</strong> <strong>Francisco</strong> <strong>School</strong> <strong>Site</strong> <strong>List</strong> & <strong>Summary</strong> [ Version 1.0 ]Unified <strong>School</strong> District CBEDS Information Day, October 6, 2010ADDITIONAL INFORMATIONThere are 104 regular school sites <strong>and</strong> 11 charter schools in the <strong>SFUSD</strong> (<strong>School</strong> Operations Office).There are 5 “schools” that the <strong>School</strong> Operations Office has defined as being part of the<strong>San</strong> <strong>Francisco</strong> County Office of Education (SFCOE). The teaching sites (County programs,Instructional programs, etc.) with enrollment that comprise these SFCOE schools are listed below.CDS-CodeSFCOE: CAO= County <strong>School</strong>-- Opportunity 38-10389-3830395CCS= County <strong>School</strong>-- County Civic Center Secondary 38-10389-3830445CJC= County <strong>School</strong>-- Juvenile Court Woodside 38-10389-3830361CSE= County <strong>School</strong>-- Special Ed 38-10389-6069561CNP= County <strong>School</strong>-- Non-<strong>Public</strong> (Special Ed in Non-District <strong>School</strong>) 38-10389-0000001--------CPK= County Service-- Pre-Kgn (Special Ed), ………………..………. NoneCPP= County Service-- Private/ Parochial (Special Ed)………………. None-----------------------------------------------------------------------------------------------------------------------------------------------------------------------------------Program District SFCOE StudentNumber Description Grouping <strong>School</strong>s Count616 Hilltop CAO Cnty CAO 62482 Cnty Civic Center MS CCS Cnty CCS 9483 Cnty Civic Center HS CCS Cnty CCS 91486 Home Based Ed CCS Cnty CCS 44688 Log Cabin CJC Cnty CJC 0892 Woodside CJC Cnty CJC 128824 Sp Ed Home Hosp Cnty CSE 21864 UCSF Child Life SP Cnty CSE 0813 18-22 Mild/Mod Prg Cnty CSE 14--------829 Sp Ed Non-Pub Sch Cnty CNP 1Other Sp Ed Non-Pub Sch (Other) Cnty CNP 231-------------------------------------------------------------------------------------------------------------------------------825 Sp Ed Pre-Kgn [Not in Sch] Other CPK 0827 Sp Ed Priv/Parochial Other CPP 285Students with GRADE code “PK” at an <strong>SFUSD</strong> school (77 students) are considered part of <strong>School</strong># CPKCharter <strong>School</strong>s: Student enrollment data for the charter schools is subject to revision. Five charter schoolssubmit their student data directly to the California Dept of Education (CALPADS, self-reporting) ratherthan through <strong>SFUSD</strong>: the three Five Keys Charter schools, City Arts & Tech, <strong>and</strong> Metro Arts & Tech.Ethic RepresentationCode Ethnic Category codes usedL Latino (SS=Hispanic)OW Other WhiteAA African American (B=Black)C ChineseJ JapaneseK KoreanAI American IndianF FilipinoONW Other Non-White [also includes Arabic,Samoan, South-East Asian (SE & IC)]DS Declines to StateOther HeadingsCodeELLExplanationEnglish Language Learners[Limited (L) English Proficient ]** Pending (P) ELL not included in ELL counts45% Indicates a predominant Ethnic Category(-) means Equal or Greater than 45%<strong>SFUSD</strong>\RPA (10/20/10) V1.0 --- This report is based on District data on CBEDS Information Day.
<strong>San</strong> <strong>Francisco</strong>Unified <strong>School</strong> District<strong>School</strong>StudentSch# CountPg 1 of 5Ethnic Representation<strong>School</strong> <strong>Site</strong> <strong>List</strong> & <strong>Summary</strong> [ Version 2.1 ]CBEDS Information Day, October 7, 2009L OW AA C J K AI F ONW45% % % % % % % % % %<strong>SFUSD</strong> <strong>School</strong> <strong>Site</strong> <strong>Summary</strong> by Grade (No Charter <strong>School</strong>s)<strong>SFUSD</strong>- Grade: K<strong>SFUSD</strong>- Grade: 01<strong>SFUSD</strong>- Grade: 02<strong>SFUSD</strong>- Grade: 03<strong>SFUSD</strong>- Grade: 04<strong>SFUSD</strong>- Grade: 05<strong>SFUSD</strong>- Grade: 06<strong>SFUSD</strong>- Grade: 07<strong>SFUSD</strong>- Grade: 08<strong>SFUSD</strong>- Grade: 09<strong>SFUSD</strong>- Grade: 10<strong>SFUSD</strong>- Grade: 11<strong>SFUSD</strong>- Grade: 12<strong>SFUSD</strong>- Grade: 13<strong>SFUSD</strong>- Grade: UNOperational Level <strong>Summary</strong>Elem K-5 <strong>School</strong>sMiddle <strong>School</strong>sHigh <strong>School</strong>sAlt Config <strong>School</strong>sCharter <strong>School</strong>s<strong>SFUSD</strong> <strong>School</strong> <strong>Site</strong> Totals (104 <strong>School</strong>s)<strong>SFUSD</strong> <strong>School</strong> <strong>Site</strong>sDS%ELL**%4,736 25.1 16.2 9.9 27.0 1.3 0.9 0.7 4.7 8.2 5.8 10.04,502 25.6 15.5 11.2 24.5 1.4 0.9 0.4 4.7 9.3 6.4 48.94,144 26.0 14.2 12.3 26.0 1.1 0.9 0.6 5.4 8.4 5.3 46.54,041 25.2 12.6 11.4 26.3 1.3 0.7 0.8 6.1 7.9 7.5 45.24,009 25.4 10.5 11.4 29.6 1.1 0.7 0.7 5.3 9.5 5.5 35.93,691 23.9 10.6 10.9 30.1 0.9 0.5 0.7 6.5 9.9 5.9 33.23,510 22.2 8.5 11.3 35.0 0.9 0.5 0.7 5.7 10.5 4.6 23.13,604 22.1 8.3 10.2 35.0 0.9 0.7 0.5 6.2 11.3 4.9 21.63,715 21.5 7.8 10.1 38.5 0.8 0.6 0.5 5.2 10.8 4.3 23.04,376 22.0 7.6 11.8 35.3 1.0 0.7 0.5 6.5 9.8 4.8 22.84,536 21.8 6.9 11.2 39.3 0.8 0.7 0.4 6.8 10.7 1.4 22.04,016 21.5 7.6 9.6 39.6 1.0 1.1 0.3 6.4 11.1 1.8 20.94,081 17.4 9.3 8.7 42.8 1.1 0.9 0.4 6.5 11.3 1.7 19.130 20.0 20.0 10.0 26.7 -- -- -- 6.7 16.7 -- 40.01 -- -- 100.0 -- -- -- -- -- -- -- --22,467 25.8 13.4 11.2 27.9 1.2 0.5 0.6 4.7 8.9 5.8 37.19,400 22.4 7.8 9.5 38.8 0.9 0.4 0.5 5.0 10.6 4.2 23.616,692 20.5 7.9 9.9 39.8 1.0 0.9 0.4 6.5 10.8 2.5 21.14,433 21.2 12.1 15.0 19.5 0.8 2.4 0.8 11.0 9.8 7.3 24.52,787 27.8 12.3 20.5 4.2 0.3 0.1 0.7 2.8 5.1 26.1 12.752,992 23.1 10.6 10.8 32.9 1.1 0.8 0.6 5.8 9.9 4.6 28.6<strong>SFUSD</strong> Charter <strong>School</strong> Totals (11 <strong>School</strong>s) -- [Subject to revision]<strong>SFUSD</strong> Charter <strong>School</strong>s2,787 27.8 12.3 20.5 4.2 0.3 0.1 0.7 2.8 5.1 26.1 12.7SFCOE <strong>School</strong> <strong>Site</strong> TotalsSFCOE <strong>School</strong> <strong>Site</strong>s710 25.8 8.3 41.1 4.9 0.4 0.3 1.4 4.2 9.6 3.9 17.0<strong>SFUSD</strong>\RPA (12/30/09) V2.1 -- Note: Charter <strong>School</strong> student enrollment subject to revision.
<strong>San</strong> <strong>Francisco</strong>Unified <strong>School</strong> District<strong>School</strong>Elementary K-5 <strong>School</strong>sAlamo ESAlvarado ESArgonne ESBryant ESBuena Vista ESCarver ESChavez ESChin ESChinese Ed Ctr ESChinese Immersion ESClarendon ESClevel<strong>and</strong> ESCobb ESDrew CP AcdyEl Dorado ESFairmount ESFeinstein ESFlynn ESGarfield ESGlen Park ESGrattan ESGuadalupe ESHarte ESHillcrest ESJefferson ESKey ESKing ESLafayette ESLakeshore ESLau ESLongfellow ESMalcolm X Acdy ESMarshall ESMcCoppin ESMcKinley ESMilk ESMiraloma ESMission Ed Ctr ESMonroe ESMoscone ESMuir ESNew Traditions ESOrtega ESParker ESParks ESPeabody ESStudentSch# CountPg 2 of 5Ethnic Representation<strong>School</strong> <strong>Site</strong> <strong>List</strong> & <strong>Summary</strong> [ Version 2.1 ]CBEDS Information Day, October 7, 2009L OW AA C J K AI F ONW45% % % % % % % % % %DS%ELL**%413 528 - 5.9 17.8 0.9 46.8 3.6 0.9 0.4 3.0 11.7 8.9 28.6420 504 - 46.0 28.0 5.6 2.2 0.8 -- 0.8 2.2 4.6 9.9 30.8435 419 8.1 23.4 1.7 42.0 1.9 0.5 -- 1.9 9.8 10.7 30.3456 241 - 90.0 -- 3.3 -- -- -- 0.8 2.1 1.2 2.5 65.1461 375 - 65.9 18.1 6.4 0.3 -- -- 1.1 1.1 3.2 4.0 41.9625 283 - 6.0 0.7 69.6 0.4 -- -- 1.4 0.7 16.3 4.9 6.0603 495 - 86.7 -- 2.0 0.6 -- -- 0.8 2.4 2.8 4.6 61.4872 263 - 1.9 4.6 3.8 77.9 0.8 0.4 -- 1.1 5.3 4.2 65.8476 93 -- -- -- 100.0 -- -- -- -- -- -- 84.9509 84 -- 28.6 2.4 42.9 1.2 1.2 1.2 2.4 9.5 10.7 3.6478 566 7.6 33.4 5.1 14.0 12.0 3.2 1.2 3.2 9.4 11.0 12.4481 307 - 70.7 0.3 6.8 7.2 0.3 -- 1.0 6.8 5.2 1.6 58.0525 204 - 13.7 13.2 53.9 1.5 0.5 -- 0.5 4.9 7.8 3.9 14.7507 256 - 7.8 0.8 76.6 0.4 -- -- -- 1.2 7.0 6.3 5.9521 277 27.1 2.9 39.0 6.9 -- -- 1.1 6.5 12.6 4.0 24.2537 364 - 64.3 14.0 8.0 1.1 0.3 0.3 0.8 2.5 3.0 5.8 40.4539 434 6.2 30.4 2.8 33.6 2.5 1.2 0.9 4.8 10.6 6.9 22.6680 478 - 53.3 17.6 16.1 0.2 0.2 -- 0.8 3.1 4.2 4.4 34.7562 228 - 3.9 10.5 7.0 59.6 -- 0.9 -- 3.5 10.5 3.9 47.4575 329 - 48.6 6.4 17.3 5.2 -- -- 0.6 10.3 6.7 4.9 33.1589 358 - 12.3 49.7 12.8 5.3 3.4 0.6 0.3 0.8 6.1 8.7 10.1593 441 44.9 1.8 5.4 24.9 -- -- 0.5 13.8 6.1 2.5 50.6453 255 - 31.4 -- 46.7 -- -- -- 1.2 2.0 15.3 3.5 27.1614 494 43.5 2.8 13.0 17.4 -- -- 0.8 8.7 10.9 2.8 47.8644 493 - 4.5 17.6 1.4 50.5 1.4 0.6 0.2 2.2 13.2 8.3 35.5544 513 - 5.7 14.6 2.5 54.2 1.9 1.4 0.6 3.7 12.3 3.1 34.7838 329 24.6 16.1 22.5 17.6 0.3 -- 0.6 2.7 9.4 6.1 23.4664 499 6.2 33.7 2.2 26.5 3.0 1.8 2.0 4.2 11.2 9.2 19.0670 559 9.3 12.9 16.8 33.5 0.9 2.1 0.7 5.7 12.2 5.9 24.3490 670 - 11.3 0.3 -- 81.6 -- -- 0.3 1.0 2.8 2.5 61.9691 596 33.6 1.7 5.0 21.8 -- 0.2 0.2 28.2 5.5 3.9 45.6830 104 - 5.8 1.9 63.5 -- 1.0 -- -- -- 24.0 3.8 6.7714 240 - 78.8 8.8 2.5 -- -- -- 0.8 2.1 1.7 5.4 59.2549 265 - 7.2 8.7 7.2 49.8 -- 2.6 0.4 4.2 13.2 6.8 40.4718 315 19.4 35.6 19.4 3.8 0.6 -- 1.3 4.1 6.3 9.5 14.3505 228 19.7 29.8 31.6 3.9 0.9 -- 1.8 2.2 4.4 5.7 9.2722 362 - 9.1 51.1 8.3 8.6 1.1 0.6 -- 3.6 5.0 12.7 5.8724 99 100.0 -- -- -- -- -- -- -- -- -- 84.8729 491 - 48.5 8.1 2.9 26.3 0.6 -- 0.2 4.5 3.1 5.9 51.5723 340 - 57.6 1.5 2.4 30.0 -- 0.6 0.3 1.5 3.8 2.4 58.5650 247 44.9 4.0 34.4 0.4 -- -- 0.8 6.1 4.9 4.5 32.0735 182 11.5 33.5 27.5 4.9 1.6 -- 1.1 2.2 7.1 10.4 10.4746 260 15.0 11.9 22.3 27.3 0.4 1.2 0.4 7.7 9.2 4.6 25.0638 263 - 4.9 1.9 3.0 83.3 0.4 -- -- 0.8 2.7 3.0 57.0786 384 14.8 9.4 38.8 3.9 10.2 1.0 1.0 4.9 10.4 5.5 25.0569 244 8.6 30.7 7.4 17.6 4.5 3.3 1.6 4.5 11.5 10.2 24.2<strong>SFUSD</strong>\RPA (12/30/09) V2.1 -- Note: Charter <strong>School</strong> student enrollment subject to revision.
<strong>San</strong> <strong>Francisco</strong>Unified <strong>School</strong> District<strong>School</strong>Elementary K-5 <strong>School</strong>sRedding ES<strong>San</strong>chez ESSerra ESSheridan ESSherman ESSloat ESSpring Valley ESStevenson ESSunnyside ESSunset ESSutro ESTaylor ESTenderloin ESUlloa ESVis Valley ESWebster ESWest Portal ESYick Wo ESStudentSch# CountPg 3 of 5Ethnic Representation<strong>School</strong> <strong>Site</strong> <strong>List</strong> & <strong>Summary</strong> [ Version 2.1 ]CBEDS Information Day, October 7, 2009L OW AA C J K AI F ONW45% % % % % % % % % %DS%ELL**%790 329 27.1 7.6 4.3 16.1 -- 0.6 0.3 8.5 31.0 4.6 52.9816 268 - 82.5 1.9 4.1 0.7 -- -- 2.2 1.9 3.7 3.0 65.7656 267 - 65.2 3.7 6.7 6.0 -- -- 1.9 5.6 5.2 5.6 48.7820 214 32.2 4.7 27.6 5.6 0.5 -- 0.9 12.6 11.2 4.7 34.6823 424 10.4 28.3 5.2 35.8 2.6 0.5 0.5 0.5 10.4 5.9 37.3488 367 6.8 21.8 7.4 36.2 0.8 2.5 0.3 6.0 9.8 8.4 29.7834 327 - 33.0 4.6 3.7 45.9 0.3 -- 1.2 0.9 4.6 5.8 64.5782 462 - 1.3 5.6 2.4 68.4 0.9 0.2 0.2 3.9 8.0 9.1 36.8842 315 25.4 23.5 14.3 10.5 -- 0.6 1.0 12.7 4.8 7.3 19.0750 375 5.6 24.0 1.9 40.3 2.1 1.3 0.5 3.2 13.1 8.0 23.2848 238 - 5.5 10.9 2.1 66.4 0.4 0.8 -- 2.1 9.2 2.5 45.4513 639 - 26.8 0.5 3.3 51.5 -- -- -- 3.8 10.8 3.4 52.0859 354 31.6 3.4 13.3 9.6 -- -- 1.1 4.8 32.5 3.7 51.7862 508 - 2.8 6.7 2.6 66.9 1.0 0.2 0.2 3.5 11.6 4.5 48.8867 400 14.5 0.5 16.8 42.8 -- -- -- 11.0 11.8 2.8 47.8497 192 - 52.1 8.9 21.9 0.5 -- -- 1.0 1.0 9.9 4.7 34.9876 564 - 2.7 14.0 1.2 58.2 0.7 0.7 0.5 3.9 10.5 7.6 32.1801 265 4.5 25.3 4.5 42.6 1.1 -- 0.4 0.8 13.6 7.2 37.7Middle <strong>School</strong>sAptos MSDenman MSEverett MS<strong>Francisco</strong> MSGiannini MSHoover MSKing MSLick MSMann MSMarina MSPresidio MSRoosevelt MSVis Valley MS431 989 30.8 10.9 7.7 27.4 0.3 0.5 0.8 8.1 8.2 5.3 18.2632 565 32.4 3.2 10.4 17.3 0.2 0.4 0.2 21.6 13.1 1.2 27.8529 379 - 57.3 5.0 23.5 1.3 0.5 0.3 0.8 3.4 6.9 1.1 43.5546 640 - 13.1 3.3 11.3 58.9 -- -- 0.5 3.0 8.6 1.4 52.8404 1,193 - 9.0 8.8 5.1 52.3 1.1 0.5 0.5 5.0 12.3 5.4 13.0607 1,174 22.7 8.6 6.6 41.4 1.6 0.5 0.3 3.6 9.5 5.2 14.6710 532 20.7 0.9 19.4 35.3 -- -- 0.6 5.3 15.8 2.1 26.7634 593 - 66.1 12.0 7.9 0.8 0.7 0.2 0.7 1.2 2.9 7.6 37.4618 238 - 67.6 2.5 16.4 1.3 -- -- 0.4 2.5 7.6 1.7 38.2708 904 - 11.5 3.8 8.1 62.2 0.1 0.4 0.3 1.5 9.7 2.3 29.5778 1,187 6.2 16.4 6.2 43.4 2.8 0.8 0.5 2.5 13.1 8.0 9.5797 723 - 8.6 6.5 6.6 59.3 1.1 0.1 0.4 1.2 13.3 2.8 21.2868 283 12.7 0.7 25.4 29.3 -- -- 1.1 13.4 15.2 2.1 22.6<strong>SFUSD</strong>\RPA (12/30/09) V2.1 -- Note: Charter <strong>School</strong> student enrollment subject to revision.
<strong>San</strong> <strong>Francisco</strong>Unified <strong>School</strong> District<strong>School</strong>StudentSch# CountPg 4 of 5Ethnic Representation<strong>School</strong> <strong>Site</strong> <strong>List</strong> & <strong>Summary</strong> [ Version 2.1 ]CBEDS Information Day, October 7, 2009L OW AA C J K AI F ONW45% % % % % % % % % %DS%ELL**%High <strong>School</strong>sAcdy Arts & Sci HSBalboa HSBurton HSDowntown HSGalileo HSIndependence HSJordan Sch Equity HSLincoln HSLowell HSMarshall HSMission HSNewcomer HSO'Connell HSS.F International HSSch of the Arts HSWallenberg HSWashington HSWells HS832 339 35.7 15.9 13.0 18.9 1.2 0.6 0.3 4.7 6.8 2.9 16.2439 1,298 22.5 6.4 8.2 38.1 0.7 0.8 0.5 13.6 7.7 1.6 20.6764 820 24.1 1.6 15.5 24.0 0.1 -- 0.2 21.2 11.6 1.6 24.1742 246 - 46.7 2.0 28.9 2.8 -- -- 1.2 5.3 11.4 1.6 25.6559 2,092 - 10.4 3.1 5.4 60.9 0.6 0.5 0.2 4.3 11.2 3.4 22.7466 377 37.7 13.0 22.3 5.6 0.5 0.5 -- 6.6 10.9 2.9 19.6757 271 - 50.6 3.3 28.4 4.4 -- 0.4 1.1 4.8 5.9 1.1 22.1405 2,348 - 17.8 4.4 6.4 48.9 1.0 1.2 0.5 6.6 10.9 2.3 25.5697 2,593 - 7.3 14.6 2.4 52.0 1.5 1.3 0.2 6.4 11.1 3.2 1.7853 838 17.3 0.8 24.7 37.8 0.1 0.1 0.6 3.5 13.8 1.2 34.2725 880 - 45.5 7.4 16.8 16.6 0.2 0.6 0.6 4.1 6.7 1.6 43.8738 156 - 26.9 1.3 -- 57.7 -- 0.6 -- -- 13.5 -- 93.6651 623 - 70.1 1.9 10.8 3.2 -- -- 0.6 6.1 5.9 1.3 42.9621 60 - 51.7 1.7 1.7 33.3 -- -- -- 5.0 5.0 1.7 85.0815 594 15.0 40.9 7.9 16.0 2.4 0.8 1.2 3.5 7.9 4.4 3.5785 636 20.3 4.9 17.6 33.5 1.6 0.9 0.9 5.2 10.7 4.4 13.7571 2,286 - 10.5 8.1 6.2 50.0 2.1 1.5 0.2 4.0 15.2 2.1 17.1743 235 33.2 3.8 37.4 11.5 0.9 0.9 0.4 3.8 6.4 1.7 23.0Alternatively Configured <strong>School</strong>sBrown CP Acdy 858 181 - 4.4 0.6 72.9 -- -- -- 1.1 0.6 16.6 3.9 8.8Carmichael ES 449 653 - 24.2 3.5 9.3 1.7 -- 0.2 1.1 48.5 8.1 3.4 40.9Intl Study Acdy HS 624 479 32.8 5.0 35.1 6.9 -- -- 1.3 9.0 8.8 1.3 26.1Lawton Alt K8676 609 - 3.9 6.9 3.8 56.7 1.5 1.8 0.5 3.4 11.8 9.7 25.5Lilienthal Alt K8 479 670 10.3 32.1 10.1 9.6 1.6 13.4 1.2 2.2 9.6 9.9 11.2Revere ES760 419 - 58.7 4.5 17.4 1.0 -- -- 1.0 7.6 4.8 5.0 41.3Rooftop Alt K8796 585 25.0 20.7 14.5 14.2 1.9 0.2 0.9 3.4 9.4 9.9 15.4S.F. Community ES 493 287 38.0 15.3 13.6 12.9 0.7 -- 0.7 8.7 5.6 4.5 34.5Yu Alt K8485 550 - 4.4 8.7 3.1 52.5 0.4 0.5 -- 2.2 15.1 13.1 15.3Charter <strong>School</strong>sCity Arts & Tech HSCreative ArtsFive Keys Adult HSFive Keys Charter HSFive Keys Indpnd HSGateway HSKIPP Bayview AcdyKIPP S.F. Bay AcdyLeadership HSLife Learn Acdy HSMetro Art & Tech HS484 364 42.0 17.6 21.7 3.3 -- 0.3 1.1 3.8 7.4 2.7 15.4809 245 9.8 43.3 20.8 2.4 2.0 0.8 0.8 3.7 6.5 9.8 3.3552 157 -- -- -- -- -- -- -- -- -- 100.0 --543 235 -- -- -- -- -- -- -- -- -- 100.0 --551 228 -- -- -- -- -- -- -- -- -- 100.0 --565 462 29.2 26.4 15.4 13.0 0.6 -- 0.4 3.2 8.0 3.7 11.0658 236 - 13.6 1.3 62.3 3.4 -- 0.4 1.7 0.8 13.6 3.0 8.5657 336 - 54.2 3.9 26.8 3.9 0.3 -- 0.9 2.1 2.7 5.4 35.7678 261 - 53.6 2.3 23.4 5.0 -- -- 0.8 7.7 2.7 4.6 18.0681 62 - 59.7 6.5 22.6 -- -- -- 1.6 3.2 6.5 -- 32.3720 201 35.3 12.9 28.9 2.5 -- -- 0.5 5.0 5.5 9.5 15.9<strong>SFUSD</strong>\RPA (12/30/09) V2.1 -- Note: Charter <strong>School</strong> student enrollment subject to revision.
<strong>San</strong> <strong>Francisco</strong>Unified <strong>School</strong> District<strong>School</strong>StudentSch# CountPg 5 of 5Ethnic Representation<strong>School</strong> <strong>Site</strong> <strong>List</strong> & <strong>Summary</strong> [ Version 2.1 ]CBEDS Information Day, October 7, 2009L OW AA C J K AI F ONW45% % % % % % % % % %DS%ELL**%SFCOE <strong>School</strong>sCnty Civic Ctr SecCnty Court WoodsideCnty Non-<strong>Public</strong> SchCnty Opportunity SchCnty Special Ed235 29.8 8.1 34.9 6.4 0.4 0.4 1.3 4.3 11.5 3.0 18.3112 25.0 2.7 43.8 8.0 -- -- 0.9 6.3 10.7 2.7 19.6236 - 14.0 12.3 51.7 3.0 0.4 0.4 1.7 3.4 8.5 4.7 10.274 - 62.2 -- 28.4 -- -- -- 1.4 1.4 5.4 1.4 37.853 11.3 15.1 34.0 7.5 1.9 -- 1.9 7.5 9.4 11.3 7.5<strong>SFUSD</strong>\RPA (12/30/09) V2.1 -- Note: Charter <strong>School</strong> student enrollment subject to revision.
<strong>San</strong> <strong>Francisco</strong> <strong>School</strong> <strong>Site</strong> <strong>List</strong> & <strong>Summary</strong> [ Version 2.1 ]Unified <strong>School</strong> District CBEDS Information Day, October 7, 2009ADDITIONAL INFORMATIONThere are 104 regular school sites <strong>and</strong> 11 charter schools in the <strong>SFUSD</strong> (<strong>School</strong> Operations Office).There are 4 “schools” that the <strong>School</strong> Operations Office has defined as being part of the<strong>San</strong> <strong>Francisco</strong> County Office of Education (SFCOE). The teaching sites (County programs,Instructional programs, etc.) with enrollment that comprise these SFCOE schools are listed below.CDS-CodeSFCOE: CAO= County <strong>School</strong>-- Opportunity 38-10389-3830395CCS= County <strong>School</strong>-- County Civic Center Secondary 38-10389-3830445CJC= County <strong>School</strong>-- Juvenile Court Woodside 38-10389-3830361CSE= County <strong>School</strong>-- Special Ed 38-10389-6069561CNP= County <strong>School</strong>-- Non-<strong>Public</strong> (Special Ed in Non-District <strong>School</strong>) 38-10389-0000001CPK= County Service-- Pre-Kgn (Special Ed), ………….[CBEDS- Not Reported] NoneCPP= County Service-- Private/ Parochial (Special Ed), [CBEDS- Not Reported] None-----------------------------------------------------------------------------------------------------------------------------------------------------------------------------------Program District SFCOE StudentNumber Description Grouping <strong>School</strong>s Count616 Hilltop CAO Cnty CAO 74482 Cnty Civic Center MS CCS Cnty CCS 8483 Cnty Civic Center HS CCS Cnty CCS 188486 Home Based Ed CCS Cnty CCS 39688 Log Cabin CJC Cnty CJC 0892 Woodside CJC Cnty CJC 112824 Sp Ed Home Hosp Cnty CSE 32864 UCSF Child Life SP Cnty CSE 4813 18-22 Mild/Mod Prg Cnty CSE 17------------------------------------------829 Sp Ed Non-Pub Sch Cnty CNP 0Other Sp Ed Non-Pub Sch (Other) Cnty CNP 236-------------------------------------------------------------------------------------------------------------------------------825 Sp Ed Pre-Kgn [Not in Sch] Other CPK 609827 Sp Ed Priv/Parochial Other CPP 267Students with GRADE code “PK” at an <strong>SFUSD</strong> school (65 students) are considered part of <strong>School</strong># CPKCharter <strong>School</strong>s: The reporting of student enrollment at charter schools based on information in the StudentInformation System (SIS) on CBEDS Information Day was problematic this year: (1) not all charterschools had updated SIS to reflect their student enrollment [especially the three Five Keys Charterschools] <strong>and</strong> (2) two charter schools [City Arts & Tech <strong>and</strong> Metro Arts & Tech] had decided toindependently report their student data to the CDE [CALPADS]. Revised numbers are used in thisreport for the three Five Keys Charter <strong>School</strong>s.Ethic RepresentationCode Ethnic Category codes usedL Latino (SS=Hispanic)OW Other WhiteAA African American (B=Black)C ChineseJ JapaneseK KoreanAI American IndianF FilipinoONW Other Non-White [also includes Arabic,Samoan, South-East Asian (SE & IC)]DS Declines to StateOther HeadingsCodeELLExplanationEnglish Language Learners[Limited (L) English Proficient ]** Pending (P) ELL not included in ELL counts45% Indicates a predominant Ethnic Category(-) means Equal or Greater than 45%<strong>SFUSD</strong>\RPA (12/30/09) V2.1 --- This report is based on District data on CBEDS Information Day.
<strong>San</strong> <strong>Francisco</strong>Unified <strong>School</strong> District<strong>School</strong>StudentSch# Count<strong>School</strong> <strong>Site</strong> <strong>Summary</strong> by Grade<strong>SFUSD</strong>- Grade: K<strong>SFUSD</strong>- Grade: 01<strong>SFUSD</strong>- Grade: 02<strong>SFUSD</strong>- Grade: 03<strong>SFUSD</strong>- Grade: 04<strong>SFUSD</strong>- Grade: 05<strong>SFUSD</strong>- Grade: 06<strong>SFUSD</strong>- Grade: 07<strong>SFUSD</strong>- Grade: 08<strong>SFUSD</strong>- Grade: 09<strong>SFUSD</strong>- Grade: 10<strong>SFUSD</strong>- Grade: 11<strong>SFUSD</strong>- Grade: 12<strong>SFUSD</strong>- Grade: 13Operational Level <strong>Summary</strong>Elem K-5 <strong>School</strong>sMiddle <strong>School</strong>sHigh <strong>School</strong>sAlt Config <strong>School</strong>sPg 1 of 5<strong>SFUSD</strong> <strong>School</strong> <strong>Site</strong> Total (112 <strong>School</strong>s)<strong>School</strong> <strong>Site</strong> TotalEthnic Representation<strong>School</strong> <strong>Site</strong> <strong>List</strong> & <strong>Summary</strong> [ Version 1.0 ]CBEDS Information Day, October 1, 2008L OW AA C J K AI F ONW45% % % % % % % % % %DS%ELL%--- 4,458 25.4 15.8 11.1 24.1 1.3 0.9 0.4 4.8 9.2 7.0 3.9--- 4,215 25.8 14.7 12.7 25.2 1.0 0.9 0.6 5.1 8.2 5.7 42.7--- 4,053 25.2 12.2 12.3 25.7 1.4 0.7 0.8 5.9 7.8 7.9 43.2--- 4,095 26.1 10.9 11.2 28.6 1.1 0.9 0.8 5.4 9.3 5.9 46.9--- 3,828 24.5 10.8 11.7 28.2 1.0 0.6 0.9 6.3 9.9 6.0 42.8--- 3,912 23.4 9.0 12.7 31.4 1.0 0.5 0.7 5.4 10.7 5.2 34.8--- 3,756 22.7 8.2 11.8 33.0 0.9 0.7 0.4 5.9 11.3 5.2 28.1--- 3,842 21.3 7.7 12.3 36.3 0.8 0.7 0.6 5.1 10.7 4.6 24.9--- 3,987 22.1 7.9 13.1 32.3 1.0 0.8 0.5 5.9 10.1 6.4 22.9--- 5,415 24.8 7.3 13.5 33.8 0.8 0.7 0.6 6.4 10.5 1.7 23.3--- 4,746 23.1 8.2 13.1 35.0 1.0 0.9 0.4 6.1 10.2 2.0 21.0--- 4,985 19.2 9.7 14.0 35.8 0.8 0.8 0.6 6.2 10.0 2.9 18.4--- 3,972 17.6 9.1 9.9 41.1 0.7 0.8 0.5 6.3 11.3 2.7 16.8--- 8 12.5 -- 12.5 75.0 -- -- -- -- -- -- 62.5--- 21,663 25.7 12.0 11.7 28.2 1.2 0.5 0.7 4.8 9.2 6.0 36.5--- 9,670 22.2 7.5 9.6 37.7 1.0 0.5 0.5 5.4 10.6 5.1 27.1--- 18,742 21.2 8.6 12.3 36.7 0.9 0.8 0.5 6.2 10.5 2.3 20.0--- 5,197 21.4 12.4 20.2 16.4 0.8 2.0 0.7 9.0 9.9 7.3 22.1--- 55,272 23.2 10.1 12.3 31.6 1.0 0.8 0.6 5.8 9.9 4.7 27.9CBEDS Report Total+ <strong>School</strong> <strong>Site</strong> Total+ SFCOE <strong>School</strong> TotalCBEDS Report Total--- 55,272 23.2 10.1 12.3 31.6 1.0 0.8 0.6 5.8 9.9 4.7 27.9--- 844 24.4 8.6 44.5 5.9 0.4 0.2 0.9 3.6 6.5 4.9 14.6--- 56,116 23.2 10.1 12.8 31.3 1.0 0.8 0.6 5.7 9.9 4.7 27.7<strong>SFUSD</strong>\RPA (10/30/08) V1.0
<strong>San</strong> <strong>Francisco</strong>Unified <strong>School</strong> District<strong>School</strong>Elementary K-5 <strong>School</strong>sAlamo ESAlvarado ESArgonne ESBryant ESBuena Vista ESCarver ESChavez ESChin ESChinese Ed Ctr ESClarendon ESClevel<strong>and</strong> ESCobb ESDrew CP AcdyEl Dorado ESFairmount ESFeinstein ESFlynn ESGarfield ESGlen Park ESGrattan ESGuadalupe ESHarte ESHillcrest ESJefferson ESKey ESKing ESLafayette ESLakeshore ESLau ESLongfellow ESMalcolm X Acdy ESMarshall ESMcCoppin ESMcKinley ESMilk ESMiraloma ESMission Ed Ctr ESMonroe ESMoscone ESMuir ESNew Traditions ESOrtega ESParker ESParks ESPeabody ESRedding ESStudentSch# CountPg 2 of 5Ethnic Representation<strong>School</strong> <strong>Site</strong> <strong>List</strong> & <strong>Summary</strong> [ Version 1.0 ]CBEDS Information Day, October 1, 2008L OW AA C J K AI F ONW45% % % % % % % % % %DS%ELL%413 550 - 5.1 18.7 0.7 45.8 2.7 0.7 0.2 2.4 13.8 9.8 27.1420 485 - 46.4 26.0 7.2 2.3 0.4 -- 0.4 1.6 5.4 10.3 32.4435 406 6.9 22.4 3.0 42.9 1.7 0.7 -- 1.7 9.6 11.1 34.7456 230 - 87.4 0.4 3.0 0.4 -- -- 1.7 1.3 1.3 4.3 60.9461 372 - 64.8 17.7 6.5 0.3 0.3 -- 1.6 0.8 3.5 4.6 43.5625 268 - 5.2 1.1 68.3 0.4 -- -- 2.2 0.7 18.3 3.7 4.1603 461 - 85.9 0.4 2.4 0.2 -- -- 1.1 2.0 3.3 4.8 60.3872 252 - 2.0 2.8 5.2 79.4 0.4 -- -- 1.2 6.3 2.8 65.9476 64 -- -- -- 100.0 -- -- -- -- -- -- 89.1478 528 8.1 33.5 4.5 12.9 13.1 2.7 1.7 2.8 9.1 11.6 10.2481 295 - 67.1 0.3 5.1 8.1 -- -- 0.7 10.8 5.4 2.4 49.8525 181 - 12.2 5.5 60.2 1.1 0.6 -- 0.6 3.3 8.3 8.3 9.9507 269 - 6.3 2.6 77.0 0.4 -- -- 0.4 1.1 8.2 4.1 5.2521 275 22.9 3.3 36.0 9.5 -- -- 1.1 7.6 16.0 3.6 22.5537 356 - 65.4 12.4 7.9 0.8 0.3 0.3 0.6 2.8 3.4 6.2 38.5539 379 6.3 30.1 4.2 31.1 6.1 1.3 0.5 5.0 9.0 6.3 20.6680 454 - 54.8 14.3 18.3 -- 0.2 -- 0.7 3.3 5.3 3.1 37.2562 224 - 3.1 8.0 4.9 67.4 0.4 0.4 -- 4.5 7.1 4.0 46.0575 327 - 48.6 3.7 18.3 5.5 -- 0.3 0.6 10.7 6.7 5.5 30.6589 325 - 11.4 47.4 17.2 5.8 1.2 0.6 0.3 1.5 5.2 9.2 7.4593 434 44.5 1.4 6.2 26.7 -- -- 0.2 12.4 6.0 2.5 45.2453 261 - 27.2 0.4 50.6 -- -- -- 1.9 1.1 16.5 2.3 22.6614 494 42.5 3.6 14.0 15.2 -- -- 0.8 10.3 10.3 3.2 42.3644 479 - 4.2 15.9 1.3 53.7 1.0 0.4 0.2 2.5 12.3 8.6 31.7544 503 - 7.2 8.5 1.4 59.0 2.0 1.4 0.4 3.4 12.3 4.4 39.2838 290 29.0 13.4 21.7 15.2 0.3 -- 1.0 3.1 9.7 6.6 23.1664 464 5.2 32.8 2.4 27.4 2.8 2.2 2.4 3.9 11.4 9.7 22.2670 564 9.2 14.0 15.6 33.2 0.4 2.3 0.7 6.2 11.7 6.7 25.2490 667 - 11.8 0.6 -- 81.3 -- -- 0.3 1.5 2.4 2.1 60.3691 566 32.0 1.8 4.2 21.7 -- 0.2 0.2 30.4 6.0 3.5 45.9830 120 - 7.5 2.5 50.8 -- 0.8 -- 0.8 0.8 33.3 3.3 15.8714 232 - 78.0 6.5 3.0 -- -- -- 0.9 2.6 2.2 6.9 57.8549 250 - 6.4 10.4 5.2 55.2 -- 1.2 -- 4.4 11.2 6.0 47.2718 286 22.7 32.2 18.9 3.5 0.7 -- 2.1 4.5 5.6 9.8 13.6505 217 18.0 26.7 35.0 5.5 -- -- 1.4 1.4 7.4 4.6 7.8722 356 - 11.5 46.9 8.4 8.4 0.8 0.6 -- 3.7 5.9 13.8 5.6724 123 99.2 -- -- -- -- -- -- -- -- 0.8 85.4729 480 - 46.5 7.1 2.3 27.7 0.8 -- 0.4 5.0 3.8 6.5 51.5723 343 - 55.1 0.9 2.6 32.4 -- 0.6 0.3 1.2 4.7 2.3 55.7650 243 44.4 4.5 36.2 -- -- -- 0.8 5.8 2.5 5.8 28.4735 165 12.7 29.1 31.5 4.2 2.4 0.6 1.2 2.4 6.7 9.1 8.5746 254 13.4 9.1 28.7 24.0 1.2 0.8 -- 9.4 9.8 3.5 24.0638 257 - 8.9 2.3 3.1 79.0 0.4 -- 0.4 -- 3.1 2.7 66.5786 367 16.1 7.9 40.6 4.4 8.7 0.5 0.8 5.7 8.2 7.1 21.3569 235 10.2 24.3 8.9 21.3 4.7 3.0 1.3 3.8 13.6 8.9 23.4790 326 25.8 6.1 5.2 17.2 -- 0.9 0.3 9.2 31.0 4.3 52.8<strong>SFUSD</strong>\RPA (10/30/08) V1.0
<strong>San</strong> <strong>Francisco</strong>Unified <strong>School</strong> District<strong>School</strong>Elementary K-5 <strong>School</strong>s<strong>San</strong>chez ESSerra ESSheridan ESSherman ESSloat ESSpring Valley ESStevenson ESSunnyside ESSunset ESSutro ESTaylor ESTenderloin ESUlloa ESVis Valley ESWebster ESWest Portal ESYick Wo ESStudentSch# CountPg 3 of 5Ethnic Representation<strong>School</strong> <strong>Site</strong> <strong>List</strong> & <strong>Summary</strong> [ Version 1.0 ]CBEDS Information Day, October 1, 2008L OW AA C J K AI F ONW45% % % % % % % % % %DS%ELL%816 268 - 79.9 1.5 5.2 0.4 -- -- 3.0 1.5 4.5 4.1 56.3656 272 - 64.3 3.3 6.3 6.3 -- -- 1.5 5.9 6.3 6.3 41.9820 214 29.0 4.2 29.4 6.5 0.5 0.5 -- 15.0 8.9 6.1 26.2823 383 7.0 25.8 6.0 39.9 2.3 0.5 0.5 0.5 11.0 6.3 29.0488 355 8.7 18.0 6.2 36.6 1.1 2.3 -- 6.2 10.1 10.7 28.7834 346 34.1 3.8 4.9 44.8 0.3 -- 1.2 0.6 5.2 5.2 59.0782 437 - 1.6 7.1 3.0 65.4 0.9 0.2 0.2 4.6 8.2 8.7 33.4842 275 27.6 17.8 16.7 10.9 -- 1.5 1.1 9.1 8.4 6.9 21.1750 351 3.7 23.1 1.4 41.6 2.3 2.3 0.9 3.1 14.2 7.4 23.6848 245 - 4.1 10.6 1.6 67.3 -- 0.8 0.4 1.6 9.8 3.7 49.8513 633 - 26.9 0.3 4.6 50.6 -- -- -- 2.8 11.4 3.5 55.6859 357 29.7 3.6 12.9 11.8 -- -- 1.4 5.0 30.5 5.0 49.0862 497 - 3.8 6.6 3.8 64.4 1.0 0.4 0.2 4.2 11.1 4.4 45.7867 373 13.1 0.8 15.3 44.2 -- -- -- 11.3 11.5 3.8 49.6497 180 - 49.4 3.9 24.4 5.6 -- -- 0.6 -- 12.2 3.9 35.0876 552 - 3.1 14.3 1.6 56.7 0.5 0.4 0.4 3.3 11.1 8.7 34.8801 248 - 4.4 21.0 4.8 48.0 0.4 0.4 -- 0.4 11.7 8.9 37.9Middle <strong>School</strong>sAptos MSDenman MSEverett MS<strong>Francisco</strong> MSGiannini MSHoover MSKing MSLick MSMann MSMarina MSPresidio MSRoosevelt MSVis Valley MS431 988 26.3 11.4 8.7 29.0 0.5 0.6 0.8 8.6 9.1 4.9 20.3632 580 30.3 2.4 12.9 19.3 0.3 0.2 0.2 22.6 9.7 2.1 29.3529 429 - 58.0 3.0 19.3 3.5 0.5 0.5 1.2 6.3 7.0 0.7 49.4546 699 - 12.4 3.9 8.7 59.9 -- 0.1 0.3 3.7 8.0 2.9 57.1404 1,207 - 9.6 8.4 5.3 50.4 1.1 0.7 0.4 4.1 12.8 7.2 13.1607 1,206 21.9 10.3 6.7 35.1 2.6 0.6 0.2 4.0 11.0 7.6 17.2710 502 20.5 0.8 18.1 40.0 -- -- 0.4 5.0 13.1 2.0 33.1634 573 - 67.7 10.5 10.5 0.9 0.2 0.2 0.5 1.6 3.0 5.1 41.7618 332 - 68.4 1.5 15.7 0.9 -- 0.3 1.5 3.3 5.4 3.0 44.0708 942 - 11.7 3.4 8.1 60.8 0.3 0.5 0.2 2.3 8.5 4.1 33.2778 1,183 6.7 15.9 5.2 39.9 2.7 1.0 0.5 2.5 15.4 10.1 12.6797 723 - 7.5 4.7 6.9 61.7 0.7 0.4 0.3 1.9 12.9 3.0 24.9868 306 11.4 2.6 28.4 25.8 -- -- 0.3 13.4 16.7 1.3 24.8<strong>SFUSD</strong>\RPA (10/30/08) V1.0
<strong>San</strong> <strong>Francisco</strong>Unified <strong>School</strong> District<strong>School</strong>StudentSch# CountPg 4 of 5Ethnic Representation<strong>School</strong> <strong>Site</strong> <strong>List</strong> & <strong>Summary</strong> [ Version 1.0 ]CBEDS Information Day, October 1, 2008L OW AA C J K AI F ONW45% % % % % % % % % %DS%ELL%High <strong>School</strong>sBalboa HSBurton HSCity Arts & Tech HS~Downtown HSFive Keys Adult HS~Five Keys Charter HS~Five Keys Indpnd HS~Galileo HSGateway HS~Independence HSJordan Sch Equity HSLeadership HS~Life Learn Acdy HS~Lincoln HSLowell HSMarshall HSMetro Art & Tech HS~Mission HSNewcomer HSO'Connell HSSch of the Arts HSWallenberg HSWashington HSWells HS439 1,128 23.0 5.4 8.8 36.3 0.6 0.7 0.4 16.0 7.6 1.1 21.5764 939 26.7 0.4 16.0 27.6 0.2 -- 0.3 16.4 11.2 1.2 25.7484 354 33.3 18.4 21.2 5.9 0.8 0.3 1.4 3.7 8.8 6.2 10.5742 272 39.0 2.6 33.1 2.9 -- -- 1.1 6.6 12.9 1.8 22.4552 91 - 5.5 8.8 67.0 -- -- 1.1 -- 2.2 3.3 12.1 --543 324 - 17.3 13.0 60.8 -- -- -- 0.9 1.2 1.9 4.9 1.9551 136 16.2 11.0 31.6 7.4 -- 0.7 3.7 -- 2.2 27.2 2.2559 2,031 - 10.0 3.7 6.1 60.9 0.5 0.6 0.0 5.1 11.8 1.2 24.2565 476 26.1 26.9 15.8 13.0 0.8 -- 0.6 3.8 9.5 3.6 10.1466 352 35.5 14.5 22.2 4.8 0.6 0.6 1.1 7.1 11.1 2.6 16.2757 274 - 47.1 3.6 33.2 5.8 -- 0.4 0.7 3.6 4.7 0.7 16.1678 245 - 53.9 1.2 25.3 6.5 -- -- 0.4 6.9 3.7 2.0 18.0681 49 - 51.0 2.0 32.7 -- -- -- 4.1 2.0 6.1 2.0 22.4405 2,500 - 16.5 4.8 6.7 49.8 0.9 1.4 0.4 6.6 11.0 2.0 23.6697 2,638 - 7.0 14.1 2.9 52.1 1.6 1.1 0.2 6.1 12.3 2.7 2.0853 713 16.1 0.6 24.7 39.7 -- -- 0.7 4.3 13.5 0.4 34.1720 209 43.5 12.0 15.3 2.9 -- -- -- 3.8 5.3 17.2 15.3725 859 - 45.6 5.7 19.4 13.7 0.2 0.5 0.7 5.2 7.7 1.2 45.9738 246 - 30.9 1.2 0.4 52.8 0.4 0.8 -- 2.8 10.2 0.4 95.1651 666 - 74.0 2.0 11.1 3.0 -- 0.2 0.5 4.7 3.9 0.8 44.0815 965 21.5 30.3 11.8 15.5 1.2 1.6 1.5 4.2 8.0 4.5 7.9785 637 21.0 5.7 18.4 33.8 1.3 0.6 1.3 4.2 12.1 1.7 17.1571 2,400 - 9.7 8.6 6.1 51.8 1.8 1.4 0.2 4.1 14.8 1.5 16.1743 238 31.9 5.5 29.8 16.8 0.8 1.3 0.8 4.2 8.0 0.8 24.4Alternatively Configured <strong>School</strong>sBrown CP Acdy 858 221 - 3.2 0.9 72.4 -- -- -- 1.4 0.5 17.6 4.1 9.0Carmichael ES 449 583 - 22.1 3.9 10.1 1.5 -- 0.2 1.0 50.4 8.1 2.6 43.4Creative Arts~809 231 - 9.5 45.0 16.0 3.5 1.7 1.3 0.9 3.0 6.9 12.1 2.6Intl Study Acdy HS 624 531 32.0 5.1 39.4 5.8 -- 0.2 1.1 6.6 8.7 1.1 23.7KIPP Bayview Acdy~ 658 245 - 12.7 0.8 67.3 2.4 -- 0.4 -- 0.8 12.2 3.3 11.0KIPP S.F. Bay Acdy~ 657 316 - 49.4 3.2 30.4 3.5 -- -- -- 2.2 3.8 7.6 29.4Lawton Alt K8676 598 - 3.7 6.9 3.3 55.2 1.5 1.8 0.5 3.2 13.2 10.7 25.4Lilienthal Alt K8 479 662 10.9 31.4 12.1 10.0 1.7 12.2 1.2 2.0 9.5 9.1 8.5Revere ES760 413 - 56.9 3.4 20.1 0.5 -- -- 1.0 8.2 4.6 5.3 36.1Rooftop Alt K8796 578 23.0 21.5 14.5 13.5 2.1 0.3 0.7 4.2 9.7 10.6 17.1S.F. Community ES 493 275 40.4 12.7 12.7 14.9 0.7 -- 0.4 7.6 6.5 4.0 34.2Yu Alt K8485 544 - 4.6 10.3 3.7 49.3 0.6 0.6 -- 2.0 16.2 12.9 13.1<strong>SFUSD</strong>\RPA (10/30/08) V1.0
<strong>San</strong> <strong>Francisco</strong>Unified <strong>School</strong> District<strong>School</strong>StudentSch# CountPg 5 of 5Ethnic Representation<strong>School</strong> <strong>Site</strong> <strong>List</strong> & <strong>Summary</strong> [ Version 1.0 ]CBEDS Information Day, October 1, 2008L OW AA C J K AI F ONW45% % % % % % % % % %DS%ELL%SFCOE <strong>School</strong>sCnty Alt/Opp SchCnty Community SchCnty Juv Court SchCnty Non-<strong>Public</strong> SchCnty Special Ed--- 88 - 54.5 2.3 35.2 -- -- -- -- 1.1 4.5 2.3 26.1--- 246 24.4 8.9 38.6 6.9 0.4 0.4 1.2 6.5 9.3 3.3 19.5--- 210 - 26.2 1.9 51.0 7.1 -- -- 1.0 2.9 6.2 3.8 16.2--- 249 - 13.7 14.1 51.8 5.2 0.4 0.4 1.2 1.2 4.4 7.6 5.2--- 51 17.6 19.6 27.5 9.8 2.0 -- -- 7.8 7.8 7.8 9.8SFCOE (Other Programs)Cnty-Private/Paroch --- 245 21.6 36.7 7.8 9.4 0.4 -- 0.8 3.3 12.7 7.3 6.9Cnty-SpEd. Pre-Kgn --- 396 35.9 14.6 7.1 16.2 3.3 1.0 -- 1.8 12.1 8.1 2.0<strong>SFUSD</strong>\RPA (10/30/08) V1.0
<strong>San</strong> <strong>Francisco</strong> <strong>School</strong> <strong>Site</strong> <strong>List</strong> & <strong>Summary</strong> [ Version 1.0 ]Unified <strong>School</strong> District CBEDS Information Day, October 1, 2008ADDITIONAL INFORMATIONThere are 112 school sites in the <strong>SFUSD</strong> as defined by the <strong>School</strong> Operations Office.There are 4 “schools” that the <strong>School</strong> Operations Office has defined as being part of the<strong>San</strong> <strong>Francisco</strong> County Office of Education (SFCOE). The teaching sites (County programs,Instructional programs, etc.) with enrollment that comprise these SFCOE schools are listed below.CDS-CodeSFCOE: CAO= County <strong>School</strong>-- Alternative/ Opportunity 38-10389-3830395CCS= County <strong>School</strong>-- County Community 38-10389-3830445CJC= County <strong>School</strong>-- Juvenile Court 38-10389-3830361CSE= County <strong>School</strong>-- Special Ed 38-10389-6069561CNP= County <strong>School</strong>-- Non-<strong>Public</strong> (Special Ed in Non-District <strong>School</strong>) 38-10389-0000001CPK= County Service-- Pre-Kgn (Special Ed), ………….[CBEDS- Not Reported] NoneCPP= County Service-- Private/ Parochial (Special Ed), [CBEDS- Not Reported] None------------------------------------------------------------------------------------------------------------------------------------------------------------------------------------Program District SFCOE StudentNumber Description Grouping <strong>School</strong>s Count616 Hilltop CAO Cnty CAO 88482 Cnty Community MS CCS Cnty CCS 8483 Cnty Community HS CCS Cnty CCS 198486 Home Based Ed CCS Cnty CCS 40688 Log Cabin CJC Cnty CJC 0892 Woodside CJC Cnty CJC 210824 Sp Ed Home Hosp Cnty CSE 30864 UCSF Child Life SP Cnty CSE 6813 18-22 Mild/Mod Prg Cnty CSE 15------------------------------------------829 Sp Ed Non-Pub Sch Cnty CNP 6Other Sp Ed Non-Pub Sch (Other) Cnty CNP 243-------------------------------------------------------------------------------------------------------------------------------825 Sp Ed Pre-Kgn [Not in Sch] Other CPK 396827 Sp Ed Priv/Parochial Other CPP 245Students with GRADE code “PK” at an <strong>SFUSD</strong> school (60 students) are considered part of <strong>School</strong># CPKNote: There are two <strong>SFUSD</strong> programs that have their own District school number’s that are not officiallydefined as schools by the <strong>SFUSD</strong>, <strong>and</strong> these programs are reported as part of another school:Downtown HS (#742) has 270 students <strong>and</strong> from After Six HS (#407) add two students.<strong>School</strong> of the Arts (#815) has 626 students <strong>and</strong> from Academy of Arts & Science (#832) add 339 students.Charter <strong>School</strong>s: There are 11 charter schools in the <strong>SFUSD</strong> with 2,676 students.Ethic RepresentationCode Ethnic Category codes usedL Latino (SS=Hispanic)OW Other WhiteAA African American (B=Black)C ChineseJ JapaneseK KoreanAI American IndianF FilipinoONW Other Non-White [also includes Arabic,Samoan, South-East Asian (SE & IC)]DS Declines to StateOther HeadingsCodeELLExplanationEnglish Language Learners--- Previously known as:Non English Proficient (NEP) orLimited English Proficient (LEP)45% Indicates a predominant Ethnic Category(-) means Equal or Greater than 45%<strong>SFUSD</strong>\RPA (10/30/08) V1.0a --- This report is based on District data on CBEDS Information Day.
<strong>San</strong> <strong>Francisco</strong>Unified <strong>School</strong> District<strong>School</strong>StudentSch# Count<strong>School</strong> <strong>Site</strong> <strong>Summary</strong> by GradePg 1 of 545%Ethnic Representation<strong>School</strong> <strong>Site</strong> <strong>List</strong> & <strong>Summary</strong> [ Version 4.0 ]CBEDS Information Day, October 3, 2007L OW AA C J K AI F ONW% % % % % % % % %<strong>SFUSD</strong>- Grade K --- 4,209 26.1 15.2 12.5 24.5 1.0 0.9 0.7 4.8 8.1 6.3 9.5<strong>SFUSD</strong>- Grade 01 --- 4,074 25.4 12.4 12.6 24.8 1.4 0.7 0.8 5.6 7.9 8.4 40.7<strong>SFUSD</strong>- Grade 02 --- 4,115 25.9 10.8 11.3 28.0 1.1 0.8 0.8 5.4 9.4 6.6 45.0<strong>SFUSD</strong>- Grade 03 --- 3,869 24.6 10.9 12.4 27.2 1.0 0.6 1.0 6.4 9.7 6.3 46.2<strong>SFUSD</strong>- Grade 04 --- 3,900 23.7 9.0 12.5 31.0 1.1 0.5 0.7 5.2 10.9 5.4 35.5<strong>SFUSD</strong>- Grade 05 --- 4,003 23.9 9.0 11.5 30.1 0.9 0.7 0.5 5.8 11.4 6.0 32.2<strong>SFUSD</strong>- Grade 06 --- 3,866 21.7 7.8 13.2 34.7 0.9 0.6 0.5 5.0 10.4 5.0 25.8<strong>SFUSD</strong>- Grade 07 --- 3,986 22.2 8.0 13.8 30.8 1.0 0.8 0.6 6.2 10.3 6.5 21.9<strong>SFUSD</strong>- Grade 08 --- 4,017 22.0 7.7 13.1 37.0 0.8 0.7 0.5 5.9 11.0 1.2 20.1<strong>SFUSD</strong>- Grade 09 --- 5,527 26.1 7.4 14.5 31.0 0.8 0.8 0.5 6.2 10.4 2.3 22.2<strong>SFUSD</strong>- Grade 10 --- 5,225 21.1 8.8 12.2 35.8 0.9 0.8 0.4 6.2 10.9 2.9 19.5<strong>SFUSD</strong>- Grade 11 --- 4,449 19.3 9.2 12.8 36.3 0.8 0.7 0.6 6.8 10.5 2.9 14.8<strong>SFUSD</strong>- Grade 12 --- 3,840 15.4 9.9 8.7 42.3 1.0 1.0 0.5 6.4 11.0 3.8 16.4<strong>SFUSD</strong>- Grade UN --- 11 18.2 -- 18.2 63.6 -- -- -- -- -- -- 54.5Operational Level <strong>Summary</strong>Elem K-5 <strong>School</strong>s --- 21,240 25.4 10.9 11.9 28.9 1.1 0.5 0.8 4.8 9.4 6.2 36.0Middle <strong>School</strong>s --- 10,131 22.6 7.2 11.2 37.2 1.0 0.5 0.5 5.3 10.5 4.0 24.4High <strong>School</strong>s --- 19,051 21.0 8.7 12.3 35.9 0.8 0.8 0.5 6.4 10.7 2.9 18.6Alt Config <strong>School</strong>s --- 4,669 20.1 13.1 18.1 17.3 0.8 2.0 0.9 9.7 10.5 7.5 20.0<strong>SFUSD</strong> <strong>School</strong> <strong>Site</strong> Total (111 <strong>School</strong>s)<strong>School</strong> <strong>Site</strong> Total --- 55,091 22.9 9.6 12.4 31.9 1.0 0.8 0.6 5.9 10.2 4.8 26.5CBEDS Report Total+ <strong>School</strong> <strong>Site</strong> Total --- 55,091 22.9 9.6 12.4 31.9 1.0 0.8 0.6 5.9 10.2 4.8 26.5+ SFCOE <strong>School</strong> Total --- 597 26.5 20.4 29.8 6.0 0.3 0.2 1.3 2.5 7.9 5.0 13.4CBEDS Report Total --- 55,688 23.0 9.8 12.6 31.6 1.0 0.8 0.6 5.8 10.1 4.8 26.3DS%ELL%<strong>SFUSD</strong>\RPA (12/31/07) V4.0
<strong>San</strong> <strong>Francisco</strong>Unified <strong>School</strong> District<strong>School</strong>Elementary K-5 <strong>School</strong>sStudentSch# CountPg 2 of 545%Ethnic Representation<strong>School</strong> <strong>Site</strong> <strong>List</strong> & <strong>Summary</strong> [ Version 4.0 ]CBEDS Information Day, October 3, 2007L OW AA C J K AI F ONW% % % % % % % % %Alamo ES 413 583 4.8 18.7 1.0 44.4 3.4 1.0 0.2 2.6 13.7 10.1 24.9Alvarado ES 420 480 - 46.9 23.5 6.9 2.3 0.4 -- 0.8 2.3 5.4 11.5 31.0Argonne ES 435 407 6.1 23.1 3.2 42.0 1.5 1.2 -- 1.2 10.6 11.1 32.4Bryant ES 456 233 - 85.8 1.3 3.9 1.3 -- -- 1.7 0.9 1.3 3.9 58.8Buena Vista ES 461 383 - 64.5 14.4 7.8 0.3 0.3 -- 1.6 0.5 4.7 6.0 44.1Carver ES 625 254 - 3.1 -- 73.2 0.4 -- -- 2.8 2.0 14.2 4.3 3.1Chavez ES 603 442 - 85.7 0.7 2.5 0.7 -- -- 1.4 2.3 2.0 4.8 59.5Chin ES 872 245 - 2.0 3.3 5.3 75.9 -- 0.4 -- 1.2 7.3 4.5 65.7Chinese Ed Ctr ES 476 92 -- -- -- 100.0 -- -- -- -- -- -- 83.7Clarendon ES 478 534 8.1 32.0 5.1 11.6 12.5 2.1 1.9 3.2 9.7 13.9 13.1Clevel<strong>and</strong> ES 481 305 - 61.0 1.0 6.9 6.9 -- -- 0.3 11.8 8.2 3.9 44.6Cobb ES 525 167 - 8.4 1.8 68.3 1.2 -- -- 0.6 1.8 10.8 7.2 9.0Drew CP Acdy 507 254 - 6.3 1.6 78.7 0.4 -- -- 0.8 0.8 8.3 3.1 3.9El Dorado ES 521 272 18.0 2.6 36.0 11.8 -- -- 0.7 11.0 15.4 4.4 17.3Fairmount ES 537 353 - 64.3 10.2 7.9 1.1 0.3 -- 0.6 4.2 4.0 7.4 39.9Feinstein ES 539 303 7.6 26.1 3.3 33.0 8.9 1.0 0.3 4.3 7.3 8.3 16.8Flynn ES 680 441 - 56.0 11.1 18.6 -- -- -- 0.9 2.7 5.7 5.0 39.7Garfield ES 562 214 - 4.7 8.4 4.7 66.8 0.5 0.5 0.5 3.7 6.5 3.7 51.4Glen Park ES 575 302 - 47.4 3.0 19.5 6.0 -- -- 0.7 10.9 7.0 5.6 30.8Grattan ES 589 287 12.2 41.8 19.5 4.9 1.7 0.3 0.7 1.7 7.0 10.1 8.4Guadalupe ES 593 429 43.6 1.4 6.8 28.4 -- -- 0.7 11.0 6.5 1.6 46.9Harte ES 453 258 - 28.7 0.8 48.4 -- -- -- 1.6 0.8 17.1 2.7 21.7Hillcrest ES 614 477 40.7 3.4 13.4 16.1 -- -- 0.4 9.9 11.3 4.8 40.7Jefferson ES 644 476 - 3.6 15.3 1.3 53.6 1.5 -- 0.2 2.7 13.2 8.6 29.4Key ES 544 490 - 5.1 8.4 1.6 58.8 1.4 1.2 0.4 3.9 14.1 5.1 43.3King ES 838 238 31.1 9.7 25.2 13.0 0.4 0.4 0.8 3.8 10.1 5.5 21.8Lafayette ES 664 450 4.0 32.7 2.9 29.6 1.8 2.0 2.7 3.6 12.0 8.9 22.7Lakeshore ES 670 575 9.0 13.7 13.7 33.9 0.5 2.8 0.9 5.7 11.5 8.2 24.9Lau ES 490 658 - 12.2 0.5 0.5 81.3 -- -- 0.5 1.2 2.1 1.8 70.1Longfellow ES 691 565 28.5 1.4 4.2 23.2 -- -- -- 33.3 6.7 2.7 41.1Malcolm X Acdy ES 830 109 - 7.3 0.9 56.9 -- -- -- 0.9 0.9 28.4 4.6 12.8Marshall ES 714 221 - 76.0 4.1 3.2 -- -- -- 0.9 3.6 4.1 8.1 57.0McCoppin ES 549 214 - 6.1 7.9 6.5 56.5 -- 1.9 -- 2.3 13.1 5.6 46.7McKinley ES 718 255 28.6 25.1 22.0 3.5 0.4 -- 2.0 3.5 5.9 9.0 12.2Milk ES 505 211 24.6 21.3 33.2 5.2 -- -- 1.9 1.4 8.1 4.3 9.0Miraloma ES 722 343 12.8 43.1 9.9 9.6 0.9 0.3 -- 4.1 6.1 13.1 6.7Mission Ed Ctr ES 724 124 98.4 -- -- 0.8 -- -- -- -- -- 0.8 21.0Monroe ES 729 481 - 45.9 5.4 2.7 29.3 0.8 -- 0.6 4.8 4.0 6.4 50.3Moscone ES 723 342 - 55.6 1.2 2.0 32.7 -- 0.3 0.3 1.2 4.7 2.0 58.5Muir ES 650 223 - 45.7 5.8 34.1 -- -- -- -- 5.8 4.0 4.5 30.9New Traditions ES 735 159 13.2 30.2 31.4 1.9 1.9 1.3 1.3 3.8 4.4 10.7 11.3Ortega ES 746 221 12.7 3.6 35.7 24.9 0.5 1.4 -- 7.7 9.0 4.5 22.2Parker ES 638 281 - 8.5 3.2 2.1 78.3 -- -- 0.4 0.4 3.6 3.6 63.3Parks ES 786 343 15.2 7.6 39.4 5.8 7.6 0.3 1.2 4.4 10.8 7.9 21.3Peabody ES 569 224 9.8 21.0 8.0 25.9 3.1 2.7 2.2 3.1 14.7 9.4 24.6Redding ES 790 322 23.0 7.1 6.2 19.9 -- 0.3 0.6 7.8 30.1 5.0 44.7DS%ELL%<strong>SFUSD</strong>\RPA (12/31/07) V4.0
<strong>San</strong> <strong>Francisco</strong>Unified <strong>School</strong> District<strong>School</strong>Elementary K-5 <strong>School</strong>sStudentSch# CountPg 3 of 545%Ethnic Representation<strong>School</strong> <strong>Site</strong> <strong>List</strong> & <strong>Summary</strong> [ Version 4.0 ]CBEDS Information Day, October 3, 2007L OW AA C J K AI F ONW% % % % % % % % %<strong>San</strong>chez ES 816 295 - 78.6 1.4 6.1 0.3 -- -- 3.1 1.7 4.7 4.1 54.6Serra ES 656 264 - 61.7 2.3 8.0 7.6 0.4 -- 1.5 4.9 7.2 6.4 36.7Sheridan ES 820 198 30.8 4.0 30.8 6.6 0.5 -- 1.5 13.6 6.1 6.1 26.3Sherman ES 823 373 8.3 23.6 5.4 42.6 2.1 0.8 0.5 0.8 9.4 6.4 33.5Sloat ES 488 360 10.3 15.8 7.2 37.8 0.3 1.7 0.3 7.8 10.6 8.3 25.8Spring Valley ES 834 341 - 34.0 3.2 6.2 45.5 0.3 -- 0.9 1.8 4.1 4.1 63.3Stevenson ES 782 438 - 1.4 8.0 3.4 62.3 0.9 0.7 0.2 5.0 10.3 7.8 30.8Sunnyside ES 842 273 23.4 15.8 16.8 16.8 1.5 1.1 0.4 10.3 8.4 5.5 17.6Sunset ES 750 333 5.7 21.3 1.8 39.9 2.1 1.8 0.9 3.9 16.2 6.3 23.7Sutro ES 848 245 - 2.4 11.8 2.0 64.1 -- 0.8 -- 2.0 13.5 3.3 49.8Taylor ES 513 647 - 26.4 0.6 5.3 50.2 -- -- -- 2.9 11.4 3.1 53.2Tenderloin ES 859 367 33.2 4.4 14.7 11.4 -- -- 1.4 4.4 26.2 4.4 49.0Ulloa ES 862 515 - 3.9 8.2 3.1 61.9 1.4 0.8 0.6 4.3 10.7 5.2 38.1Vis Valley ES 867 382 12.3 0.8 14.7 44.2 -- -- 0.5 9.7 13.1 4.7 49.5Webster ES 497 174 43.1 1.1 29.9 9.8 -- -- 2.3 -- 9.8 4.0 38.5West Portal ES 876 547 - 2.6 13.7 2.0 56.7 0.5 0.4 0.2 3.5 11.3 9.1 31.3Yick Wo ES 801 248 - 5.6 19.8 4.4 49.6 -- 0.4 -- -- 11.7 8.5 39.5Middle <strong>School</strong>sAptos MS 431 947 24.9 10.7 12.7 30.9 0.3 0.7 0.6 8.4 7.6 3.1 19.5Denman MS 632 576 29.0 2.1 16.0 19.3 0.7 0.2 0.2 22.7 8.3 1.6 23.3Everett MS 529 502 - 59.2 1.8 20.7 2.2 0.2 0.4 0.6 6.2 8.0 0.8 41.8Excelsior MS 409 198 32.8 0.5 39.9 4.0 -- 0.5 1.5 6.6 11.6 2.5 20.2<strong>Francisco</strong> MS 546 690 - 11.4 3.6 11.7 56.2 0.1 0.3 0.4 4.6 8.6 2.9 41.4Giannini MS 404 1,234 - 7.9 9.2 5.3 52.7 0.8 1.1 0.3 3.3 13.5 5.9 12.7Hoover MS 607 1,221 20.7 11.0 7.0 36.1 3.4 0.9 0.2 3.8 10.8 6.0 16.5King MS 710 526 22.8 0.8 18.8 40.1 -- -- 0.6 4.9 10.5 1.5 29.1Lick MS 634 551 - 64.8 11.8 12.7 0.5 0.2 -- 0.9 1.8 3.8 3.4 40.5Mann MS 618 433 - 77.4 2.3 9.7 1.6 -- -- 1.4 1.8 4.4 1.4 51.5Marina MS 708 1,000 - 11.4 2.9 8.5 61.5 0.7 0.5 0.2 2.3 8.2 3.8 29.9Presidio MS 778 1,219 6.2 15.1 5.9 42.5 2.2 0.8 0.5 2.9 15.7 8.2 10.7Roosevelt MS 797 723 - 7.7 4.8 7.9 59.3 0.3 0.1 0.1 2.6 14.5 2.5 21.2Vis Valley MS 868 311 12.9 1.3 25.4 27.3 -- -- 0.3 13.8 17.4 1.6 24.8DS%ELL%<strong>SFUSD</strong>\RPA (12/31/07) V4.0
<strong>San</strong> <strong>Francisco</strong>Unified <strong>School</strong> District<strong>School</strong>High <strong>School</strong>sStudentSch# CountPg 4 of 545%Ethnic Representation<strong>School</strong> <strong>Site</strong> <strong>List</strong> & <strong>Summary</strong> [ Version 4.0 ]CBEDS Information Day, October 3, 2007L OW AA C J K AI F ONW% % % % % % % % %Balboa HS 439 1,072 22.1 5.2 11.5 29.9 0.7 0.7 0.6 18.4 9.7 1.3 17.7Burton HS 764 1,032 27.3 0.5 15.7 28.2 0.1 -- 0.4 15.3 11.7 0.8 21.7City Arts& Tech HS 484 371 26.4 22.6 21.6 7.3 0.8 0.5 1.9 4.9 10.2 3.8 6.2Downtown HS 742 261 34.5 3.4 33.7 3.4 -- 0.4 1.1 5.7 15.7 1.9 19.2Five Keys Charter 543 237 - 20.3 14.8 60.3 -- -- -- 0.4 0.8 1.7 1.7 1.3Galileo HS 559 2,236 - 10.8 4.7 7.4 57.6 0.8 0.9 0.2 5.4 10.7 1.4 22.7Gateway HS 565 444 24.3 25.9 16.9 13.7 1.1 -- 0.5 3.6 10.6 3.4 9.0Independence HS 466 349 32.1 15.8 23.5 8.6 0.3 0.6 0.6 7.2 10.0 1.4 16.0Intl Study Acdy HS 624 325 31.4 4.0 35.1 12.0 0.3 1.2 0.9 6.2 7.1 1.8 25.2Jordan SchEquty HS 757 300 38.3 4.0 36.3 6.3 -- 1.3 1.0 4.7 5.7 2.3 12.3Leadership HS 678 247 - 49.8 1.6 22.7 11.3 0.4 -- 0.4 6.5 4.0 3.2 15.0Life Learn Acdy HS 681 54 27.8 9.3 44.4 -- -- -- -- 1.9 14.8 1.9 11.1Lincoln HS 405 2,460 - 13.5 5.4 7.0 51.1 0.9 1.5 0.5 6.1 11.8 2.3 23.9Lowell HS 697 2,646 - 7.1 14.3 2.8 52.4 1.5 1.2 0.1 5.9 11.6 3.1 1.7Marshall HS 853 637 15.7 0.5 20.6 40.2 -- -- 0.5 6.1 14.9 1.6 28.7Metro Art& Tech HS 720 345 29.6 8.4 11.3 2.0 -- -- 0.6 2.9 3.2 42.0 9.6Mission HS 725 924 - 49.1 5.8 16.2 12.4 0.2 0.2 0.4 6.2 7.8 1.5 42.1Newcomer HS 738 221 - 28.1 1.4 1.4 55.7 -- -- -- 2.3 9.5 1.8 44.8O'Connell HS 651 743 - 75.8 1.9 11.4 2.4 -- -- 0.7 4.0 2.6 1.2 38.9Sch of the Arts HS 815 884 18.8 33.0 12.1 13.3 1.5 1.4 1.7 4.2 8.6 5.4 5.9Wallenberg HS 785 644 20.3 5.9 17.4 33.4 1.1 0.9 0.9 4.7 12.6 2.8 20.2Washington HS 571 2,374 - 10.8 8.9 7.3 49.7 1.5 1.2 0.1 3.6 14.7 2.1 18.1Wells HS 743 245 29.8 4.1 28.2 18.4 1.2 0.8 1.2 4.1 10.2 2.0 18.0Alternatively Configured <strong>School</strong>sBrown CP Acdy 858 242 - 3.7 0.8 73.6 -- -- -- 2.1 1.7 16.5 1.7 5.8Carmichael ES 449 580 - 23.3 2.6 8.4 1.7 -- 0.2 0.7 52.4 7.6 3.1 38.3Creative Arts 809 234 12.4 44.9 11.5 3.0 1.7 0.9 0.9 3.4 8.1 13.2 1.7KIPP Bayview Acdy 658 222 - 9.9 1.4 67.1 2.7 -- 0.5 0.9 0.9 12.6 4.1 9.5KIPP S.F. Bay Acdy 657 285 41.4 3.5 36.1 3.2 -- -- 0.4 2.5 4.2 8.8 21.4Lawton Alt K8 676 587 - 4.1 7.0 3.1 55.2 1.4 1.7 0.7 3.2 13.5 10.2 26.1Lilienthal Alt K8 479 678 11.8 30.5 13.3 10.2 1.3 11.1 1.2 2.1 10.2 8.4 8.0Revere ES 760 428 - 54.9 2.6 22.4 0.5 -- -- 1.6 8.6 6.3 3.0 36.0Rooftop Alt K8 796 578 25.1 20.2 14.2 13.3 1.7 0.5 0.7 4.5 9.3 10.4 16.3S.F. Community ES 493 282 39.7 14.2 12.4 15.2 0.4 -- 1.1 7.1 6.7 3.2 35.1Yu Alt K8 485 553 - 5.6 11.0 3.6 47.0 0.9 0.5 -- 2.2 17.9 11.2 10.1DS%ELL%<strong>SFUSD</strong>\RPA (12/31/07) V4.0
<strong>San</strong> <strong>Francisco</strong>Unified <strong>School</strong> District<strong>School</strong>SFCOE <strong>School</strong>sStudentSch# CountPg 5 of 545%Ethnic Representation<strong>School</strong> <strong>Site</strong> <strong>List</strong> & <strong>Summary</strong> [ Version 4.0 ]CBEDS Information Day, October 3, 2007L OW AA C J K AI F ONW% % % % % % % % %Cnty Alt/Opp Sch --- 83 - 48.2 4.8 37.3 -- -- 1.2 2.4 1.2 4.8 -- 26.5Cnty Community Sch --- 178 - 20.8 11.2 47.2 3.9 -- -- 2.2 2.2 8.4 3.9 14.0Cnty Juv Court Sch --- 45 - 26.7 -- 51.1 6.7 -- -- -- 2.2 4.4 8.9 15.6Cnty Special Ed --- 291 23.7 33.7 13.7 8.9 0.7 -- 0.7 3.1 8.9 6.5 8.9SFCOE (Other Special Ed )- Non-<strong>Public</strong> <strong>School</strong>s <strong>and</strong> Special Education- Pre-KgnCnty Non-Pub Sch --- 302 - 11.6 14.2 53.6 3.6 0.3 0.3 1.3 1.0 4.6 9.3 4.6Cnty-SpEd. Pre-Kgn --- 325 35.7 19.1 10.8 18.8 0.3 0.6 -- 2.5 4.9 7.4 10.5DS%ELL%<strong>SFUSD</strong>\RPA (12/31/07) V4.0
<strong>San</strong> <strong>Francisco</strong> <strong>School</strong> <strong>Site</strong> <strong>List</strong> & <strong>Summary</strong> [ Version 4.0 ]Unified <strong>School</strong> District CBEDS Information Day, October 3, 2007ADDITIONAL INFORMATIONThere are 111 school sites in the <strong>SFUSD</strong> as defined by the <strong>School</strong> Operations Office.There are 4 “schools” that the <strong>School</strong> Operations Office has defined as being part of the<strong>San</strong> <strong>Francisco</strong> County Office of Education (SFCOE). The teaching sites (County programs,Instructional programs, etc.) with enrollment that comprise these SFCOE schools are listed below.CDS-CodeSFCOE: CAO= County <strong>School</strong>-- Alternative/ Opportunity 38-10389-3830395CCS= County <strong>School</strong>-- County Community 38-10389-3830445CJC= County <strong>School</strong>-- Juvenile Court 38-10389-3830361CSE= County <strong>School</strong>-- Special Ed 38-10389-6069561CNP= County Service-- Non-<strong>Public</strong> (Special Ed in Non-District <strong>School</strong>) 38-10389-0000001CPK= County Service-- Pre-Kgn (Special Ed), [CBEDS- Not Reported] None------------------------------------------------------------------------------------------------------------------------------------------------------------------------------------Program District SFCOE StudentNumber Description Grouping <strong>School</strong>s Count616 Hilltop CAO Cnty CAO 83482 Phoenix (MS) CCS Cnty CCS 8483 Phoenix (HS) CCS Cnty CCS 136486 Home Based Ed CCS Cnty CCS 34688 Log Cabin CJC Cnty CJC 27892 Woodside CJC Cnty CJC 18824 Sp Ed Home Hosp Cnty CSE 31827 Sp Ed Priv/Parochial Cnty CSE 224828 Sp Ed State Sp Sch Cnty CSE --864 UCSF Child Life SP Cnty CSE 9813 18-22 Mild/Mod Prg Cnty CSE 27-------------------------------------------------------------------------------------------------------------------------------829 Sp Ed Non-Pub Sch Non-Pub CNP 9Other Sp Ed Non-Pub Sch (Other) Non-Pub CNP 293-------------------------------------------------------------------------------------------------------------------------------825 Sp Ed Pre-Kgn [Not in Sch] Pre-K CPK 325Students with GRADE code “PK” at an <strong>SFUSD</strong> school (19 students) are considered part of <strong>School</strong># CPKNote: There are two <strong>SFUSD</strong> programs/schools that have their own District school number’s that are notofficially defined as schools by the <strong>SFUSD</strong> <strong>and</strong> the California Dept of Education, <strong>and</strong> theseprograms are reported as part of another school:Downtown HS (#742) has 260 students <strong>and</strong> from After Six HS (#407) add one student.<strong>School</strong> of the Arts (#815) has 634 students <strong>and</strong> from Academy of Arts & Science (#832) add 250 students.Charter <strong>School</strong>s: There are 9 charter schools in the <strong>SFUSD</strong> with 2,439 students.Ethic RepresentationCode Ethnic Category codes usedL Latino (SS=Hispanic)OW Other WhiteAA African American (B=Black)C ChineseJ JapaneseK KoreanAI American IndianF FilipinoONW Other Non-White [also includes Arabic,Samoan, South-East Asian (SE & IC)]DS Declines to StateOther HeadingsCode ExplanationELLEnglish Language Learners--- Previously known as:Non English Proficient (NEP) orLimited English Proficient (LEP)45% Indicates a predominant Ethnic Category(-) means Equal or Greater than 45%<strong>SFUSD</strong>\RPA (12/31/07) V4.0 (Reflects changes in reporting for the SFCOE)
<strong>San</strong> <strong>Francisco</strong>Unified <strong>School</strong> District<strong>School</strong>StudentSch# CountPg 1 of 5Ethnic Representation<strong>School</strong> <strong>Site</strong> <strong>List</strong> & <strong>Summary</strong>CBEDS Information Day, October 4, 2006L OW AA C J K AI F ONW45% % % % % % % % % %DS%NEP/LEP%<strong>School</strong> <strong>Site</strong> <strong>Summary</strong> by Grade<strong>SFUSD</strong>- Grade: K --- 4,067 25.2 12.4 12.6 23.8 1.5 0.7 1.0 5.5 7.9 9.5 3.5<strong>SFUSD</strong>- Grade: 01 --- 4,200 25.3 10.4 12.4 26.7 1.1 0.7 0.8 5.5 9.6 7.4 44.0<strong>SFUSD</strong>- Grade: 02 --- 3,902 24.6 11.2 13.1 25.9 1.1 0.4 1.0 5.9 9.9 6.9 46.4<strong>SFUSD</strong>- Grade: 03 --- 3,926 23.9 9.1 12.7 29.9 1.1 0.6 0.8 5.0 11.1 5.9 43.2<strong>SFUSD</strong>- Grade: 04 --- 3,969 24.0 9.4 11.8 29.1 0.9 0.8 0.5 5.5 11.8 6.2 37.0<strong>SFUSD</strong>- Grade: 05 --- 4,113 22.8 8.3 12.8 31.8 0.9 0.7 0.6 5.3 11.1 5.6 31.5<strong>SFUSD</strong>- Grade: 06 --- 3,942 22.3 8.3 14.6 29.2 1.0 0.8 0.6 5.8 10.5 6.8 25.1<strong>SFUSD</strong>- Grade: 07 --- 4,027 21.8 7.5 13.8 36.2 0.9 0.8 0.6 5.7 11.5 1.3 21.5<strong>SFUSD</strong>- Grade: 08 --- 3,983 22.9 8.2 13.3 33.5 0.9 1.0 0.3 5.9 12.3 1.6 21.0<strong>SFUSD</strong>- Grade: 09 --- 6,076 24.7 8.3 15.6 31.1 0.8 0.8 0.6 5.8 10.4 2.0 22.4<strong>SFUSD</strong>- Grade: 10 --- 5,210 21.2 8.5 14.5 33.7 0.7 0.8 0.6 6.2 11.3 2.5 17.2<strong>SFUSD</strong>- Grade: 11 --- 4,264 17.1 9.8 10.7 39.0 1.0 0.9 0.5 6.6 10.9 3.4 16.6<strong>SFUSD</strong>- Grade: 12 --- 3,806 15.0 9.6 9.2 44.5 1.0 1.1 0.3 6.4 10.8 2.1 16.2<strong>SFUSD</strong>- Grade: UN --- 12 8.3 -- 16.7 66.7 -- -- -- 8.3 -- -- 50.0Operational Level <strong>Summary</strong>Elem K-5 <strong>School</strong>s --- 21,299 24.9 9.8 12.3 29.2 1.1 0.4 0.8 4.8 10.1 6.6 35.6Middle <strong>School</strong>s --- 10,270 23.2 7.3 11.7 35.6 1.0 0.7 0.4 5.8 11.1 3.2 24.4High <strong>School</strong>s --- 19,340 20.2 8.9 12.9 36.2 0.8 0.9 0.5 6.2 10.8 2.5 18.5Alt Config <strong>School</strong>s --- 4,588 18.9 12.2 19.9 17.4 0.8 2.2 0.9 8.7 12.1 6.9 18.7<strong>SFUSD</strong> <strong>School</strong> <strong>Site</strong> Total (112 <strong>School</strong>s)<strong>School</strong> <strong>Site</strong> Total --- 55,497 22.4 9.3 13.0 31.9 1.0 0.8 0.6 5.8 10.7 4.6 26.2CBEDS Report Total+ <strong>School</strong> <strong>Site</strong> Total --- 55,497 22.4 9.3 13.0 31.9 1.0 0.8 0.6 5.8 10.7 4.6 26.2+ SFCOE <strong>School</strong> Total --- 962 20.0 18.7 37.6 5.0 0.3 0.3 1.4 2.4 7.9 6.4 11.3CBEDS Report total --- 56,459 22.4 9.4 13.4 31.4 0.9 0.8 0.6 5.7 10.6 4.6 25.9District/County Total (All Active Students)+ CBEDS Report total --- 56,459 22.4 9.4 13.4 31.4 0.9 0.8 0.6 5.7 10.6 4.6 25.9+ Other-Not Reported --- 477 30.2 19.1 12.4 17.2 0.4 -- 0.4 3.1 5.7 11.5 --District Total --- 56,936 22.5 9.5 13.4 31.3 0.9 0.8 0.6 5.7 10.6 4.7 --<strong>SFUSD</strong>\RPA (01/05/07) V1.1
<strong>San</strong> <strong>Francisco</strong>Unified <strong>School</strong> District<strong>School</strong>StudentSch# CountPg 2 of 5Ethnic Representation<strong>School</strong> <strong>Site</strong> <strong>List</strong> & <strong>Summary</strong>CBEDS Information Day, October 4, 2006L OW AA C J K AI F ONW45% % % % % % % % % %DS%NEP/LEP%Elementary K-5 <strong>School</strong>sAlamo ES 413 623 4.8 19.7 0.8 43.5 3.5 1.0 0.2 2.6 12.7 11.2 25.7Alvarado ES 420 488 - 49.6 22.5 5.9 1.8 0.8 -- 0.6 2.5 5.7 10.5 30.9Argonne ES 435 413 5.3 21.8 4.6 40.4 1.5 1.2 -- 1.7 10.9 12.6 30.5Bryant ES 456 233 - 85.0 0.9 3.4 3.4 -- -- 1.7 0.4 1.3 3.9 56.2Buena Vista ES 461 367 - 61.3 15.0 6.8 0.3 0.3 -- 1.9 0.5 5.2 8.7 43.3Carver ES 625 271 - 4.1 -- 69.0 0.4 -- -- 3.0 1.1 18.1 4.4 3.3Chavez ES 603 411 - 84.4 1.7 2.7 1.0 -- -- 1.9 1.9 1.7 4.6 59.6Chin ES 872 227 - 0.9 2.6 5.3 78.9 -- 0.4 -- 0.9 7.0 4.0 58.6Chinese Ed Ctr ES 476 99 -- -- -- 85.9 -- -- -- -- 1.0 13.1 51.5Clarendon ES 478 542 6.5 30.3 7.0 10.9 13.5 1.1 1.5 2.8 12.4 14.2 17.0Clevel<strong>and</strong> ES 481 311 - 55.6 1.3 9.3 7.1 -- -- 0.6 11.6 11.3 3.2 46.6Cobb ES 525 193 - 8.3 3.1 64.8 2.6 -- -- 1.6 2.1 9.3 8.3 9.3Drew CP Acdy 507 268 - 6.0 1.1 80.2 0.4 -- -- 0.7 0.4 6.3 4.9 2.6El Dorado ES 521 277 15.5 1.8 34.3 11.9 -- -- -- 13.7 17.7 5.1 22.4Fairmount ES 537 372 - 61.0 9.7 11.0 1.1 0.3 -- 0.8 3.2 5.6 7.3 38.4Feinstein ES 539 215 5.1 21.9 4.7 34.4 12.1 1.9 0.9 2.8 7.4 8.8 14.0Flynn ES 680 416 - 61.5 6.5 15.1 0.5 -- -- 1.2 3.1 6.5 5.5 37.7Garfield ES 562 231 - 4.3 5.6 6.1 69.3 -- -- 0.4 2.6 9.1 2.6 50.2Glen Park ES 575 299 - 45.8 4.0 18.4 7.4 -- -- 0.7 10.4 7.4 6.0 28.4Grattan ES 589 269 11.9 34.2 18.6 8.2 2.2 -- 0.7 2.2 8.9 13.0 11.2Guadalupe ES 593 419 39.4 1.7 6.7 28.9 -- -- 0.5 12.2 9.1 1.7 45.3Harte ES 453 262 31.3 -- 44.7 0.4 -- -- 1.1 1.1 17.9 3.4 22.1Hillcrest ES 614 460 38.0 3.5 13.9 16.5 -- -- 0.9 12.2 9.8 5.2 39.1Jefferson ES 644 476 - 3.4 15.8 1.3 52.7 1.5 -- 0.2 2.7 13.9 8.6 28.6Key ES 544 503 - 3.8 8.5 3.4 58.4 0.4 0.8 0.2 3.6 15.7 5.2 45.3King ES 838 186 33.9 5.9 26.9 8.1 0.5 0.5 1.1 4.3 14.0 4.8 19.4Lafayette ES 664 393 4.3 27.5 4.1 31.3 1.8 2.0 2.3 3.8 13.5 9.4 29.0Lakeshore ES 670 583 9.9 15.6 11.5 32.4 0.7 3.3 0.9 5.3 12.0 8.4 23.0Lau ES 490 672 - 12.5 0.4 0.4 80.8 -- -- 0.3 1.5 1.9 2.1 60.6Longfellow ES 691 554 29.1 1.4 2.9 25.1 -- -- -- 31.8 7.2 2.5 38.4Malcolm X Acdy ES 830 158 - 7.6 1.9 60.1 -- 0.6 -- 1.9 -- 21.5 6.3 10.1Marshall ES 714 214 - 73.8 3.7 3.7 -- -- -- 0.9 4.7 5.6 7.5 53.3McCoppin ES 549 243 - 6.2 8.2 7.4 51.4 -- 0.8 0.8 2.5 16.5 6.2 40.7McKinley ES 718 243 30.9 16.5 28.8 2.5 0.8 -- 1.6 2.9 7.0 9.1 12.3Milk ES 505 207 24.2 17.4 39.1 3.9 -- 0.5 2.9 1.0 5.8 5.3 9.7Miraloma ES 722 317 13.6 36.3 11.0 11.7 0.6 0.3 -- 4.4 7.6 14.5 10.1Mission Ed Ctr ES 724 156 98.1 -- 0.6 -- -- -- -- -- -- 1.3 53.8Monroe ES 729 471 43.3 5.3 3.0 31.2 0.6 -- 0.6 6.2 3.8 5.9 50.7Moscone ES 723 338 - 54.1 2.1 1.8 34.6 -- 0.3 -- 1.2 4.4 1.5 58.9Muir ES 650 271 42.1 3.3 34.7 0.4 -- -- 1.5 5.5 6.3 6.3 30.3New Traditions ES 735 190 12.6 32.1 32.6 1.6 2.6 -- 1.1 2.1 3.7 11.6 8.4Ortega ES 746 205 15.1 4.9 33.2 21.0 -- -- -- 8.3 10.7 6.8 24.9Parker ES 638 301 - 9.6 1.3 2.0 79.7 -- 0.3 0.3 0.7 3.0 3.0 62.5Parks ES 786 369 14.9 7.6 33.9 8.1 8.1 -- 0.8 3.8 13.0 9.8 20.1Peabody ES 569 209 10.5 15.3 6.7 33.5 1.4 2.4 1.4 2.4 18.2 8.1 29.7Redding ES 790 339 22.4 8.6 4.1 23.3 -- -- 0.6 6.8 28.9 5.3 45.7<strong>SFUSD</strong>\RPA (01/05/07) V1.1
<strong>San</strong> <strong>Francisco</strong>Unified <strong>School</strong> District<strong>School</strong>StudentSch# CountPg 3 of 5Ethnic Representation<strong>School</strong> <strong>Site</strong> <strong>List</strong> & <strong>Summary</strong>CBEDS Information Day, October 4, 2006L OW AA C J K AI F ONW45% % % % % % % % % %DS%NEP/LEP%Elementary K-5 <strong>School</strong>s<strong>San</strong>chez ES 816 270 - 78.1 1.5 7.0 -- -- -- 2.2 2.2 4.8 4.1 55.9Serra ES 656 261 - 59.0 1.5 9.2 10.0 0.4 -- 1.9 6.1 6.1 5.7 35.2Sheridan ES 820 198 24.7 2.5 31.3 7.6 0.5 -- 1.0 16.7 8.1 7.6 26.3Sherman ES 823 391 - 8.4 21.7 6.1 46.3 1.3 0.5 -- 0.8 8.4 6.4 38.6Sloat ES 488 358 11.2 13.4 7.8 39.7 0.3 1.7 0.3 5.9 10.6 9.2 24.3Spring Valley ES 834 347 - 32.9 2.9 5.8 46.7 -- -- 0.6 0.9 6.3 4.0 64.3Stevenson ES 782 436 - 1.6 6.9 3.4 61.0 0.7 0.5 0.2 4.8 12.6 8.3 31.9Sunnyside ES 842 271 25.1 14.8 14.8 18.8 -- -- -- 8.9 11.1 6.6 19.6Sunset ES 750 324 6.8 17.3 2.8 40.7 2.5 1.5 0.9 4.9 16.4 6.2 23.8Sutro ES 848 256 - 2.7 9.8 2.3 62.1 0.4 1.6 0.4 2.0 13.7 5.1 52.7Taylor ES 513 643 - 25.8 0.8 4.8 49.5 -- 0.2 -- 3.1 12.1 3.7 50.1Tenderloin ES 859 359 30.1 5.8 16.2 12.5 -- -- 1.4 5.0 25.3 3.6 47.9Ulloa ES 862 512 - 4.9 9.0 3.3 57.6 1.2 1.0 0.6 4.1 12.5 5.9 38.7Vis Valley ES 867 386 - 10.4 1.0 13.7 46.4 -- -- -- 10.9 13.5 4.1 45.9Webster ES 497 213 44.6 0.9 27.2 16.0 -- -- 1.4 -- 6.1 3.8 38.5West Portal ES 876 554 - 4.5 13.0 2.0 53.6 0.9 0.2 0.5 3.2 11.4 10.6 30.3Yick Wo ES 801 256 - 5.5 18.0 3.5 53.5 0.4 0.4 -- 0.4 10.9 7.4 37.9Middle <strong>School</strong>sAim High Acdy MS 409 238 24.8 2.9 41.2 4.6 -- 0.8 1.3 9.2 11.8 3.4 18.9Aptos MS 431 892 24.9 11.0 15.1 29.1 0.6 0.8 0.4 7.5 8.1 2.5 18.8Denman MS 632 573 32.5 1.2 14.8 17.8 0.5 0.2 0.3 24.4 7.2 1.0 24.3Everett MS 529 526 - 62.4 1.9 18.6 2.3 -- 0.4 0.8 5.7 6.3 1.7 47.9<strong>Francisco</strong> MS 546 647 - 12.8 3.2 11.4 51.8 0.3 0.3 0.2 8.0 8.8 3.1 45.6Giannini MS 404 1,270 - 8.6 7.9 4.5 53.9 0.9 1.7 0.2 3.2 14.5 4.6 14.0Hoover MS 607 1,246 18.5 13.7 6.2 37.3 3.5 1.1 0.2 3.8 11.4 4.3 12.8King MS 710 538 22.5 1.1 19.3 36.8 0.2 -- 0.9 6.7 11.2 1.3 25.3Lick MS 634 556 - 62.6 10.1 14.9 1.6 0.2 -- 1.1 3.1 5.0 1.4 34.9Mann MS 618 524 - 74.4 1.9 10.5 3.2 0.2 -- 0.8 2.5 5.0 1.5 46.9Marina MS 708 961 - 11.8 2.6 9.7 59.9 0.3 0.3 0.1 2.4 9.4 3.5 29.7Presidio MS 778 1,207 7.0 15.2 5.4 42.4 1.8 1.1 0.4 3.1 17.3 6.3 16.2Roosevelt MS 797 736 - 8.4 7.3 11.0 51.5 1.0 0.4 0.3 3.5 14.1 2.4 18.8Vis Valley MS 868 356 14.3 1.1 25.8 27.5 -- -- 0.8 11.5 18.0 0.8 21.9<strong>SFUSD</strong>\RPA (01/05/07) V1.1
<strong>San</strong> <strong>Francisco</strong>Unified <strong>School</strong> District<strong>School</strong>StudentSch# CountPg 4 of 5Ethnic Representation<strong>School</strong> <strong>Site</strong> <strong>List</strong> & <strong>Summary</strong>CBEDS Information Day, October 4, 2006L OW AA C J K AI F ONW45% % % % % % % % % %DS%NEP/LEP%High <strong>School</strong>sBalboa HS 439 1,098 21.0 5.0 12.8 31.6 0.5 0.9 0.5 16.4 9.8 1.4 20.5Burton HS 764 1,338 24.8 1.3 14.9 33.0 0.4 0.1 0.1 14.7 9.8 0.9 18.3City Arts& Tech HS 484 245 20.0 19.2 22.9 9.8 1.2 0.4 0.8 5.7 13.5 6.5 8.2Downtown HS 742 283 33.9 3.9 35.0 6.4 -- 0.4 2.1 6.0 10.2 2.1 19.8Downtown HS(CBEDS) --- 288 34.7 4.2 34.4 6.3 -- 0.3 2.1 5.9 10.1 2.1 20.8Five Keys Charter 543 347 - 15.9 15.6 55.6 0.3 -- -- -- 0.9 7.2 4.6 0.9Galileo HS 559 2,225 - 12.2 4.8 7.1 56.4 0.8 0.9 0.3 5.6 10.3 1.6 21.8Gateway HS 565 453 22.1 27.6 16.1 13.2 0.9 -- 0.7 3.8 11.7 4.0 5.5Independence HS 466 341 35.5 16.7 16.4 9.7 0.6 0.9 0.6 5.0 13.5 1.2 17.0Intl Study Acdy HS 624 421 29.0 3.8 34.7 13.3 0.5 0.7 1.4 4.8 9.7 2.1 25.2Jordan SchEquty HS 757 371 32.1 6.2 36.9 8.4 -- 0.3 1.6 5.1 6.2 3.2 12.7Leadership HS 678 331 44.7 4.2 19.9 10.6 0.3 -- 0.3 8.8 6.9 4.2 12.1Life Learn Acdy HS 681 63 23.8 7.9 44.4 3.2 -- -- 3.2 3.2 11.1 3.2 12.7Lincoln HS 405 2,343 - 11.1 6.3 7.4 52.1 1.0 1.6 0.5 5.4 12.4 2.2 20.1Lowell HS 697 2,671 - 6.5 15.1 3.0 52.0 1.6 1.4 0.2 5.8 11.1 3.4 1.2Marshall HS 853 652 - 14.0 0.8 18.6 46.2 0.3 -- 0.8 4.1 13.3 2.0 26.5Metro Art& Tech HS 720 195 - 49.7 7.2 17.4 3.6 -- -- 1.5 5.6 6.7 8.2 17.9Mission HS 725 864 44.8 6.5 17.5 14.5 0.1 0.7 0.2 5.0 8.7 2.1 41.4Newcomer HS 738 274 - 31.8 3.3 1.1 49.3 -- 0.4 -- 1.1 6.2 6.9 96.0O'Connell HS 651 819 - 74.7 3.2 11.1 2.7 -- -- 1.2 3.8 2.6 0.7 38.0Sch of the Arts HS 815 806 17.0 31.5 11.5 13.9 1.5 2.1 1.2 5.1 10.9 5.2 4.3Wallenberg HS 785 647 18.9 5.9 18.2 36.2 0.5 1.5 0.6 3.1 13.0 2.2 22.1Washington HS 571 2,306 - 9.8 9.8 7.9 48.7 1.5 1.1 0.2 3.9 15.1 2.0 17.8Wells HS 743 242 21.9 7.9 36.4 16.1 0.8 0.8 2.1 3.7 9.1 1.2 12.8Alternatively Configured <strong>School</strong>sBrown CP Acdy 858 139 - 5.8 -- 76.3 0.7 -- -- -- 2.2 12.2 2.9 8.6Carmichael ES 449 499 - 23.4 1.4 7.0 1.4 -- -- 1.2 52.1 10.0 3.4 41.5Creative Arts 809 220 11.8 41.4 15.5 1.8 1.4 0.9 0.9 3.6 10.5 12.3 1.8Davis CP Acdy 641 144 - 4.2 -- 70.1 0.7 -- -- 2.8 0.7 20.8 0.7 4.9KIPP Bayview Acdy 658 241 - 8.3 0.8 71.4 1.2 -- -- 0.8 0.4 12.9 4.1 3.7KIPP S.F. Bay Acdy 657 254 34.6 3.9 38.2 3.5 -- -- 0.4 4.3 5.5 9.4 15.4Lawton Alt K8 676 588 - 3.7 7.7 3.1 52.9 1.2 2.2 0.9 2.9 15.8 9.7 26.0Lilienthal Alt K8 479 701 12.4 28.0 14.3 10.0 1.4 11.1 1.3 1.7 12.1 7.7 10.1Revere ES 760 397 - 50.6 1.5 26.2 0.3 -- -- 1.3 10.3 6.5 3.3 32.7Rooftop Alt K8 796 577 25.5 19.2 14.7 14.4 1.9 0.5 0.5 3.5 11.1 8.7 14.7S.F. Community ES 493 281 40.2 11.4 14.9 14.9 -- -- 1.1 6.8 7.5 3.2 32.0Yu Alt K8 485 547 - 6.0 11.2 3.5 48.8 0.7 0.7 -- 1.3 18.3 9.5 9.1<strong>SFUSD</strong>\RPA (01/05/07) V1.1
<strong>San</strong> <strong>Francisco</strong>Unified <strong>School</strong> District<strong>School</strong>StudentSch# CountPg 5 of 5Ethnic Representation<strong>School</strong> <strong>Site</strong> <strong>List</strong> & <strong>Summary</strong>CBEDS Information Day, October 4, 2006L OW AA C J K AI F ONW45% % % % % % % % % %DS%NEP/LEP%SFCOE <strong>School</strong>s/ProgramsCnty Alt/Opp Sch --- 90 - 47.8 3.3 38.9 -- -- -- 2.2 4.4 3.3 -- 36.7Cnty Community Sch --- 242 - 14.9 9.1 53.3 2.9 -- -- 1.2 2.1 13.2 3.3 11.6Cnty Juv Court Sch --- 22 - 31.8 4.5 59.1 4.5 -- -- -- -- -- -- 22.7Cnty Special Ed --- 608 17.4 25.3 30.4 6.6 0.5 0.5 1.3 2.3 6.7 8.9 7.1<strong>SFUSD</strong>\RPA (01/05/07) V1.1
<strong>San</strong> <strong>Francisco</strong><strong>School</strong> <strong>Site</strong> <strong>List</strong> & <strong>Summary</strong>Unified <strong>School</strong> District CBEDS Information Day, October 4, 2006ADDITIONAL INFORMATIONThere are 112 school sites in the <strong>SFUSD</strong> as defined by the <strong>School</strong> Operations Office.There are 4 “schools” that the <strong>School</strong> Operations Office has defined as being part of the<strong>San</strong> <strong>Francisco</strong> County Office of Education (SFCOE). The teaching sites (County programs,Instructional Programs, etc.) that comprise these SFCOE schools are listed below.Program District SFCOE StudentNumber Description Grouping <strong>School</strong>s Count616 Hilltop CAO CD CAO 90482 Phoenix (MS) CCS CD CCS 12483 Phoenix (HS) CCS CD CCS 204486 Home Based Ed CCS CD CCS 26688 Log Cabin CJC CD CJC 22892 Woodside CJC CD CJC --824 Sp Ed Home Hosp CD CSE 27827 Sp Ed Priv/Parochial CD CSE 234828 Sp Ed State Sp Sch CD CSE --829 Sp Ed Non-Pub Sch CD CSE 302864 UCSF Child Life SP CD CSE 23813 18-22 Mild/Mod Prg CD CSE 22-------------------------------------------------------------------------------------------------------------------------825 Sp Ed Pre-Kgn [Not in Sch] CP CXX 477Explanation: CAO= County Alternative/ Opportunity SchCCS= County Community <strong>School</strong>CD= County/District Prgm CJC= County Juvenile Court <strong>School</strong>CP= Other County Prgm [PK] CSE= County Special EdNS= Non-<strong>School</strong>/Prgm or Temp CXX= Not Reported to the State for CBEDSNote: There are two <strong>SFUSD</strong> programs/schools that have their own District school number’s that are notofficially defined as schools by the <strong>SFUSD</strong> <strong>and</strong> the California Dept of Education, <strong>and</strong> theseprograms are reported as part of another school:Downtown HS (CBEDS)- This special entry includes the enrollment of Downtown HS (283 students)<strong>and</strong> After Six HS (5 student). The entry “Downtown HS” reflects this school’s actual enrollment.<strong>School</strong> of the Arts (SOTA) enrollment: 637 SOTA students <strong>and</strong> 169 Academy of Arts & Science students.Charter <strong>School</strong>s: There are 9 charter schools in the <strong>SFUSD</strong> with 2,349 students.Ethic RepresentationCode Ethnic Category codes usedL Latino (SS=Hispanic)OW Other WhiteAA African American (B=Black)C ChineseJ JapaneseK KoreanAI American IndianF FilipinoONW Other Non-White [also includes Arabic,Samoan, South-East Asian (SE & IC)]DS Declines to StateOther HeadingsCode ExplanationNEP/ Non English Proficient (N) orLEP Limited English Proficient (L)-- Also known as English Lang Learners (ELL)Note: NEP/LEP data is not available at this time.45% Indicates a predominant Ethnic Category(-) means Equal or Greater than 45%<strong>SFUSD</strong>\RPA (01/05/07) V1.1
<strong>San</strong> <strong>Francisco</strong>Unified <strong>School</strong> District<strong>School</strong>StudentSch# Count<strong>School</strong> <strong>Site</strong> <strong>Summary</strong> by GradePg 1 of 545%Ethnic Representation<strong>School</strong> <strong>Site</strong> <strong>List</strong> & <strong>Summary</strong>CBEDS Information Day, October 5, 2005L OW AA C J K AI F ONW% % % % % % % % %DS%NEP/LEP%<strong>SFUSD</strong> Grade: K --- 4,241 24.8 11.0 12.2 25.6 1.2 0.8 0.9 5.6 9.9 8.1 43.6<strong>SFUSD</strong> Grade: 01 --- 4,018 25.2 11.1 13.5 25.2 1.0 0.4 0.9 5.8 10.1 6.7 46.7<strong>SFUSD</strong> Grade: 02 --- 3,967 23.3 9.2 13.1 29.3 1.1 0.6 0.8 5.2 11.7 5.8 45.7<strong>SFUSD</strong> Grade: 03 --- 4,051 23.9 9.4 12.1 28.2 1.0 0.8 0.5 5.7 12.0 6.3 47.0<strong>SFUSD</strong> Grade: 04 --- 4,063 22.5 8.7 12.4 31.3 1.0 0.8 0.6 5.3 11.7 5.7 38.2<strong>SFUSD</strong> Grade: 05 --- 4,196 23.3 9.1 14.7 27.4 1.0 0.8 0.5 5.8 10.8 6.5 33.5<strong>SFUSD</strong> Grade: 06 --- 4,106 21.6 7.8 15.5 34.7 0.8 0.7 0.5 6.0 11.2 1.1 25.1<strong>SFUSD</strong> Grade: 07 --- 4,053 22.7 8.8 13.8 32.1 0.9 1.0 0.4 6.0 12.8 1.6 21.7<strong>SFUSD</strong> Grade: 08 --- 4,273 21.9 9.1 14.8 33.7 0.8 0.7 0.6 5.7 11.5 1.1 20.5<strong>SFUSD</strong> Grade: 09 --- 6,050 24.8 7.6 15.6 31.3 0.5 0.8 0.7 6.0 10.9 1.9 20.1<strong>SFUSD</strong> Grade: 10 --- 5,278 19.1 9.5 14.0 34.6 1.0 1.0 0.6 6.5 11.2 2.5 17.8<strong>SFUSD</strong> Grade: 11 --- 4,428 17.5 9.4 10.7 40.7 0.8 0.9 0.3 7.3 10.6 1.8 18.4<strong>SFUSD</strong> Grade: 12 --- 3,512 - 14.0 10.8 7.7 46.1 0.9 1.0 0.3 6.9 10.7 1.6 14.1Operational Level <strong>Summary</strong>Elem K-5 <strong>School</strong>s --- 21,712 24.5 9.4 12.6 29.0 1.1 0.4 0.7 5.0 11.0 6.3 44.3Middle <strong>School</strong>s --- 10,881 23.0 7.9 12.9 35.9 0.8 0.6 0.4 6.0 11.3 1.2 23.9High <strong>School</strong>s --- 19,238 19.6 9.1 12.5 37.1 0.8 0.9 0.5 6.6 10.8 2.0 18.0Alt Config <strong>School</strong>s --- 4,405 17.5 12.9 20.3 18.0 0.8 2.5 0.9 8.4 12.8 5.9 21.9<strong>School</strong> <strong>Site</strong> Total (117 <strong>School</strong>s)<strong>School</strong> <strong>Site</strong> Total --- 56,236 22.0 9.3 13.2 32.2 0.9 0.8 0.6 6.0 11.1 3.8 29.6CBEDS Report Total<strong>School</strong> <strong>Site</strong> Total --- 56,236 22.0 9.3 13.2 32.2 0.9 0.8 0.6 6.0 11.1 3.8 29.6+ SFCOE <strong>School</strong> Total --- 1,040 20.9 18.1 38.2 4.1 0.3 0.4 1.3 3.2 8.8 4.8 7.7CBEDS Report Total --- 57,276 22.0 9.4 13.7 31.7 0.9 0.8 0.6 5.9 11.1 3.8 29.2District/County Total (All Active Students)+ CBEDS Report Total --- 57,276 22.0 9.4 13.7 31.7 0.9 0.8 0.6 5.9 11.1 3.8 29.2+ Other-Not Reported --- 399 33.8 16.0 10.3 17.5 0.5 -- 0.8 3.0 8.5 9.5 --District TOTAL --- 57,675 22.0 9.5 13.7 31.6 0.9 0.8 0.6 5.9 11.1 3.9 29.0<strong>SFUSD</strong>\RPA (10/18/05) V3.1
<strong>San</strong> <strong>Francisco</strong>Unified <strong>School</strong> District<strong>School</strong>Elementary K-5 <strong>School</strong>sStudentSch# CountPg 2 of 545%Ethnic Representation<strong>School</strong> <strong>Site</strong> <strong>List</strong> & <strong>Summary</strong>CBEDS Information Day, October 5, 2005L OW AA C J K AI F ONW% % % % % % % % %DS%NEP/LEP%Alamo ES 413 666 5.0 21.3 0.6 43.8 4.1 1.4 0.2 2.1 11.1 10.5 35.9Alvarado ES 420 471 - 45.4 23.1 6.6 1.5 -- -- 1.1 2.8 8.1 11.5 32.7Argonne ES 435 402 4.2 22.6 4.7 40.0 0.7 1.0 0.5 1.2 12.2 12.7 37.8Bryant ES 456 220 - 83.6 0.9 4.5 4.5 -- -- 1.4 0.9 0.9 3.2 72.7Buena Vista ES 461 373 - 62.2 15.0 5.9 0.8 0.3 -- 1.1 0.5 6.4 7.8 47.7Cabrillo ES 467 421 5.5 19.2 5.5 17.8 18.1 1.0 1.4 2.1 19.7 9.7 39.4Carver ES 625 279 - 3.9 0.4 68.1 0.4 -- -- 2.9 0.7 21.1 2.5 3.9Chavez ES 603 383 - 81.5 1.6 3.1 3.7 -- -- 2.1 3.9 1.6 2.6 73.1Chin ES 872 216 - 1.4 0.9 6.0 77.3 0.5 0.5 -- 1.4 8.3 3.7 69.9Chinese Ed Ctr ES 476 111 -- -- -- 99.1 -- -- -- -- -- 0.9 88.3Clarendon ES 478 570 8.1 29.1 6.0 8.4 13.9 0.5 1.6 2.6 14.0 15.8 20.0Clevel<strong>and</strong> ES 481 303 - 55.4 0.3 7.3 6.9 -- -- 0.3 11.9 14.2 3.6 58.4Cobb ES 525 205 - 9.3 3.4 68.3 2.4 -- -- 1.0 2.0 8.3 5.4 9.8Drew CP Acdy 507 295 - 5.4 0.3 76.3 0.3 -- -- 0.7 0.3 12.9 3.7 6.1El Dorado ES 521 272 15.4 1.8 30.1 16.9 -- -- 0.4 15.4 16.2 3.7 29.8Fairmount ES 537 361 - 59.3 10.0 10.8 1.1 -- -- 0.3 3.9 7.5 7.2 46.0Flynn ES 680 388 - 66.2 5.2 13.7 1.3 -- -- 1.0 3.4 5.4 3.9 53.6Garfield ES 562 238 - 5.5 5.5 7.1 67.2 0.4 -- 0.8 2.5 6.7 4.2 61.8Glen Park ES 575 284 41.9 2.8 18.3 9.5 0.4 -- -- 13.0 9.2 4.9 34.9Grattan ES 589 258 9.7 32.2 20.5 8.9 1.6 0.4 -- 3.1 10.5 13.2 13.6Guadalupe ES 593 397 40.6 2.3 3.5 28.0 -- -- -- 13.9 10.6 1.3 56.2Harte ES 453 274 - 28.8 0.7 46.4 0.4 -- -- 0.7 1.5 17.9 3.6 27.0Hillcrest ES 614 467 37.0 3.4 10.9 18.4 0.6 -- 1.1 12.4 12.6 3.4 49.3Jefferson ES 644 478 - 3.1 13.8 1.3 52.3 1.3 0.4 -- 2.3 13.6 11.9 41.2Key ES 544 499 - 2.8 7.8 1.8 56.9 0.6 0.6 0.4 3.6 17.2 8.2 48.9King ES 838 151 37.1 2.0 29.1 4.6 -- 0.7 0.7 4.6 17.9 3.3 29.1Lafayette ES 664 377 4.2 24.4 3.7 33.4 1.3 2.9 1.6 2.7 17.0 8.8 35.3Lakeshore ES 670 577 10.1 19.1 10.6 32.4 0.5 2.6 0.5 4.9 11.3 8.1 24.6Lau ES 490 669 - 14.6 0.3 0.6 77.0 -- -- 0.3 1.3 1.8 4.0 78.6Longfellow ES 691 564 27.8 1.2 2.5 26.6 -- -- 0.2 31.6 7.1 3.0 48.6Malcolm X Acdy ES 830 164 - 4.9 -- 66.5 -- -- -- 1.2 0.6 25.0 1.8 8.5Marshall ES 714 228 - 78.9 3.1 3.1 -- -- -- 1.3 2.6 6.6 4.4 66.2McCoppin ES 549 249 - 6.4 7.2 8.4 49.4 -- 0.4 0.8 2.8 16.1 8.4 51.8McKinley ES 718 241 26.6 12.4 34.9 1.2 0.4 0.4 1.7 3.7 9.1 9.5 13.3Milk ES 505 221 28.5 14.9 36.7 4.1 -- 0.5 1.8 0.9 7.2 5.4 11.8Miraloma ES 722 300 13.7 31.0 14.7 13.3 0.3 0.3 -- 4.3 8.7 13.7 17.3Mission Ed Ctr ES 724 168 97.6 -- -- 1.8 -- -- -- -- -- 0.6 84.5Monroe ES 729 472 43.6 4.0 2.8 31.4 0.2 -- 0.2 7.8 4.7 5.3 58.5Moscone ES 723 346 - 53.8 2.0 2.0 37.0 -- -- -- 0.3 3.5 1.4 66.5Muir ES 650 222 - 53.2 2.3 34.2 -- -- -- 1.8 2.7 4.1 1.8 45.9New Traditions ES 735 170 10.0 30.0 34.1 0.6 1.2 -- 1.8 4.1 5.9 12.4 8.2Ortega ES 746 236 13.1 5.9 31.8 22.0 0.4 -- 0.4 10.2 9.7 6.4 29.2Parker ES 638 312 - 11.2 0.6 2.2 76.9 -- 0.3 0.3 1.6 2.6 4.2 80.1Parks ES 786 233 - 17.2 3.4 49.4 11.6 -- -- 0.9 2.6 9.4 5.6 30.0Peabody ES 569 176 9.7 12.5 10.8 29.5 1.7 2.8 1.1 4.0 19.3 8.5 39.8Redding ES 790 353 24.9 6.5 4.2 27.8 -- -- -- 7.1 25.8 3.7 62.0<strong>SFUSD</strong>\RPA (10/18/05) V3.1
<strong>San</strong> <strong>Francisco</strong>Unified <strong>School</strong> District<strong>School</strong>Elementary K-5 <strong>School</strong>sStudentSch# CountPg 3 of 545%Ethnic Representation<strong>School</strong> <strong>Site</strong> <strong>List</strong> & <strong>Summary</strong>CBEDS Information Day, October 5, 2005L OW AA C J K AI F ONW% % % % % % % % %DS%NEP/LEP%<strong>San</strong>chez ES 816 284 - 78.5 1.1 9.9 0.7 -- -- 1.4 2.8 4.6 1.1 61.3Serra ES 656 253 - 57.7 0.8 11.1 13.0 0.4 -- 1.2 7.1 5.5 3.2 48.6Sheridan ES 820 212 25.0 2.8 26.9 11.3 -- -- 0.5 17.5 10.4 5.7 36.8Sherman ES 823 398 - 5.8 21.4 5.0 47.2 0.8 0.5 0.3 1.5 9.8 7.8 46.2Sloat ES 488 365 12.6 14.8 7.9 40.3 0.3 1.4 0.5 4.4 10.4 7.4 31.0Spring Valley ES 834 342 - 31.6 2.3 1.8 46.5 -- -- 0.3 1.5 10.2 5.8 76.9Stevenson ES 782 454 - 2.2 7.9 2.9 60.8 0.7 0.4 0.2 3.3 12.6 9.0 41.6Sunnyside ES 842 263 24.3 12.9 11.8 19.0 -- -- -- 11.4 15.6 4.9 29.3Sunset ES 750 309 8.7 15.9 4.2 38.5 0.6 2.3 1.6 4.2 16.2 7.8 39.2Sutro ES 848 255 - 0.8 15.3 2.7 58.4 0.8 1.2 -- 1.2 13.7 5.9 57.3Swett ES 652 227 21.1 1.3 43.2 4.4 -- -- 2.2 5.3 15.0 7.5 27.3Taylor ES 513 650 - 26.9 1.1 4.6 51.1 0.2 0.2 -- 2.6 10.5 2.9 61.8Tenderloin ES 859 365 30.4 6.8 16.4 12.3 -- -- 1.6 6.0 22.5 3.8 53.7Treasure Isl<strong>and</strong> ES 852 98 - 9.2 16.3 55.1 -- -- -- 2.0 3.1 8.2 6.1 12.2Ulloa ES 862 507 - 4.9 9.5 1.6 55.0 0.8 1.8 1.0 5.3 14.6 5.5 47.9Vis Valley ES 867 399 9.5 0.8 13.8 44.6 -- -- 0.3 13.5 14.0 3.5 55.6Webster ES 497 273 41.8 1.1 24.9 20.1 -- -- 1.1 0.4 8.4 2.2 44.0West Portal ES 876 542 - 4.6 12.5 2.8 51.7 0.4 0.4 0.4 2.8 14.6 10.0 33.0Yick Wo ES 801 256 - 7.0 15.6 3.5 57.0 0.4 0.4 -- 0.4 8.6 7.0 49.6Middle <strong>School</strong>sAim High Acdy MS 409 233 - 24.5 6.9 50.2 0.9 -- -- 0.9 3.4 9.9 3.4 15.0Aptos MS 431 894 23.7 12.6 17.3 26.4 0.2 0.6 0.3 6.8 9.4 2.6 14.9Burbank MS 701 251 34.7 0.4 24.7 7.2 -- 1.2 0.8 16.3 13.5 1.2 29.1Denman MS 632 619 28.8 2.7 15.5 18.4 0.6 0.2 0.5 25.7 6.9 0.6 22.0Everett MS 529 452 - 64.8 1.3 19.9 2.2 -- 0.2 0.7 4.6 4.6 1.5 47.3<strong>Francisco</strong> MS 546 587 - 14.3 3.4 11.2 50.3 0.3 0.3 0.2 10.4 9.0 0.5 41.6Giannini MS 404 1,293 - 8.4 9.1 4.5 55.8 0.8 1.5 0.2 4.0 14.4 1.3 15.7Hoover MS 607 1,303 16.0 13.8 5.6 43.7 3.1 1.4 0.2 3.1 11.9 1.2 15.3King MS 710 534 22.8 0.7 21.0 33.5 -- -- 0.7 8.2 12.2 0.7 26.4Lick MS 634 541 - 64.0 10.0 13.3 1.3 0.4 0.2 0.7 3.3 5.9 0.9 31.8Mann MS 618 575 - 78.3 2.1 8.5 4.0 -- -- 0.2 3.1 3.3 0.5 49.9Marina MS 708 1,068 - 12.5 4.3 9.1 60.3 -- 0.4 0.3 2.6 9.3 1.2 28.7Maxwell MS 773 135 - 13.3 3.7 56.3 2.2 -- -- 1.5 5.2 15.6 2.2 11.1Presidio MS 778 1,203 - 7.1 15.4 5.2 49.5 1.7 0.8 0.2 2.4 16.5 1.1 17.6Roosevelt MS 797 783 - 8.7 9.1 14.6 45.2 1.0 0.4 0.3 2.8 16.9 1.1 16.6Vis Valley MS 868 410 13.2 2.2 25.1 32.0 -- -- 0.5 10.5 16.6 -- 25.4<strong>SFUSD</strong>\RPA (10/18/05) V3.1
<strong>San</strong> <strong>Francisco</strong>Unified <strong>School</strong> District<strong>School</strong>High <strong>School</strong>sStudentSch# CountPg 4 of 545%Ethnic Representation<strong>School</strong> <strong>Site</strong> <strong>List</strong> & <strong>Summary</strong>CBEDS Information Day, October 5, 2005L OW AA C J K AI F ONW% % % % % % % % %DS%NEP/LEP%Balboa HS 439 1,035 19.7 4.6 14.2 26.3 0.7 1.4 0.8 18.2 13.1 1.1 22.2Burton HS 764 1,610 25.2 1.7 15.2 30.5 0.2 0.3 0.2 15.8 9.9 0.9 19.5City Arts& Tech HS 484 190 21.1 23.2 20.5 7.4 1.6 0.5 1.1 4.2 15.3 5.3 2.6Cross Cltrl (XCEL) 659 92 29.3 13.0 23.9 5.4 -- 1.1 1.1 13.0 9.8 3.3 15.2Downtown HS 742 229 40.6 5.2 28.8 3.1 -- -- 2.2 9.2 9.2 1.7 17.9Downtown HS(CBEDS) --- 230 40.9 5.2 28.7 3.0 -- -- 2.2 9.1 9.1 1.7 18.3Five Keys Charter 543 223 - 12.1 17.5 58.3 -- -- -- -- 0.4 9.0 2.7 0.4Galileo HS 559 2,050 - 12.8 5.1 9.4 51.1 0.9 1.1 0.4 6.2 12.1 0.9 21.8Gateway HS 565 441 22.4 28.1 15.0 12.7 1.1 0.2 0.9 2.7 12.9 3.9 3.9Independence HS 466 356 36.0 19.4 13.2 9.0 1.1 0.6 0.8 5.3 12.1 2.5 13.2Intl Study Acdy HS 624 470 30.6 5.1 31.1 14.9 0.4 0.4 0.6 6.2 6.2 4.5 23.6Jordan SchEquty HS 757 254 31.9 5.9 35.0 10.6 -- -- 1.2 6.3 7.1 2.0 11.0Leadership HS 678 360 41.1 6.4 16.1 15.6 0.6 -- 0.3 8.1 8.6 3.3 11.4Life Learn Acdy HS 681 46 23.9 8.7 43.5 4.3 -- -- 2.2 -- 10.9 6.5 15.2Lincoln HS 405 2,450 - 10.1 7.2 5.9 57.6 0.7 1.3 0.5 3.9 10.6 2.2 22.6Lowell HS 697 2,623 - 5.9 15.4 2.9 52.6 1.5 1.5 0.2 5.6 11.3 3.1 1.0Marshall HS 853 760 12.9 0.9 22.4 43.0 0.3 -- 0.5 6.2 13.3 0.5 22.8Metro Art& Tech HS 720 102 - 47.1 6.9 20.6 3.9 -- -- 1.0 2.9 7.8 9.8 11.8Mission HS 725 881 39.4 6.7 21.7 12.3 0.2 0.7 0.2 7.5 9.9 1.5 32.6Newcomer HS 738 303 - 35.3 4.0 -- 54.8 -- 1.0 -- 1.0 3.3 0.7 84.2O'Connell HS 651 814 - 73.1 4.9 10.8 2.6 -- -- 1.2 3.3 3.3 0.7 30.8Sch of the Arts HS 815 752 15.4 35.1 12.1 13.3 1.7 1.9 0.9 4.8 10.6 4.1 2.0Wallenberg HS 785 645 18.4 6.8 15.2 38.1 0.5 1.1 0.9 3.6 13.6 1.7 23.6Washington HS 571 2,296 - 9.2 7.8 7.0 54.8 1.3 1.2 0.3 3.8 12.9 1.6 17.4Wells HS 743 255 22.0 6.7 39.2 14.9 0.4 -- 0.4 5.9 10.2 0.4 14.9Alternatively Configured <strong>School</strong>sBrown CP Acdy 858 166 - 5.4 -- 70.5 2.4 -- -- 3.6 1.8 15.1 1.2 6.0Carmichael ES 449 442 - 23.3 1.8 5.9 1.6 -- 0.2 0.9 55.2 9.3 1.8 51.6Creative Arts 809 207 11.1 42.0 17.4 1.9 1.9 1.4 1.0 2.4 10.1 10.6 2.9Davis CP Acdy 641 164 - 3.0 -- 72.0 0.6 -- -- 3.7 1.2 18.9 0.6 4.9KIPP Bayview Acdy 658 212 - 5.2 0.5 73.6 1.4 -- -- 0.5 0.9 13.2 4.7 2.8KIPP S.F. Bay Acdy 657 181 - 27.6 2.8 45.9 2.8 -- -- 0.6 5.0 7.2 8.3 22.1Lawton Alt K8 676 604 - 4.6 7.8 3.1 53.0 1.2 2.6 0.7 2.3 17.2 7.5 31.1Lilienthal Alt K8 479 708 12.4 28.4 14.1 10.2 1.4 11.7 1.1 1.7 12.0 6.9 12.7Revere ES 760 342 - 46.2 2.3 27.8 0.6 -- -- 1.2 10.8 7.9 3.2 37.7Rooftop Alt K8 796 578 26.1 19.7 15.7 13.7 1.7 0.5 0.3 3.3 11.4 7.4 14.0S.F. Community ES 493 278 39.9 10.8 13.3 17.3 -- -- 1.1 6.1 7.9 3.6 36.7Yu Alt K8 485 523 - 6.3 12.6 3.1 47.6 0.8 0.6 -- 1.1 19.7 8.2 14.7<strong>SFUSD</strong>\RPA (10/18/05) V3.1
<strong>San</strong> <strong>Francisco</strong>Unified <strong>School</strong> District<strong>School</strong>StudentSch# CountSFCOE <strong>School</strong>s/ProgramsPg 5 of 545%Ethnic Representation<strong>School</strong> <strong>Site</strong> <strong>List</strong> & <strong>Summary</strong>CBEDS Information Day, October 5, 2005L OW AA C J K AI F ONW% % % % % % % % %DS%NEP/LEP%Cnty Alt/Opp Sch --- 60 - 73.3 5.0 16.7 -- -- -- 1.7 1.7 1.7 -- 41.7Cnty Community Sch --- 352 - 19.6 9.1 48.3 0.9 -- -- 2.0 4.3 12.2 3.4 6.8Cnty Juv Court Sch --- 10 - -- 10.0 80.0 -- -- -- -- 10.0 -- -- --Cnty Special Ed --- 618 16.8 24.6 33.8 6.5 0.5 0.6 0.8 2.6 7.6 6.1 5.0<strong>SFUSD</strong>\RPA (10/18/05) V3.1
<strong>San</strong> <strong>Francisco</strong><strong>School</strong> <strong>Site</strong> <strong>List</strong> & <strong>Summary</strong>Unified <strong>School</strong> District CBEDS Information Day, October 5, 2005ADDITIONAL INFORMATIONThere are 117 school sites in the <strong>SFUSD</strong> as defined by the <strong>School</strong> Operations Office.There are 4 “schools” that the <strong>School</strong> Operations Office has defined as being part of the<strong>San</strong> <strong>Francisco</strong> County Office of Education (SFCOE). The teaching sites (County programs,Instructional Programs, etc.) that comprise these SFCOE schools are listed below.Program District SFCOE StudentNumber Description Grouping <strong>School</strong>s Count616 Hilltop CAO CD CAO 60482 Phoenix (MS) CCS CD CCS 5483 Phoenix (HS) CCS CD CCS 330486 Home Based Ed CCS CD CCS 17688 Log Cabin CJC CD CJC 8892 Woodside CJC CD CJC 2824 Sp Ed Home Hosp CD CSE 35864 UCSF Child Life SP CD CSE 7827 Sp Ed Priv/Parochial CD CSE 246828 Sp Ed State Sp Sch CD CSE --829 Sp Ed Non-Pub Sch CD CSE 330-------------------------------------------------------------------------------------------------------------------------825 Sp Ed Pre-Kgn [Not in Sch] CP CXX 399Explanation: CAO= County Alternative/ Opportunity SchCCS= County Community <strong>School</strong>CD= County/District Prgm CJC= County Juvenile Court <strong>School</strong>CP= Other County Prgm [PK] CSE= County Special EdNS= Non-<strong>School</strong>/Prgm or Temp CXX= Not Reported to the State for CBEDSNote: There are three <strong>SFUSD</strong> programs/schools that are not officially defined as schools by the <strong>SFUSD</strong><strong>and</strong> the California Dept of Education; <strong>and</strong> these programs are reported as part of another school:Downtown HS (CBEDS)- This special entry includes the enrollment of Downtown HS (229 students)<strong>and</strong> After Six HS (1 student). The entry “Downtown HS” reflects this school’s actual enrollment.<strong>School</strong> of the Arts (SOTA) enrollment: 648 SOTA students <strong>and</strong> 104 Academy of Arts & Science students.Cabrillo ES enrollment: 227 Cabrillo ES students <strong>and</strong> 194 Japanese Bilingual-Bicultural Program students.Ethic RepresentationOther HeadingsCodeLOWAACJKAIFONWDSEthnic Category codes usedLatino (SS=Hispanic)Other WhiteAfrican American (B=Black)ChineseJapaneseKoreanAmerican IndianFilipinoOther Non-White [also includes Arabic,Samoan, South-East Asian (SE & IC)]Declines to StateCode ExplanationNEP/ Non English Proficient (N) orLEP Limited English Proficient (L)----- Also known as English Language Learners (ELL)45% Indicates a predominant Ethnic Category(-) means Equal or Greater than 45%<strong>SFUSD</strong>\RPA (10/18/05) V3.1
<strong>San</strong> <strong>Francisco</strong>Unified <strong>School</strong> District<strong>School</strong>StudentSch# Count<strong>School</strong> <strong>Site</strong> <strong>Summary</strong> by GradePg 1 of 545%Ethnic Representation<strong>School</strong> <strong>Site</strong> <strong>List</strong> & <strong>Summary</strong>CBEDS Information Day, October 6, 2004L OW AA C J K AI F ONW% % % % % % % % %DS%NEP/LEP%<strong>SFUSD</strong> Grade: K --- 4,027 25.0 11.1 12.8 23.7 1.1 0.6 1.0 5.7 10.2 8.9 45.1<strong>SFUSD</strong> Grade: 01 --- 4,026 22.8 9.0 14.1 28.2 1.1 0.6 0.9 5.2 11.9 6.1 43.7<strong>SFUSD</strong> Grade: 02 --- 4,210 23.9 9.7 12.9 26.8 1.1 0.7 0.4 5.7 12.3 6.6 45.7<strong>SFUSD</strong> Grade: 03 --- 4,158 22.8 8.7 13.2 30.0 0.9 0.8 0.7 5.1 11.7 6.2 46.0<strong>SFUSD</strong> Grade: 04 --- 4,249 23.7 9.2 14.8 26.2 1.1 0.8 0.6 5.8 11.2 6.6 38.4<strong>SFUSD</strong> Grade: 05 --- 4,378 22.1 8.7 15.6 32.3 0.9 0.8 0.6 6.3 11.6 0.9 33.6<strong>SFUSD</strong> Grade: 06 --- 4,177 22.9 8.6 15.7 30.4 0.9 1.0 0.6 5.9 12.8 1.4 25.3<strong>SFUSD</strong> Grade: 07 --- 4,317 22.2 9.4 15.3 32.1 0.8 0.7 0.6 5.8 12.1 1.0 21.6<strong>SFUSD</strong> Grade: 08 --- 4,196 22.6 9.0 14.5 32.6 0.8 0.9 0.6 6.7 11.7 0.7 21.4<strong>SFUSD</strong> Grade: 09 --- 5,438 20.3 8.8 16.3 32.2 0.9 0.8 0.7 6.4 11.2 2.3 18.6<strong>SFUSD</strong> Grade: 10 --- 5,073 20.0 8.6 14.3 36.0 0.8 0.9 0.4 6.8 10.5 1.6 20.9<strong>SFUSD</strong> Grade: 11 --- 4,656 18.0 10.4 10.2 39.9 0.8 1.0 0.5 7.2 10.4 1.5 18.2<strong>SFUSD</strong> Grade: 12 --- 4,239 16.9 10.3 11.0 38.5 1.1 0.8 0.4 8.2 10.8 1.9 15.7Operational Level <strong>Summary</strong>Elem K-5 <strong>School</strong>s --- 22,728 24.2 8.7 13.5 28.5 1.0 0.5 0.7 5.9 11.4 5.6 44.1Elem K-8 <strong>School</strong>s --- 3,656 15.5 16.3 20.3 21.6 0.9 2.9 0.8 2.3 13.7 5.6 18.0Middle <strong>School</strong>s --- 11,354 23.3 8.2 14.1 33.0 0.8 0.6 0.6 6.6 11.8 1.0 24.0High <strong>School</strong>s --- 19,406 19.0 9.5 13.2 36.4 0.9 0.9 0.5 7.1 10.7 1.9 18.5<strong>School</strong> <strong>Site</strong> Total (119 <strong>School</strong>s)<strong>School</strong> <strong>Site</strong> Total --- 57,144 21.7 9.3 13.9 31.6 0.9 0.8 0.6 6.2 11.4 3.4 29.7CBEDS Report Total+ <strong>School</strong> <strong>Site</strong> Total --- 57,144 21.7 9.3 13.9 31.6 0.9 0.8 0.6 6.2 11.4 3.4 29.7+ SFCOE <strong>School</strong> Total --- 1,179 22.1 18.5 36.5 4.8 0.3 0.3 1.5 3.4 10.0 2.7 8.5CBEDS Report Total --- 58,323 21.7 9.5 14.4 31.1 0.9 0.8 0.6 6.2 11.4 3.4 29.3District/County Total (All Active Students)+ CBEDS Report Total --- 58,323 21.7 9.5 14.4 31.1 0.9 0.8 0.6 6.2 11.4 3.4 29.3Other-Not Reported --- 427 30.7 18.7 10.3 17.1 1.2 0.5 -- 3.3 7.5 10.8 2.1District TOTAL --- 58,750 21.8 9.6 14.4 31.0 0.9 0.8 0.6 6.1 11.3 3.4 29.1<strong>SFUSD</strong>\RPA (10/14/04) V2.0
<strong>San</strong> <strong>Francisco</strong>Unified <strong>School</strong> District<strong>School</strong>Elementary K-5 <strong>School</strong>sStudentSch# CountPg 2 of 545%Ethnic Representation<strong>School</strong> <strong>Site</strong> <strong>List</strong> & <strong>Summary</strong>CBEDS Information Day, October 6, 2004L OW AA C J K AI F ONW% % % % % % % % %DS%NEP/LEP%Alamo ES 413 699 4.0 22.3 0.6 43.8 4.1 1.6 0.1 2.1 12.0 9.3 35.3Alvarado ES 420 451 - 45.5 24.4 6.4 1.8 -- -- 0.9 2.9 7.3 10.9 30.2Argonne ES 435 405 4.0 22.7 5.9 39.0 0.5 0.5 0.5 1.2 13.3 12.3 33.8Bryant ES 456 229 - 78.6 2.2 4.8 6.6 -- -- 1.7 2.2 1.3 2.6 71.6Buena Vista ES 461 367 - 62.4 13.9 6.8 0.5 0.3 -- 1.6 0.8 6.5 7.1 43.9Cabrillo ES 467 246 9.3 19.9 5.7 32.5 1.2 2.4 1.2 3.3 15.4 8.9 51.6Carmichael ES 449 383 - 22.5 1.8 7.0 1.3 -- -- 0.5 55.6 8.9 2.3 48.6Carver ES 625 286 - 4.5 0.7 67.8 0.3 -- -- 2.8 0.3 19.2 4.2 4.5Chavez ES 603 373 - 81.0 1.6 2.1 4.8 -- -- 1.6 4.0 2.1 2.7 71.8Chin ES 872 218 - 0.5 2.3 4.1 77.1 -- -- -- 2.3 10.1 3.7 82.1Chinese Ed Ctr ES 476 73 -- -- -- 100.0 -- -- -- -- -- -- 80.8Clarendon ES 478 583 8.4 31.2 5.5 7.5 14.9 1.0 1.5 2.9 14.8 12.2 15.8Clevel<strong>and</strong> ES 481 313 - 51.8 0.3 9.6 9.3 -- -- -- 12.8 13.7 2.6 55.3Cobb ES 525 183 - 8.7 3.3 64.5 3.3 -- 0.5 2.2 4.9 6.6 6.0 12.6De Avila ES 509 294 3.4 13.6 28.2 4.1 20.7 0.3 1.4 2.7 17.0 8.5 18.4Drew ES 507 303 - 5.9 -- 74.9 1.0 -- -- 0.7 0.7 12.9 4.0 7.3El Dorado ES 521 325 14.2 2.8 28.9 21.5 -- -- 0.3 11.7 16.0 4.6 32.3Fairmount ES 537 362 - 55.5 13.5 10.8 1.1 -- -- 0.6 3.9 8.3 6.4 43.4Flynn ES 680 424 - 70.5 2.4 13.9 1.9 -- -- 0.7 2.4 5.7 2.6 59.0Garfield ES 562 207 - 7.7 2.4 3.4 72.5 -- -- -- 3.4 5.8 4.8 70.5Glen Park ES 575 295 43.4 1.7 17.6 9.5 0.3 -- 0.7 13.2 10.2 3.4 36.9Golden Gate ES 579 96 - 8.3 -- 64.6 4.2 -- -- -- 3.1 15.6 4.2 17.7Grattan ES 589 251 12.7 23.9 24.3 10.4 1.2 0.8 0.4 4.0 12.4 10.0 15.1Guadalupe ES 593 394 37.3 2.8 3.6 32.0 -- -- -- 10.7 11.9 1.8 53.8Harte ES 453 312 30.4 1.6 42.3 0.6 -- -- 1.6 1.3 18.3 3.8 28.8Hillcrest ES 614 470 37.0 2.8 10.6 19.1 0.6 -- 0.9 12.3 12.8 3.8 48.5Jefferson ES 644 478 - 3.8 14.9 1.0 51.7 1.9 1.0 -- 2.1 13.0 10.7 36.4Key ES 544 500 - 3.0 6.6 2.2 57.8 0.4 0.4 -- 4.6 17.4 7.6 56.4King ES 838 159 34.6 3.1 31.4 3.1 -- 0.6 1.3 3.1 21.4 1.3 25.8Lafayette ES 664 391 5.9 22.3 3.6 36.8 0.8 2.3 0.8 3.1 16.6 7.9 41.7Lakeshore ES 670 566 12.7 19.4 11.8 30.0 0.7 2.5 0.2 4.8 12.2 5.7 27.9Lau ES 490 662 - 16.0 0.2 0.5 75.4 -- -- 0.3 1.2 2.4 4.1 84.1Longfellow ES 691 552 25.9 1.4 1.8 28.4 0.2 -- 0.4 29.7 8.7 3.4 47.6Malcolm X ES 830 183 - 5.5 -- 62.8 -- -- -- 1.6 1.6 25.1 3.3 7.1Marshall ES 714 226 - 77.4 2.2 1.8 0.4 -- -- 0.9 4.9 7.1 5.3 70.4McCoppin ES 549 263 - 5.7 5.7 4.9 56.7 0.4 0.4 0.8 2.3 17.5 5.7 65.4McKinley ES 718 201 33.3 12.4 34.8 0.5 -- 0.5 1.0 2.5 8.5 6.5 13.4Milk ES 505 234 26.1 14.5 36.3 5.6 -- 0.4 1.3 0.4 6.0 9.4 9.0Miraloma ES 722 298 12.8 25.5 18.5 16.1 -- 0.3 0.3 5.7 9.1 11.7 19.5Mission Ed Ctr ES 724 131 96.9 -- -- -- -- -- -- -- -- 3.1 94.7Monroe ES 729 467 43.9 3.4 3.0 33.8 0.2 -- 0.2 6.9 4.3 4.3 58.2Moscone ES 723 342 - 53.5 1.2 1.8 36.3 -- -- 0.3 0.6 3.8 2.6 59.4Muir ES 650 266 43.6 2.3 44.0 -- -- -- 1.9 1.1 4.9 2.3 36.5New Traditions ES 735 158 5.7 25.9 42.4 1.3 0.6 -- 1.3 3.2 8.9 10.8 5.7Ortega ES 746 264 9.8 5.7 35.6 22.0 -- 0.4 0.4 10.2 10.6 5.3 27.7Parker ES 638 336 - 15.8 1.2 1.2 72.0 -- 0.3 0.6 1.2 3.6 4.2 77.4<strong>SFUSD</strong>\RPA (10/14/04) V2.0
<strong>San</strong> <strong>Francisco</strong>Unified <strong>School</strong> District<strong>School</strong>Elementary K-5 <strong>School</strong>sStudentSch# CountPg 3 of 545%Ethnic Representation<strong>School</strong> <strong>Site</strong> <strong>List</strong> & <strong>Summary</strong>CBEDS Information Day, October 6, 2004L OW AA C J K AI F ONW% % % % % % % % %DS%NEP/LEP%Parks ES 786 232 - 10.3 2.2 48.7 19.8 -- -- 0.9 3.4 8.6 6.0 28.4Peabody ES 569 168 10.7 13.1 6.5 33.3 0.6 2.4 1.2 4.8 20.2 7.1 39.9Redding ES 790 336 23.5 5.4 2.4 29.8 0.3 0.3 -- 7.4 27.7 3.3 58.3Revere ES 760 297 38.4 2.7 33.7 1.0 -- -- 1.3 12.5 7.1 3.4 35.0<strong>San</strong>chez ES 816 298 - 73.5 1.7 13.8 1.0 -- -- 1.0 2.3 5.0 1.7 54.7Serra ES 656 272 - 54.0 2.6 8.8 15.4 0.4 -- 1.5 7.7 5.9 3.7 51.1Sheridan ES 820 223 25.6 2.2 30.5 9.0 -- -- 0.4 15.2 13.5 3.6 35.9Sherman ES 823 379 - 7.9 16.1 4.7 50.7 0.3 0.8 0.3 1.3 11.3 6.6 47.2Sloat ES 488 367 10.6 15.5 7.4 42.5 0.3 1.4 0.8 3.5 11.2 6.8 33.8Spring Valley ES 834 351 - 33.9 3.4 2.0 45.9 -- 0.3 -- 1.1 9.4 4.0 78.1Stevenson ES 782 458 - 2.4 8.3 3.3 63.8 0.4 0.4 0.2 2.2 11.8 7.2 40.6Sunnyside ES 842 260 25.0 10.4 12.3 21.9 0.4 -- 0.4 11.9 13.1 4.6 34.6Sunset ES 750 317 8.2 14.2 3.5 39.4 0.3 3.5 0.9 5.4 18.9 5.7 44.5Sutro ES 848 244 - 0.8 13.1 3.7 57.0 0.8 0.8 -- 1.6 14.8 7.4 56.6Swett ES 652 265 - 21.5 3.0 45.3 6.8 -- -- 0.4 6.0 12.8 4.2 29.4Taylor ES 513 650 - 25.5 1.4 4.5 50.5 0.2 0.2 -- 4.0 11.2 2.6 62.6Tenderloin ES 859 351 26.8 6.6 12.8 16.0 -- -- 0.9 6.0 26.8 4.3 54.7Ulloa ES 862 517 - 5.4 10.1 2.1 52.6 1.0 3.1 1.4 4.4 14.5 5.4 46.6Vis Valley ES 867 410 9.3 0.5 14.6 41.5 -- -- 0.2 17.6 12.9 3.4 55.6Webster ES 497 330 39.7 1.8 26.1 21.5 -- -- 0.9 0.3 7.3 2.4 39.1West Portal ES 876 538 - 4.8 11.3 3.0 51.7 0.9 0.4 0.2 3.2 16.2 8.4 27.1Yick Wo ES 801 246 - 4.9 13.0 4.1 60.6 1.6 0.8 0.8 -- 8.5 5.7 52.0Elementary K-8 <strong>School</strong>sCreative Arts ES 809 190 11.1 44.7 18.9 0.5 2.1 -- 1.6 2.6 10.0 8.4 2.1KIPP Bayview Acdy 658 161 - 2.5 0.6 79.5 1.2 -- -- -- 0.6 12.4 3.1 3.1KIPP S.F. Bay Acdy 657 127 - 17.3 2.4 56.7 4.7 -- -- 0.8 4.7 7.1 6.3 13.4Lawton Alt K8 676 599 - 6.2 8.0 3.3 52.6 1.0 2.5 0.7 2.3 17.5 5.8 29.9Lilienthal ES 479 692 12.6 28.6 15.5 9.8 1.0 12.3 1.3 1.6 10.5 6.8 11.8Rooftop ES 796 563 24.2 23.6 15.3 12.4 1.6 0.5 0.9 3.4 11.7 6.4 12.3S.F. Community ES 493 288 37.8 10.8 16.0 15.6 0.3 -- 1.0 6.3 9.4 2.8 34.0Treasure Isl<strong>and</strong> ES 852 333 31.8 8.4 23.7 16.2 -- -- 0.9 1.5 14.4 3.0 36.3Twenty-First CA ES 858 208 - 7.7 -- 73.1 1.4 -- -- 1.4 1.0 14.9 0.5 5.8Yu Alt ES 485 495 - 6.1 13.7 3.4 45.5 1.4 0.8 -- 0.8 20.8 7.5 14.1<strong>SFUSD</strong>\RPA (10/14/04) V2.0
<strong>San</strong> <strong>Francisco</strong>Unified <strong>School</strong> District<strong>School</strong>Middle <strong>School</strong>sStudentSch# CountPg 4 of 545%Ethnic Representation<strong>School</strong> <strong>Site</strong> <strong>List</strong> & <strong>Summary</strong>CBEDS Information Day, October 6, 2004L OW AA C J K AI F ONW% % % % % % % % %DS%NEP/LEP%Aim High Acdy MS 409 169 - 25.4 6.5 47.9 0.6 0.6 -- 1.8 3.6 9.5 4.1 19.5Aptos MS 431 862 26.0 13.2 18.9 21.2 0.1 0.3 1.0 6.1 10.2 2.8 16.0Burbank MS 701 314 34.4 1.0 20.4 9.2 -- 0.3 1.0 17.2 16.6 -- 28.3Davis MS 641 170 - 6.5 0.6 71.8 -- -- -- 4.1 1.2 15.3 0.6 4.1Denman MS 632 666 29.6 1.8 14.0 19.5 0.3 0.2 0.5 27.9 6.3 -- 22.4Everett MS 529 508 - 63.2 1.6 18.7 2.2 -- -- 1.0 6.3 5.7 1.4 47.4<strong>Francisco</strong> MS 546 497 17.7 3.4 10.9 42.9 0.2 0.2 0.4 13.7 10.3 0.4 33.6Franklin MS 446 345 23.5 2.6 20.3 38.6 -- 0.6 -- 3.2 10.1 1.2 59.1Giannini MS 404 1,291 - 9.1 10.4 5.5 52.1 1.0 1.9 0.2 4.3 14.4 1.2 16.0Hoover MS 607 1,285 13.1 16.1 5.7 41.8 2.6 1.2 0.4 3.2 14.6 1.3 12.2King MS 710 521 20.5 0.8 21.5 34.9 -- -- 1.0 9.2 11.7 0.4 27.8Lick MS 634 509 - 62.9 9.4 15.9 1.2 0.4 0.2 0.6 2.9 5.7 0.8 29.9Mann MS 618 650 - 76.6 3.2 5.7 4.2 -- -- 0.6 4.8 4.5 0.5 42.8Marina MS 708 994 - 10.2 4.5 10.0 59.9 0.3 0.2 0.4 3.0 11.0 0.6 28.2Maxwell MS 773 167 - 16.2 6.6 49.1 1.8 -- -- 2.4 9.6 13.8 0.6 13.8Presidio MS 778 1,197 - 7.4 16.5 6.3 48.4 1.8 1.1 0.2 2.7 14.5 1.2 18.0Roosevelt MS 797 758 9.2 10.9 14.4 41.2 1.3 0.9 0.5 3.6 17.4 0.5 17.9Vis Valley MS 868 451 16.2 1.6 26.8 29.5 -- -- 0.4 9.3 16.2 -- 23.5High <strong>School</strong>sAfter Six HS 407 14 42.9 14.3 14.3 7.1 -- -- -- 14.3 7.1 -- 7.1Balboa HS 439 981 21.1 4.4 16.7 22.1 0.7 0.9 0.6 19.2 12.9 1.3 23.9Burton HS 764 1,780 24.2 1.9 17.9 25.8 0.3 0.3 0.4 18.4 10.2 0.8 16.3City Arts& Tech HS 484 95 21.1 25.3 24.2 4.2 -- -- 2.1 4.2 14.7 4.2 3.2Cross Cltrl (XCEL) 659 98 19.4 18.4 32.7 7.1 -- -- 2.0 11.2 6.1 3.1 10.2Downtown HS 742 248 37.9 3.6 34.7 3.2 -- 0.8 1.6 9.7 8.1 0.4 13.7Downtown HS(CBEDS) --- 262 38.2 4.2 33.6 3.4 -- 0.8 1.5 9.9 8.0 0.4 13.4Five Keys Charter 543 226 - 11.9 17.3 58.4 0.4 -- -- -- 0.4 8.8 2.7 0.4Galileo HS 559 1,998 - 13.3 5.1 10.4 48.9 0.9 1.0 0.3 6.7 12.7 0.9 27.6Gateway HS 565 446 24.9 30.3 13.7 10.8 0.9 0.2 0.7 2.7 12.8 3.1 2.2Independence HS 466 333 35.1 18.9 16.5 8.7 0.9 -- 0.6 6.6 11.1 1.5 16.5Intl Study Acdy HS 624 489 30.3 6.3 30.5 14.7 0.4 0.2 1.2 5.9 7.6 2.9 20.2Jordan SchEquty HS 757 184 27.2 9.8 33.2 13.0 -- -- 2.2 4.9 7.1 2.7 10.3Leadership HS 678 382 32.5 9.2 17.3 18.6 0.8 -- 0.8 7.9 8.6 4.5 8.4Life Learn Acdy HS 681 57 - 22.8 8.8 49.1 3.5 -- -- 1.8 -- 10.5 3.5 12.3Lincoln HS 405 2,490 - 8.6 8.8 5.4 57.2 1.0 1.4 0.2 4.1 11.4 1.7 20.7Lowell HS 697 2,592 - 5.5 15.5 2.6 53.7 1.2 1.5 0.3 5.5 11.0 3.2 0.7Marshall HS 853 941 13.9 1.0 26.0 39.4 0.4 0.2 0.5 6.4 11.4 0.7 19.9Mission HS 725 978 37.7 8.3 22.6 10.5 0.2 0.4 0.6 8.7 9.0 1.9 33.1Newcomer HS 738 378 - 31.2 2.9 0.3 53.7 -- 1.1 -- 0.5 8.5 1.9 95.5O'Connell HS 651 899 - 73.2 5.7 9.1 2.2 0.1 0.1 1.2 3.9 3.8 0.7 28.6Sch of the Arts HS 815 618 15.4 36.1 11.3 12.9 2.3 1.6 1.1 4.4 8.9 6.0 3.4Wallenberg HS 785 628 14.5 7.0 16.7 41.4 0.8 0.8 0.8 4.1 12.7 1.1 21.0Washington HS 571 2,311 - 7.7 9.8 6.4 54.8 2.0 1.4 0.2 4.0 12.0 1.5 16.7Wells HS 743 240 20.8 5.8 40.0 11.7 0.8 1.3 0.4 4.2 14.2 0.8 12.9<strong>SFUSD</strong>\RPA (10/14/04) V2.0
<strong>San</strong> <strong>Francisco</strong>Unified <strong>School</strong> District<strong>School</strong>StudentSch# CountSFCOE <strong>School</strong>s/ProgramsPg 5 of 545%Ethnic Representation<strong>School</strong> <strong>Site</strong> <strong>List</strong> & <strong>Summary</strong>CBEDS Information Day, October 6, 2004L OW AA C J K AI F ONW% % % % % % % % %DS%NEP/LEP%Cnty Alt/Opp Sch --- 62 - 69.4 3.2 24.2 -- -- -- -- 3.2 -- -- 30.6Cnty Community Sch --- 535 22.4 10.7 41.1 3.4 -- 0.2 2.2 4.1 12.7 3.2 10.5Cnty Juv Court Sch --- 18 - 22.2 16.7 50.0 5.6 -- -- -- 5.6 -- -- 27.8Cnty Special Ed --- 564 16.5 27.7 33.0 6.7 0.5 0.4 1.1 2.7 8.9 2.7 3.5<strong>SFUSD</strong>\RPA (10/14/04) V2.0
<strong>San</strong> <strong>Francisco</strong><strong>School</strong> <strong>Site</strong> <strong>List</strong> & <strong>Summary</strong>Unified <strong>School</strong> District CBEDS Information Day, October 6, 2004ADDITIONAL INFORMATIONThere are 119 school sites in the <strong>SFUSD</strong> as defined by the <strong>School</strong> Operations Office.There are 4 “schools” that the <strong>School</strong> Operations Office has defined as being part of the<strong>San</strong> <strong>Francisco</strong> County Office of Education (SFCOE). The teaching sites (County programs,Instructional Programs, etc.) that comprise these SFCOE schools are listed below.Program District SFCOE StudentNumber Description Grouping <strong>School</strong>s Count616 Hilltop CAO CD CAO 62482 Phoenix (MS) CCS CD CCS 17483 Phoenix (HS) CCS CD CCS 494486 Home Based Ed CCS CD CCS 24688 Log Cabin CJC CD CJC 13892 Woodside CJC CD CJC 5824 Sp Ed Home Hosp CD CSE 36827 Sp Ed Priv/Parochial CD CSE 213828 Sp Ed State Sp Sch CD CSE --829 Sp Ed Non-Pub Sch CD CSE 315-------------------------------------------------------------------------------------------------------------------------825 Sp Ed Pre-Kgn [Not in Sch] CP CXX 427Explanation: CAO= County Alternative/ Opportunity SchCCS= County Community <strong>School</strong>CD= County/District Prgm CJC= County Juvenile Court <strong>School</strong>CP= Other County Prgm [PK] CSE= County Special EdNS= Non-<strong>School</strong>/Prgm or Temp CXX= Not Reported to the State for CBEDSNotes:Downtown HS (CBEDS)- This special entry is included because in the CBEDS report to the State,the enrollment of After Six HS (14 students) is included with Downtown HS (248 students).The entry “Downtown HS” reflects this school’s actual enrollment.Ethic RepresentationOther HeadingsCodeLOWAACJKAIFONWDSEthnic Category codes usedLatino (SS=Hispanic)Other WhiteAfrican American (B=Black)ChineseJapaneseKoreanAmerican IndianFilipinoOther Non-White [also includes Arabic,Samoan, South-East Asian (SE & IC)]Declines to StateCode ExplanationNEP/ Non English Proficient (N) orLEP Limited English Proficient (L)----- Also known as English Language Learners (ELL)45% Indicates a predominant Ethnic Category(-) means Equal or Greater than 45%<strong>SFUSD</strong>\RPA (10/14/04) V2.0
<strong>San</strong> <strong>Francisco</strong>Unified <strong>School</strong> District<strong>School</strong>StudentSch# Count<strong>School</strong> <strong>Site</strong> <strong>Summary</strong> by GradePg 1 of 545%Ethnic Representation<strong>School</strong> <strong>Site</strong> <strong>List</strong> & <strong>Summary</strong>CBEDS Information Day, October 1, 2003L OW AA C J K AI F ONW% % % % % % % % %DS%NEP/LEP%<strong>SFUSD</strong> Grade: K --- 4,044 23.2 9.1 13.9 27.2 1.1 0.7 0.8 5.6 12.5 5.9 41.7<strong>SFUSD</strong> Grade: 01 --- 4,285 23.5 9.6 13.6 25.6 1.1 0.8 0.5 5.6 12.9 6.9 44.7<strong>SFUSD</strong> Grade: 02 --- 4,234 22.3 9.0 13.9 28.7 0.9 0.9 0.6 5.4 12.0 6.4 46.6<strong>SFUSD</strong> Grade: 03 --- 4,272 23.8 9.3 15.2 25.2 1.1 0.8 0.6 5.9 11.4 6.5 43.7<strong>SFUSD</strong> Grade: 04 --- 4,428 22.4 8.9 15.6 31.5 0.9 0.9 0.7 6.2 12.1 0.7 38.2<strong>SFUSD</strong> Grade: 05 --- 4,364 23.3 9.5 15.7 28.8 0.9 0.9 0.5 6.3 13.2 1.0 31.4<strong>SFUSD</strong> Grade: 06 --- 4,412 22.2 9.3 16.4 30.5 0.9 0.8 0.7 6.3 12.1 0.8 24.8<strong>SFUSD</strong> Grade: 07 --- 4,272 22.4 9.0 15.4 31.4 0.7 0.9 0.7 6.9 12.1 0.5 22.5<strong>SFUSD</strong> Grade: 08 --- 4,361 21.4 9.5 16.1 31.4 1.0 1.0 0.8 6.6 11.3 0.9 17.1<strong>SFUSD</strong> Grade: 09 --- 5,178 20.6 9.1 15.6 33.8 0.8 0.9 0.6 6.6 10.8 1.2 19.1<strong>SFUSD</strong> Grade: 10 --- 5,256 19.5 9.9 12.4 36.7 0.8 0.9 0.6 6.9 11.0 1.3 21.0<strong>SFUSD</strong> Grade: 11 --- 4,606 18.0 10.4 12.8 36.2 1.0 0.8 0.4 8.0 10.8 1.7 17.9<strong>SFUSD</strong> Grade: 12 --- 4,093 16.6 12.5 11.5 38.1 0.8 1.2 0.3 7.5 10.4 1.1 17.9Operational Level <strong>Summary</strong>Elem K-5 <strong>School</strong>s --- 23,137 23.8 8.5 14.2 28.6 1.0 0.6 0.6 6.2 12.3 4.3 43.1Elem K-8 <strong>School</strong>s --- 3,682 16.8 16.8 18.9 21.4 1.0 3.1 1.0 2.6 13.9 4.5 19.0Middle <strong>School</strong>s --- 11,853 22.5 8.4 15.7 32.1 0.8 0.7 0.7 7.0 11.5 0.7 22.2High <strong>School</strong>s --- 19,133 18.8 10.3 13.2 36.1 0.9 0.9 0.5 7.2 10.8 1.3 19.1<strong>School</strong> <strong>Site</strong> Total (118 <strong>School</strong>s)<strong>School</strong> <strong>Site</strong> Total --- 57,805 21.4 9.6 14.5 31.3 0.9 0.9 0.6 6.5 11.7 2.6 29.3CBEDS Report Total+ <strong>School</strong> <strong>Site</strong> Total --- 57,805 21.4 9.6 14.5 31.3 0.9 0.9 0.6 6.5 11.7 2.6 29.3+ SFCOE <strong>School</strong> Total --- 1,210 18.9 20.6 38.9 4.0 0.2 0.2 1.2 4.0 10.7 1.2 6.7CBEDS Report Total --- 59,015 21.4 9.8 15.0 30.8 0.9 0.9 0.6 6.4 11.7 2.6 28.9District/County Total (All Active Students)+ CBEDS Report Total --- 59,015 21.4 9.8 15.0 30.8 0.9 0.9 0.6 6.4 11.7 2.6 28.9+ Other (not CBEDS) --- 435 29.2 20.9 13.1 15.2 0.7 0.5 -- 4.1 7.4 9.0 --District TOTAL --- 59,450 21.4 9.9 15.0 30.7 0.9 0.9 0.6 6.4 11.7 2.6 28.7<strong>SFUSD</strong>\RPA (10/15/03) V2.1
<strong>San</strong> <strong>Francisco</strong>Unified <strong>School</strong> District<strong>School</strong>Elementary K-5 <strong>School</strong>sStudentSch# CountPg 2 of 545%Ethnic Representation<strong>School</strong> <strong>Site</strong> <strong>List</strong> & <strong>Summary</strong>CBEDS Information Day, October 1, 2003L OW AA C J K AI F ONW% % % % % % % % %DS%NEP/LEP%Alamo ES 413 688 4.9 23.3 0.7 43.2 4.4 1.7 0.3 2.3 13.2 6.0 32.8Alvarado ES 420 443 42.9 27.8 6.3 1.8 0.2 0.2 0.7 2.3 10.2 7.7 26.6Argonne ES 435 392 3.8 22.4 6.9 39.5 1.3 0.8 -- 1.8 15.1 8.4 31.9Bryant ES 456 228 - 78.1 2.2 4.4 7.9 -- -- 1.3 1.3 1.8 3.1 69.7Buena Vista ES 461 365 - 61.4 15.6 6.3 0.8 -- -- 1.9 0.8 7.1 6.0 41.1Cabrillo ES 467 242 7.4 18.2 7.0 34.3 0.8 2.5 0.8 3.3 16.9 8.7 47.9Carmichael ES 449 374 - 20.1 2.9 5.6 2.1 -- -- 0.5 58.6 8.8 1.3 51.1Carver ES 625 292 - 4.5 -- 68.2 0.3 -- -- 2.7 0.3 21.2 2.7 4.5Chavez ES 603 372 - 79.0 1.9 2.4 8.6 -- -- 1.6 2.2 2.4 1.9 72.3Chin ES 872 222 - 0.5 0.5 1.4 78.4 -- -- -- 2.7 14.0 2.7 78.8Chinese Ed Ctr ES 476 104 -- -- -- 99.0 -- -- -- -- 1.0 -- 84.6Clarendon ES 478 577 8.8 32.2 6.6 7.1 15.3 0.7 1.0 2.9 15.4 9.9 14.6Clevel<strong>and</strong> ES 481 326 - 51.2 1.2 10.7 9.2 -- -- 0.3 13.5 12.3 1.5 51.2Cobb ES 525 195 - 9.7 1.5 61.5 6.2 -- 1.5 0.5 6.2 8.2 4.6 11.3De Avila ES 509 281 2.1 12.8 31.7 6.4 20.3 0.4 0.7 4.6 13.5 7.5 19.9Drew ES 507 230 - 5.2 -- 70.4 4.8 -- -- 2.2 1.3 14.8 1.3 8.3El Dorado ES 521 314 12.7 1.3 30.6 27.1 -- -- 0.3 12.7 11.8 3.5 32.8Fairmount ES 537 335 - 58.2 11.9 11.6 0.6 -- -- 0.6 4.2 7.2 5.7 39.1Flynn ES 680 424 - 67.2 1.4 15.1 2.6 -- -- 0.2 4.0 7.3 2.1 58.3Garfield ES 562 205 - 6.8 0.5 5.4 73.2 -- -- -- 2.9 7.8 3.4 68.3Glen Park ES 575 295 44.4 1.7 16.3 10.5 0.3 -- 0.3 14.2 10.2 2.0 37.6Golden Gate ES 579 126 - 18.3 -- 52.4 5.6 -- -- -- 2.4 18.3 3.2 30.2Grattan ES 589 254 10.2 22.0 26.4 13.8 0.4 1.2 0.4 4.3 11.8 9.4 18.1Guadalupe ES 593 415 38.1 2.9 4.6 28.4 -- -- -- 11.3 13.3 1.4 55.7Harte ES 453 321 30.5 0.9 43.0 1.6 -- -- 1.9 2.2 16.8 3.1 30.8Hillcrest ES 614 456 35.3 1.8 10.3 19.7 0.4 -- 0.7 15.6 13.6 2.6 43.6Jefferson ES 644 474 - 4.2 16.7 1.3 51.9 1.5 1.3 -- 1.7 12.9 8.6 37.6Jump Academy ES 655 157 - 1.9 1.3 83.4 -- -- -- 0.6 -- 8.9 3.8 --Key ES 544 497 - 4.2 6.0 2.0 57.7 0.4 0.8 -- 4.2 18.3 6.2 52.5King ES 838 176 30.7 2.8 33.0 2.8 -- -- 1.1 1.7 26.7 1.1 29.0Lafayette ES 664 407 5.7 23.6 2.5 38.1 1.2 2.5 0.2 2.2 17.0 7.1 40.8Lakeshore ES 670 578 11.9 19.2 13.5 28.7 0.9 3.5 0.5 4.7 12.1 5.0 26.1Lau ES 490 640 - 19.8 0.3 0.6 70.9 -- -- 0.2 1.4 2.8 3.9 83.3Longfellow ES 691 554 26.4 1.4 1.6 28.3 0.2 -- 0.4 30.9 7.9 2.9 48.4Malcolm X ES 830 237 - 3.8 -- 64.6 -- -- -- 1.3 1.7 27.0 1.7 5.9Marshall ES 714 228 - 76.8 1.3 1.8 1.8 -- -- 0.4 4.8 10.1 3.1 70.2McCoppin ES 549 284 - 4.9 7.4 4.2 54.2 0.4 0.7 0.7 2.5 19.0 6.0 57.4McKinley ES 718 190 34.7 11.1 33.7 1.1 -- -- 1.1 3.7 8.9 5.8 15.8Milk ES 505 223 26.9 15.7 33.2 6.3 -- 0.4 1.8 -- 8.1 7.6 13.5Miraloma ES 722 283 14.5 17.3 16.6 25.4 -- -- -- 6.0 11.7 8.5 27.9Mission Ed Ctr ES 724 111 97.3 -- -- 1.8 -- -- -- -- 0.9 -- 91.0Monroe ES 729 467 43.9 2.8 2.6 32.8 0.4 -- 0.2 8.4 5.6 3.4 63.0Moscone ES 723 339 - 54.3 1.2 1.8 36.0 -- -- -- 0.9 3.5 2.4 56.9Muir ES 650 278 41.7 2.9 45.0 0.7 -- -- 1.4 0.7 5.4 2.2 34.2New Traditions ES 735 186 8.1 36.0 34.9 0.5 0.5 -- -- 1.6 9.7 8.6 4.8Ortega ES 746 305 12.1 5.2 33.8 20.3 -- 1.6 0.3 8.5 13.8 4.3 32.5Parker ES 638 334 - 20.1 1.2 1.8 66.5 0.3 0.3 0.6 1.2 5.1 3.0 82.3<strong>SFUSD</strong>\RPA (10/15/03) V2.1
<strong>San</strong> <strong>Francisco</strong>Unified <strong>School</strong> District<strong>School</strong>Elementary K-5 <strong>School</strong>sStudentSch# CountPg 3 of 545%Ethnic Representation<strong>School</strong> <strong>Site</strong> <strong>List</strong> & <strong>Summary</strong>CBEDS Information Day, October 1, 2003L OW AA C J K AI F ONW% % % % % % % % %DS%NEP/LEP%Parks ES 786 246 10.6 0.8 42.7 28.9 -- -- 0.4 2.8 9.8 4.1 28.5Peabody ES 569 187 8.0 13.4 7.0 41.2 -- 0.5 1.1 8.0 18.2 2.7 44.4Redding ES 790 344 22.1 2.6 3.2 32.6 -- -- -- 6.7 30.5 2.3 64.5Revere ES 760 381 39.1 4.2 29.9 1.3 -- -- 1.0 12.3 9.2 2.9 31.2<strong>San</strong>chez ES 816 280 - 66.4 1.1 14.6 3.9 -- -- 1.4 3.6 7.1 1.8 51.4Serra ES 656 274 - 51.5 2.6 9.9 18.2 0.4 -- 0.4 7.3 6.9 2.9 47.1Sheridan ES 820 239 20.1 2.1 37.2 8.4 -- -- 0.4 15.5 11.7 4.6 28.9Sherman ES 823 365 - 9.0 12.9 4.7 53.2 -- -- 0.5 1.9 12.3 5.5 46.0Sloat ES 488 364 11.8 16.2 10.7 37.4 -- 1.6 0.8 3.6 11.8 6.0 32.1Spring Valley ES 834 341 - 30.5 3.8 1.2 47.5 0.3 -- 0.3 2.1 11.1 3.2 79.8Stevenson ES 782 481 - 2.5 8.9 2.7 62.2 1.0 1.5 0.2 2.9 12.5 5.6 41.0Sunnyside ES 842 241 30.3 6.2 10.0 24.1 0.4 -- 0.4 10.0 15.8 2.9 39.0Sunset ES 750 326 9.2 11.3 2.8 44.5 -- 2.8 1.2 5.8 18.4 4.0 51.2Sutro ES 848 250 - 2.0 18.0 4.8 52.4 1.2 0.4 -- 2.0 14.8 4.4 54.4Swett ES 652 279 19.4 3.2 40.9 8.2 -- 0.4 1.1 6.5 16.5 3.9 27.6Taylor ES 513 659 - 25.5 1.1 6.7 47.6 0.2 0.2 -- 5.8 11.5 1.5 58.3Tenderloin ES 859 364 26.1 6.3 13.2 17.9 -- -- 0.5 6.0 27.7 2.2 52.7Ulloa ES 862 527 - 7.2 9.9 2.3 50.7 0.8 3.4 1.1 5.3 15.2 4.2 44.0Vis Valley ES 867 423 9.2 0.5 15.6 41.1 -- -- 0.2 15.6 15.6 2.1 53.7Webster ES 497 348 38.8 2.0 28.7 21.3 -- -- 0.3 0.6 6.9 1.4 39.4West Portal ES 876 553 - 5.2 14.6 3.8 47.0 1.3 0.5 0.2 2.5 17.9 6.9 28.0Yick Wo ES 801 241 - 5.0 9.1 5.0 62.7 1.2 1.7 0.4 0.4 10.0 4.6 45.6Elementary K-8 <strong>School</strong>sCreative Arts ES 809 193 - 9.8 45.6 17.6 0.5 1.6 -- 1.6 3.6 12.4 7.3 2.1KIPP Bayview Acdy 658 81 - 3.7 -- 80.2 -- -- -- -- 1.2 12.3 2.5 2.5KIPP S.F. Bay Acdy 657 73 26.0 2.7 42.5 5.5 -- -- -- 4.1 8.2 11.0 12.3Lawton Alt K8 676 600 - 6.8 9.7 4.0 51.3 1.0 2.8 0.8 1.7 17.2 4.7 26.7Lilienthal ES 479 669 11.5 28.4 17.5 9.4 1.0 13.3 1.3 1.3 10.5 5.7 9.4Rooftop ES 796 581 25.3 24.3 15.1 12.7 1.5 0.5 1.2 3.8 10.0 5.5 10.0S.F. Community ES 493 303 38.3 13.2 13.5 15.2 0.3 -- 1.7 6.6 9.6 1.7 33.7Treasure Isl<strong>and</strong> ES 852 430 32.3 6.3 24.4 17.2 -- 0.2 0.5 2.3 15.3 1.4 40.2Twenty-First CA ES 858 266 - 10.2 0.4 63.2 4.9 -- -- 2.3 3.0 15.0 1.1 14.3Yu Alt ES 485 486 6.2 15.0 4.7 42.4 1.9 1.0 -- 1.2 21.4 6.2 18.7<strong>SFUSD</strong>\RPA (10/15/03) V2.1
<strong>San</strong> <strong>Francisco</strong>Unified <strong>School</strong> District<strong>School</strong>Middle <strong>School</strong>sStudentSch# CountPg 4 of 545%Ethnic Representation<strong>School</strong> <strong>Site</strong> <strong>List</strong> & <strong>Summary</strong>CBEDS Information Day, October 1, 2003L OW AA C J K AI F ONW% % % % % % % % %DS%NEP/LEP%Aim High Acdy MS 409 91 34.1 5.5 44.0 -- -- -- 2.2 4.4 7.7 2.2 28.6Aptos MS 431 898 24.7 11.0 18.7 22.2 0.1 0.4 1.1 8.4 11.4 2.0 16.5Burbank MS 701 443 34.5 2.0 23.7 9.9 0.2 -- 0.5 15.1 14.0 -- 26.0Davis MS 641 191 - 9.9 0.5 62.8 -- -- -- 4.2 0.5 21.5 0.5 6.8Denman MS 632 713 27.6 2.4 14.7 20.6 0.4 0.1 0.3 28.3 5.3 0.1 24.4Everett MS 529 588 - 54.9 2.7 23.5 2.4 -- -- 1.2 7.5 7.3 0.5 40.1<strong>Francisco</strong> MS 546 536 15.5 3.2 14.4 43.7 -- 0.2 0.4 11.4 11.2 0.2 29.5Franklin MS 446 307 25.1 2.0 23.8 26.7 -- 1.0 0.7 5.5 14.0 1.3 47.9Giannini MS 404 1,324 - 8.3 13.1 7.4 50.2 0.8 2.0 0.5 3.7 13.4 0.6 15.2Hoover MS 607 1,247 11.7 15.6 6.4 41.8 3.2 1.4 0.2 3.0 15.6 1.1 13.4King MS 710 522 19.5 1.1 24.9 35.1 -- -- 0.8 8.8 9.4 0.4 22.2Lick MS 634 564 - 57.1 8.7 21.1 2.3 0.5 0.2 1.4 3.4 4.8 0.5 26.2Mann MS 618 645 - 74.7 3.3 6.4 5.4 -- -- 0.5 4.8 4.8 0.2 39.5Marina MS 708 1,068 - 10.0 6.0 12.6 56.8 0.2 0.5 0.5 3.0 9.6 0.8 24.7Maxwell MS 773 229 28.8 5.7 41.0 2.2 -- -- 1.3 8.3 12.7 -- 17.9Presidio MS 778 1,189 - 6.6 17.3 5.8 49.8 2.2 1.4 0.2 3.3 12.2 1.3 14.4Roosevelt MS 797 787 8.1 11.7 17.2 39.8 1.5 0.6 0.5 4.2 15.6 0.8 16.4Vis Valley MS 868 511 16.6 0.8 25.0 29.2 -- -- 1.2 10.0 17.2 -- 23.9High <strong>School</strong>sAfter Six HS 407 13 23.1 7.7 23.1 15.4 -- 7.7 -- 7.7 15.4 -- 7.7Balboa HS 439 925 24.4 5.0 22.4 14.5 0.1 0.6 1.0 19.7 11.7 0.6 25.7Burton HS 764 1,904 24.4 2.5 19.8 23.8 0.3 0.3 0.3 18.7 9.3 0.6 15.0Cross Cltrl (XCEL) 659 76 23.7 11.8 35.5 3.9 1.3 1.3 2.6 13.2 5.3 1.3 7.9Downtown HS 742 260 34.6 8.1 34.2 3.8 0.4 -- 1.2 6.9 10.4 0.4 14.2Downtown HS(CBEDS) --- 273 34.1 8.1 33.7 4.4 0.4 0.4 1.1 7.0 10.6 0.4 13.9Galileo HS 559 2,006 - 14.4 5.9 13.1 45.2 0.3 1.0 0.4 6.1 13.0 0.7 34.0Gateway HS 565 430 23.5 32.8 13.5 9.5 0.7 0.5 0.5 2.1 13.0 4.0 3.3Independence HS 466 382 30.4 21.7 17.3 11.8 0.5 0.5 -- 9.2 7.1 1.6 14.7Intl Study Acdy HS 624 476 31.7 8.8 26.1 13.4 0.2 -- 1.1 6.7 10.1 1.9 24.4Leadership HS 678 375 30.9 14.7 16.5 14.9 0.5 -- 0.8 6.7 11.5 3.5 9.6Life Learn Acdy HS 681 59 - 25.4 5.1 49.2 -- -- 1.7 -- 1.7 8.5 8.5 13.6Lincoln HS 405 2,511 - 7.2 10.6 5.3 57.3 1.0 1.4 0.4 4.2 11.3 1.3 18.4Lowell HS 697 2,570 - 4.5 16.7 2.4 55.4 1.1 1.5 0.4 4.8 11.2 2.1 0.9Marshall HS 853 1,005 14.3 1.3 25.7 39.6 0.4 0.2 0.5 7.2 10.5 0.3 19.2Mission HS 725 889 44.2 6.5 23.2 9.3 0.1 0.3 0.7 7.6 6.9 1.1 37.6Newcomer HS 738 419 - 35.1 2.4 0.2 51.6 0.2 1.7 -- 1.4 6.7 0.7 86.9O'Connell HS 651 932 - 70.6 7.0 9.5 2.8 0.1 -- 1.0 4.2 4.2 0.6 21.1Sch of the Arts HS 815 577 14.2 36.0 10.9 12.7 2.4 1.2 0.7 5.7 9.7 6.4 3.8Small SchEquity HS 757 97 24.7 12.4 32.0 15.5 -- -- -- 7.2 6.2 2.1 9.3Wallenberg HS 785 663 12.2 7.2 16.9 42.8 0.8 1.1 0.2 4.2 13.6 1.1 20.1Washington HS 571 2,302 - 6.1 12.3 6.5 52.2 2.5 1.7 0.1 4.3 13.4 0.7 17.2Wells HS 743 262 15.6 8.0 41.6 14.1 0.4 1.1 0.8 3.4 14.5 0.4 16.0<strong>SFUSD</strong>\RPA (10/15/03) V2.1
<strong>San</strong> <strong>Francisco</strong>Unified <strong>School</strong> District<strong>School</strong>StudentSch# CountSFCOE <strong>School</strong>s/ProgramsPg 5 of 545%Ethnic Representation<strong>School</strong> <strong>Site</strong> <strong>List</strong> & <strong>Summary</strong>CBEDS Information Day, October 1, 2003L OW AA C J K AI F ONW% % % % % % % % %DS%NEP/LEP%Cnty Alt/Opp Sch --- 56 39.3 -- 41.1 -- -- -- -- 10.7 8.9 -- 19.6Cnty Community Sch --- 483 - 21.7 7.7 46.0 2.7 0.2 0.2 0.8 5.6 14.3 0.8 11.2Cnty Juv Court Sch --- 24 - 8.3 -- 62.5 -- -- -- -- -- 29.2 -- --Cnty Special Ed --- 647 15.5 32.8 32.6 5.6 0.3 0.3 1.5 2.5 7.4 1.5 2.5<strong>SFUSD</strong>\RPA (10/15/03) V2.1
<strong>San</strong> <strong>Francisco</strong><strong>School</strong> <strong>Site</strong> <strong>List</strong> & <strong>Summary</strong>Unified <strong>School</strong> District CBEDS Information Day, October 1, 2003ADDITIONAL INFORMATIONThere are 118 school sites in the <strong>SFUSD</strong> as defined by the <strong>School</strong> Operations Office.There are 4 “schools” that the <strong>School</strong> Operations Office has defined as being part of the<strong>San</strong> <strong>Francisco</strong> County Office of Education (SFCOE). The teaching sites (County programs,Instructional Programs, etc.) that comprise these SFCOE schools are listed below.CBEDS<strong>School</strong> District SFCOE StudentNumber Description Grouping <strong>School</strong>s Count616 Hilltop CAO CD CAO 56482 Phoenix (MS) CCS CD CCS 28483 Phoenix (HS) CCS CD CCS 431486 Home Based Ed CCS CD CCS 24688 Log Cabin CJC CD CJC 24892 Woodside CJC CD CJC --824 Sp Ed Home Hosp CD CSE 17827 Sp Ed Priv/Parochial CD CSE 230828 Sp Ed State Sp Sch CD CSE --829 Sp Ed Non-Pub Sch CD CSE 400-----------------------------------------------------------------------------------------------------------------------825 Sp Ed Pre-Kgn [Not in Sch] CP CXX 435Non-<strong>School</strong> or Temp NS CXX --Notes:Explanation: CAO= County Alternative/ Opportunity SchCCS= County Community <strong>School</strong>CD= County/District Prgm CJC= County Juvenile Court <strong>School</strong>CP= Other County Prgm [PK] CSE= County Special EdNS= Non-<strong>School</strong>/Prgm or Temp CXX= Not Reported to the State for CBEDSDowntown HS (CBEDS)- This special entry is included because in the CBEDS report to the State,the enrollment of After Six HS (13 students) is included with Downtown HS (260 students).The entry “Downtown HS” reflects this school’s actual enrollment.Ethic RepresentationOther HeadingsCodeLOWAACJKAIFONWDSEthnic Category codes usedLatino (SS=Hispanic)Other WhiteAfrican American (B=Black)ChineseJapaneseKoreanAmerican IndianFilipinoOther Non-White [also includes Arabic,Samoan, South-East Asian (SE & IC)]Declines to StateCodeExplanationNEP/ Non English Proficient (N) orLEP Limited English Proficient (L)----- Also known as English Language Learners (ELL)45% Indicates a predominant Ethnic Category(-) means Equal or Greater than 45%<strong>SFUSD</strong>\RPA (10/15/03) V2.1
<strong>San</strong> <strong>Francisco</strong>Unified <strong>School</strong> District<strong>School</strong>StudentSch# CountPg 1 of 5Ethnic Representation<strong>School</strong> <strong>Site</strong> <strong>List</strong> & <strong>Summary</strong>CBEDS Information Day, October 2, 2002L OW AA C J K AI F ONW45% % % % % % % % % %DS%NEP/LEP%<strong>School</strong> <strong>Site</strong> <strong>Summary</strong> by Grade<strong>SFUSD</strong> Grade: K --- 4,235 24.3 9.8 12.8 25.1 1.2 0.8 0.4 5.6 12.7 7.3 45.0<strong>SFUSD</strong> Grade: 01 --- 4,310 22.9 9.4 13.5 27.6 0.9 0.9 0.6 5.5 12.1 6.6 46.2<strong>SFUSD</strong> Grade: 02 --- 4,326 24.5 9.5 15.5 24.2 1.1 0.8 0.5 5.9 11.3 6.6 43.2<strong>SFUSD</strong> Grade: 03 --- 4,504 22.9 9.2 15.8 30.3 1.0 0.8 0.7 6.2 12.4 0.6 46.9<strong>SFUSD</strong> Grade: 04 --- 4,383 23.7 9.8 15.4 28.1 0.9 1.0 0.6 6.2 13.6 0.7 34.8<strong>SFUSD</strong> Grade: 05 --- 4,515 23.0 9.9 15.6 29.7 0.9 0.7 0.8 6.4 12.4 0.5 30.2<strong>SFUSD</strong> Grade: 06 --- 4,298 22.9 9.1 16.0 30.2 0.8 1.0 0.7 6.7 12.1 0.3 24.1<strong>SFUSD</strong> Grade: 07 --- 4,406 21.9 9.6 17.0 30.5 1.0 0.9 0.7 6.4 11.2 0.7 17.8<strong>SFUSD</strong> Grade: 08 --- 4,385 19.6 10.3 16.7 33.7 1.0 0.8 0.6 6.0 11.0 0.4 19.6<strong>SFUSD</strong> Grade: 09 --- 5,353 20.7 10.1 13.1 34.7 0.7 0.8 0.6 7.2 10.9 1.2 21.7<strong>SFUSD</strong> Grade: 10 --- 4,954 18.9 9.9 14.9 33.7 1.0 0.9 0.5 7.9 10.9 1.7 17.7<strong>SFUSD</strong> Grade: 11 --- 4,396 16.5 11.9 12.8 36.9 0.8 1.1 0.4 7.7 10.9 1.0 18.4<strong>SFUSD</strong> Grade: 12 --- 4,151 16.8 11.8 11.9 36.6 1.0 1.2 0.3 7.8 12.1 0.4 16.6Operational Level <strong>Summary</strong>Elem K-5 <strong>School</strong>s --- 23,869 24.2 8.8 14.7 28.1 1.0 0.6 0.6 6.4 12.2 3.5 42.8Elem K-8 <strong>School</strong>s --- 3,567 17.1 17.7 17.2 21.1 1.1 3.5 1.4 2.4 15.0 3.6 19.8Middle <strong>School</strong>s --- 11,926 21.9 8.8 16.2 32.6 0.9 0.7 0.6 6.7 11.1 0.5 21.1High <strong>School</strong>s --- 18,854 18.4 10.8 13.2 35.3 0.9 1.0 0.5 7.6 11.2 1.1 18.8<strong>School</strong> <strong>Site</strong> Total (114 <strong>School</strong>s)<strong>School</strong> <strong>Site</strong> Total --- 58,216 21.4 10.0 14.7 31.0 0.9 0.9 0.6 6.6 11.8 2.1 29.2CBEDS Report Total+ <strong>School</strong> <strong>Site</strong> Total --- 58,216 21.4 10.0 14.7 31.0 0.9 0.9 0.6 6.6 11.8 2.1 29.2+ SFCOE <strong>School</strong> Total --- 1,305 18.4 20.8 37.6 4.4 0.2 0.4 1.5 3.1 12.9 0.6 7.6CBEDS Report Total --- 59,521 21.3 10.3 15.2 30.4 0.9 0.9 0.6 6.5 11.8 2.1 28.7District/County Total (All Active Students)+ CBEDS Report Total --- 59,521 21.3 10.3 15.2 30.4 0.9 0.9 0.6 6.5 11.8 2.1 28.7+ Other (not CBEDS) --- 199 27.1 27.6 17.1 13.1 -- 0.5 -- 3.5 8.0 3.0 2.0District TOTAL --- 59,720 21.4 10.3 15.2 30.3 0.9 0.9 0.6 6.5 11.8 2.1 28.6<strong>SFUSD</strong>\RPA (10/31/02) V3.0
<strong>San</strong> <strong>Francisco</strong>Unified <strong>School</strong> District<strong>School</strong>StudentSch# CountPg 2 of 5Ethnic Representation<strong>School</strong> <strong>Site</strong> <strong>List</strong> & <strong>Summary</strong>CBEDS Information Day, October 2, 2002L OW AA C J K AI F ONW45% % % % % % % % % %DS%NEP/LEP%Elementary K-5 <strong>School</strong>sAlamo ES 413 694 4.8 24.4 1.4 41.1 4.8 2.0 0.3 2.4 13.8 5.0 29.3Alvarado ES 420 446 41.5 28.3 7.8 1.6 0.2 -- 0.7 2.2 10.3 7.4 25.3Argonne ES 435 373 4.3 26.5 7.8 36.5 1.3 1.1 0.3 1.3 14.5 6.4 34.9Bryant ES 456 221 - 76.0 1.8 4.5 11.3 -- -- 0.9 1.8 1.8 1.8 66.5Buena Vista ES 461 360 - 57.8 18.3 6.1 1.1 -- -- 1.7 0.8 10.0 4.2 38.6Cabrillo ES 467 262 5.3 18.7 7.3 40.1 -- 1.9 0.8 5.0 14.1 6.9 48.1Carmichael ES 449 393 - 22.9 4.3 3.6 2.8 -- -- 0.5 56.0 7.9 2.0 49.1Carver ES 625 314 - 7.0 -- 65.0 0.3 -- -- 4.1 1.3 21.0 1.3 6.1Chavez ES 603 410 - 73.7 2.2 2.4 14.6 -- -- 1.5 2.2 2.7 0.7 71.0Chin ES 872 223 - 2.2 1.3 0.4 72.2 -- -- -- 3.1 17.9 2.7 70.0Chinese Ed Ctr ES 476 88 -- -- -- 96.6 -- -- -- -- 3.4 -- 96.6Clarendon ES 478 579 9.8 33.5 6.2 6.4 16.1 0.3 0.9 2.2 15.9 8.6 14.9Clevel<strong>and</strong> ES 481 345 - 52.8 1.2 12.2 10.1 -- -- 0.3 11.9 10.1 1.4 53.6Cobb ES 525 199 - 13.6 1.5 58.8 7.5 -- 0.5 0.5 4.0 8.5 5.0 11.6De Avila ES 509 269 3.7 10.4 32.7 11.5 15.6 -- -- 4.8 15.6 5.6 21.2Drew ES 507 243 - 6.6 -- 66.3 7.4 -- -- 3.3 0.8 14.0 1.6 9.9El Dorado ES 521 326 13.5 1.2 31.9 28.2 -- -- -- 10.1 11.3 3.7 38.3Fairmount ES 537 327 - 56.9 13.5 11.6 1.2 -- -- 0.9 4.3 7.0 4.6 34.3Flynn ES 680 440 - 66.8 2.0 15.9 2.7 -- -- -- 3.9 6.4 2.3 57.5Garfield ES 562 207 - 9.7 3.4 8.2 65.2 -- -- -- 2.9 6.3 4.3 67.1Glen Park ES 575 309 44.3 3.2 15.2 11.0 0.3 -- 1.0 13.3 9.1 2.6 39.5Golden Gate ES 579 181 - 18.8 0.6 50.3 9.9 -- 0.6 -- 2.2 16.6 1.1 31.5Grattan ES 589 252 10.7 17.1 25.4 15.1 0.4 1.6 0.4 5.6 14.7 9.1 22.2Guadalupe ES 593 412 35.7 2.9 4.6 27.7 -- -- -- 13.1 14.6 1.5 54.1Harte ES 453 340 29.7 1.2 43.5 2.9 -- -- 1.8 1.2 17.6 2.1 31.8Hillcrest ES 614 490 36.9 2.0 10.8 21.2 0.4 -- 0.2 14.9 11.8 1.6 45.1Jefferson ES 644 469 - 3.2 18.3 1.7 48.4 1.7 2.1 -- 1.3 15.4 7.9 34.3Jump Academy ES 655 123 - 1.6 0.8 83.7 -- -- -- 3.3 0.8 4.9 4.9 0.8Key ES 544 504 - 3.6 7.5 1.8 55.4 0.4 1.0 -- 5.4 19.0 6.0 49.8King ES 838 224 34.4 2.7 35.3 3.1 -- -- 0.9 1.8 21.0 0.9 29.5Lafayette ES 664 423 4.5 23.6 3.8 40.7 1.7 1.7 0.9 2.4 15.4 5.4 42.1Lakeshore ES 670 573 13.6 20.4 15.5 26.5 1.4 3.1 0.9 3.3 11.3 3.8 21.1Lau ES 490 665 - 25.4 0.5 1.1 64.1 -- -- -- 1.4 4.1 3.6 82.0Longfellow ES 691 546 25.6 2.4 2.6 29.1 0.2 -- 0.2 29.5 7.3 3.1 50.5Malcolm X ES 830 300 - 6.0 -- 61.7 -- -- -- 2.3 2.7 26.3 1.0 6.7Marshall ES 714 240 - 71.7 2.5 4.2 1.7 -- -- -- 6.3 12.1 1.7 67.1McCoppin ES 549 297 - 5.1 8.8 4.0 52.2 0.7 0.7 0.7 3.4 18.9 5.7 49.8McKinley ES 718 213 39.9 7.5 31.0 1.9 -- -- 0.9 3.3 11.7 3.8 21.6Milk ES 505 232 28.0 19.4 33.2 5.2 -- 0.4 1.7 -- 5.6 6.5 12.5Miraloma ES 722 293 14.0 10.2 23.2 29.0 0.7 -- -- 7.2 10.2 5.5 33.4Mission Ed Ctr ES 724 101 99.0 -- -- -- -- -- -- 1.0 -- -- 81.2Monroe ES 729 462 44.6 1.7 2.8 31.4 -- -- -- 11.7 4.5 3.2 64.9Moscone ES 723 345 - 53.6 1.7 2.3 36.5 -- -- -- 0.9 3.8 1.2 57.4Muir ES 650 283 43.1 3.9 43.5 0.7 -- -- 1.8 0.7 4.9 1.4 33.9New Traditions ES 735 173 9.2 41.6 32.4 0.6 -- -- -- 2.9 6.4 6.9 5.8Ortega ES 746 317 14.2 8.2 28.7 21.1 -- 2.2 -- 9.8 12.3 3.5 37.9<strong>SFUSD</strong>\RPA (10/31/02) V3.0
<strong>San</strong> <strong>Francisco</strong>Unified <strong>School</strong> District<strong>School</strong>StudentSch# CountPg 3 of 5Ethnic Representation<strong>School</strong> <strong>Site</strong> <strong>List</strong> & <strong>Summary</strong>CBEDS Information Day, October 2, 2002L OW AA C J K AI F ONW45% % % % % % % % % %DS%NEP/LEP%Elementary K-5 <strong>School</strong>sParker ES 638 324 - 26.9 0.3 0.9 60.8 -- 0.3 0.3 1.2 5.9 3.4 77.5Parks ES 786 288 10.8 0.7 41.3 31.3 -- -- 0.3 2.4 9.7 3.5 29.2Peabody ES 569 198 - 5.6 14.6 6.6 46.0 -- 0.5 0.5 6.6 17.2 2.5 44.9Redding ES 790 344 21.5 3.8 1.7 37.2 -- -- -- 6.1 28.2 1.5 66.6Revere ES 760 442 41.2 3.8 25.8 2.0 -- -- 1.4 14.9 9.0 1.8 33.5<strong>San</strong>chez ES 816 324 - 61.4 2.2 17.0 4.9 -- -- 1.5 2.8 7.7 2.5 49.7Serra ES 656 275 - 47.3 2.9 11.3 17.8 0.7 -- -- 7.6 8.7 3.6 46.9Sheridan ES 820 305 19.0 2.0 44.3 7.9 -- -- 0.3 14.8 9.8 2.0 27.9Sherman ES 823 385 - 10.4 10.1 4.9 55.3 -- 0.3 0.3 2.3 11.2 5.2 48.1Sloat ES 488 362 12.7 20.2 11.0 34.3 -- 1.7 0.3 3.9 12.4 3.6 30.7Spring Valley ES 834 345 - 30.4 2.6 1.4 48.7 -- 0.3 0.3 2.6 11.0 2.6 83.2Stevenson ES 782 476 - 2.1 10.9 2.3 59.0 1.3 1.3 0.2 4.2 14.5 4.2 45.6Sunnyside ES 842 267 30.0 4.9 9.7 25.8 0.4 -- -- 12.7 13.1 3.4 40.8Sunset ES 750 318 - 8.8 11.3 2.5 46.2 -- 2.5 0.9 6.3 17.0 4.4 47.2Sutro ES 848 255 - 2.7 19.6 4.7 51.0 1.2 0.8 -- 2.7 14.5 2.7 56.5Swett ES 652 293 19.1 3.1 44.4 8.5 -- 0.3 0.7 4.8 16.7 2.4 27.0Taylor ES 513 667 - 24.4 1.2 6.9 46.9 0.1 0.1 -- 7.0 12.0 1.2 56.7Tenderloin ES 859 336 24.1 6.3 11.0 22.6 -- -- -- 7.1 27.7 1.2 55.1Ulloa ES 862 528 - 6.4 11.0 2.5 50.2 1.1 3.4 0.6 5.7 16.1 3.0 42.8Vis Valley ES 867 449 13.8 0.7 16.3 41.4 -- -- 0.2 13.4 12.2 2.0 57.0Webster ES 497 378 39.9 2.1 24.6 23.0 0.3 -- 0.3 1.3 6.6 1.9 41.0West Portal ES 876 560 - 4.8 16.6 3.8 46.4 1.4 0.7 0.4 2.7 18.9 4.3 25.4Yick Wo ES 801 264 - 5.7 9.5 6.4 62.9 1.1 1.1 -- 1.1 9.5 2.7 47.7Elementary K-8 <strong>School</strong>sCreative Arts ES 809 183 8.7 41.0 17.5 -- 1.1 -- 2.2 3.8 17.5 8.2 0.5Lawton Alt K8 676 607 - 6.9 11.9 4.4 46.6 1.0 3.5 0.8 1.8 19.3 3.8 26.0Lilienthal ES 479 648 11.9 30.2 15.1 9.1 1.1 14.2 1.7 1.4 11.0 4.3 9.7Rooftop ES 796 567 24.7 25.4 16.4 11.1 2.1 0.9 1.6 3.2 10.2 4.4 6.3S.F. Community ES 493 309 36.2 12.0 15.9 15.9 0.3 -- 1.9 5.8 10.7 1.3 34.0Treasure Isl<strong>and</strong> ES 852 476 31.9 6.3 20.8 21.8 -- 0.2 0.4 1.7 16.2 0.6 46.4Twenty-First CA ES 858 315 - 12.7 0.6 59.4 5.7 0.3 -- 4.1 2.9 13.3 1.0 14.3Yu Alt ES 485 462 6.9 16.2 5.8 38.3 2.2 1.1 -- 1.3 22.5 5.6 16.7<strong>SFUSD</strong>\RPA (10/31/02) V3.0
<strong>San</strong> <strong>Francisco</strong>Unified <strong>School</strong> District<strong>School</strong>StudentSch# CountPg 4 of 5Ethnic Representation<strong>School</strong> <strong>Site</strong> <strong>List</strong> & <strong>Summary</strong>CBEDS Information Day, October 2, 2002L OW AA C J K AI F ONW45% % % % % % % % % %DS%NEP/LEP%Middle <strong>School</strong>sAptos MS 431 859 24.3 9.8 21.2 24.2 0.2 0.8 0.8 7.9 9.7 1.0 14.4Burbank MS 701 525 34.9 2.5 22.7 11.0 0.2 -- 0.6 11.8 15.8 0.6 22.1Davis MS 641 205 - 12.7 1.0 65.4 -- -- -- 2.9 1.0 17.1 -- 6.8Denman MS 632 708 27.0 3.0 12.6 22.6 0.1 0.3 0.1 28.7 5.6 -- 22.2Everett MS 529 638 - 59.7 3.3 20.2 2.7 -- -- 0.8 7.2 6.0 0.2 41.5<strong>Francisco</strong> MS 546 553 - 12.8 2.5 12.7 47.2 -- 0.2 0.5 11.2 12.5 0.4 34.5Franklin MS 446 375 25.6 2.9 28.8 23.7 0.3 0.3 0.8 5.9 11.2 0.5 40.0Giannini MS 404 1,286 - 6.9 13.2 8.4 51.2 0.9 2.2 0.4 3.7 12.7 0.5 15.0Hoover MS 607 1,252 10.9 17.2 8.1 41.1 3.8 1.0 0.3 2.4 14.4 1.0 10.9King MS 710 539 15.4 1.7 30.6 35.1 -- -- 1.1 8.2 8.0 -- 15.8Lick MS 634 583 - 50.6 12.2 23.3 2.2 0.2 0.2 1.4 2.7 7.0 0.2 24.0Mann MS 618 640 - 72.8 3.6 5.2 7.0 -- -- 0.5 4.7 6.1 0.2 38.9Marina MS 708 1,052 - 9.3 6.6 11.6 59.9 0.4 0.3 0.4 2.7 8.6 0.4 24.3Maxwell MS 773 238 36.1 4.2 37.8 1.7 -- -- 0.8 9.2 9.7 0.4 23.5Presidio MS 778 1,179 - 5.7 19.5 5.0 50.0 2.5 2.0 0.2 2.4 12.0 0.8 13.1Roosevelt MS 797 762 6.6 10.8 19.0 39.0 1.0 0.8 0.9 4.6 16.8 0.5 14.2Vis Valley MS 868 532 16.0 0.9 26.7 29.5 -- -- 0.8 9.6 16.5 -- 22.4High <strong>School</strong>sAfter Six HS 407 16 43.8 18.8 6.3 6.3 -- -- -- 18.8 6.3 -- --Balboa HS 439 1,022 26.9 3.6 24.0 11.1 -- 0.1 0.8 19.9 13.2 0.5 28.0Burton HS 764 1,766 26.7 2.8 18.0 21.1 0.1 0.3 0.3 20.6 9.6 0.6 14.9Downtown HS 742 256 35.5 4.7 32.0 5.1 -- -- 1.2 7.8 13.7 -- 16.4Downtown HS(CBEDS) --- 272 36.0 5.5 30.5 5.1 -- -- 1.1 8.5 13.2 -- 15.4Galileo HS 559 1,808 - 14.2 5.3 13.7 45.2 0.2 0.9 0.4 5.5 13.8 0.8 38.3Gateway HS 565 403 22.6 36.5 11.9 8.4 0.5 0.7 0.7 3.7 11.7 3.2 4.0Independence HS 466 390 31.5 15.1 14.6 12.6 0.3 0.8 1.3 10.5 12.1 1.3 12.8Intl Study Acdy HS 624 498 31.7 7.6 28.5 14.3 -- 0.2 0.6 6.2 10.2 0.6 26.7Leadership HS 678 352 28.1 18.2 20.2 14.5 0.3 -- 0.9 6.5 8.8 2.6 9.1Life Learn Acdy HS 681 30 - 23.3 6.7 53.3 -- -- 3.3 -- 10.0 3.3 -- 10.0Lincoln HS 405 2,568 - 7.1 12.2 5.7 54.4 1.4 1.6 0.4 4.9 11.4 0.9 16.4Lowell HS 697 2,576 - 4.2 17.4 2.2 55.0 1.3 1.7 0.2 4.7 11.9 1.5 0.7Marshall HS 853 1,150 14.9 1.7 28.0 35.7 0.3 0.2 0.7 8.5 9.7 0.3 14.3Mission HS 725 922 44.5 5.9 22.7 10.4 0.1 -- 0.7 8.5 6.4 1.0 37.1Newcomer HS 738 381 - 31.5 2.4 0.3 53.0 -- 1.3 -- 1.3 10.0 0.3 91.6O'Connell HS 651 774 - 69.1 7.1 10.7 3.2 0.1 -- 0.8 4.1 4.0 0.8 18.3Sch of the Arts HS 815 534 14.0 38.8 8.6 12.0 2.1 0.9 0.6 6.7 9.4 6.9 3.7Urban Pioneer HS 863 133 28.6 35.3 18.8 0.8 0.8 -- 1.5 2.3 9.0 3.0 6.0Wallenberg HS 785 655 11.9 7.0 15.4 43.7 1.1 0.9 0.2 4.4 14.2 1.2 16.5Washington HS 571 2,390 - 5.3 13.4 7.6 50.5 2.7 2.0 0.2 4.2 13.4 0.8 17.3Wells HS 743 230 18.7 7.0 42.2 15.7 -- 0.4 0.9 3.9 11.3 -- 13.9<strong>SFUSD</strong>\RPA (10/31/02) V3.0
<strong>San</strong> <strong>Francisco</strong>Unified <strong>School</strong> District<strong>School</strong>StudentSch# CountPg 5 of 5Ethnic Representation<strong>School</strong> <strong>Site</strong> <strong>List</strong> & <strong>Summary</strong>CBEDS Information Day, October 2, 2002L OW AA C J K AI F ONW45% % % % % % % % % %DS%NEP/LEP%SFCOE <strong>School</strong>s/ProgramsCnty Alt/Opp Sch --- 20 - 15.0 10.0 50.0 -- -- -- 10.0 10.0 5.0 -- --Cnty Community Sch --- 653 21.3 9.8 41.2 3.4 -- 0.6 1.4 3.5 18.1 0.8 12.9Cnty Juv Court Sch --- 28 - 17.9 10.7 57.1 7.1 -- -- -- -- 7.1 -- 3.6Cnty Special Ed --- 604 15.4 33.6 32.5 5.6 0.5 0.2 1.5 2.5 7.8 0.5 2.3<strong>SFUSD</strong>\RPA (10/31/02) V3.0
<strong>San</strong> <strong>Francisco</strong><strong>School</strong> <strong>Site</strong> <strong>List</strong> & <strong>Summary</strong>Unified <strong>School</strong> District CBEDS Information Day, October 2, 2002ADDITIONAL INFORMATIONThere are 114 school sites in the <strong>SFUSD</strong> as defined by the <strong>School</strong> Operations Office.There are 4 “schools” that the <strong>School</strong> Operations Office has defined as being part of the <strong>San</strong><strong>Francisco</strong> County Office of Education (SFCOE). The teaching sites (County programs,Instructional Programs, etc.) that comprise these SFCOE schools are listed below.CBEDS<strong>School</strong> District SFCOE StudentNumber Description Grouping <strong>School</strong>s Count616 Hilltop TP CD CAO 20482 Phoenix (MS) CD CD CCS 29483 Phoenix (HS) CD CD CCS 580486 Home Based Ed CD CD CCS 29541 Bay HS CD CD CCS 15688 Log Cabin CS CD CJC 26892 Woodside CS CD CJC 2824 Sp Ed Home Hosp CD CSE 29827 Sp Ed Priv/Parochial CO CSE 199828 Sp Ed State Sp Sch CO CSE 3829 Sp Ed Non-Pub Sch CO CSE 373-------------------------------------------------------------------------------------------------------------------------825 Sp Ed Pre-Kgn [Not in Sch] CP CXX 171Non-<strong>School</strong> or Temp NS CXX 28Notes:Explanation: CAO= County Alternative/ Opportunity SchCD= County/District Prgm CCS= County Community <strong>School</strong>CO= Other County Prgm CJC= County Juvenile Court <strong>School</strong>CP= Other County Prgm [PK] CSE= County Special EdNS= Non-<strong>School</strong>/Prgm or Temp CXX= Not Reported to the State for CBEDSDowntown HS (CBEDS)- This special entry is included because in the CBEDS report to the State,the enrollment of After Six HS (16 students) is included with Downtown HS (256 students).The entry “Downtown HS” reflects this school’s actual enrollment.Edison ES (Sch# 517) is a state charter school <strong>and</strong> is no longer counted as a District <strong>School</strong>.Ethic RepresentationOther HeadingsCodeLOWAACJKAIFONWDSEthnic Category codes usedLatino (SS=Hispanic)Other WhiteAfrican American (B=Black)ChineseJapaneseKoreanAmerican IndianFilipinoOther Non-White [also includes Arabic,Samoan, South-East Asian (SE & IC)]Declines to StateCode ExplanationNEP/ Non English Proficient (N) orLEP Limited English Proficient (L)----- Also known as English Language Learners (ELL)45% Indicates a predominant Ethnic Category(-) means Equal or Greater than 45%<strong>SFUSD</strong>\RPA (10/31/02) V3.0
<strong>San</strong> <strong>Francisco</strong> Unified <strong>School</strong> DistrictPg 1 of 4 10/12/2001 Ver 2.0<strong>School</strong> <strong>Site</strong> <strong>List</strong> & <strong>Summary</strong>CBEDS Information Day, October 2001<strong>School</strong>StudentSch# Count45%Ethnic RepresentationL OW AA C J K AI F ONW% % % % % % % % %DS%NEP/LEP%EDY%<strong>School</strong> <strong>Site</strong> <strong>Summary</strong> by Grade<strong>SFUSD</strong> Grade: K --- 4,329 23.1 9.5 13.4 26.8 1.1 0.9 0.6 5.6 12.3 6.7 45.0 --<strong>SFUSD</strong> Grade: 01 --- 4,401 24.5 9.9 16.2 22.9 1.0 0.8 0.6 5.9 11.3 6.8 41.3 --<strong>SFUSD</strong> Grade: 02 --- 4,535 23.2 9.7 16.0 29.6 1.0 0.8 0.8 6.3 12.2 0.4 45.1 --<strong>SFUSD</strong> Grade: 03 --- 4,479 24.4 9.8 15.4 27.6 1.0 1.0 0.6 6.0 13.8 0.4 44.2 --<strong>SFUSD</strong> Grade: 04 --- 4,631 23.5 10.0 16.1 28.5 0.9 0.8 0.9 6.2 12.5 0.5 37.3 --<strong>SFUSD</strong> Grade: 05 --- 4,503 23.2 10.1 16.2 28.3 0.8 1.0 0.6 7.3 12.3 0.3 32.0 --<strong>SFUSD</strong> Grade: 06 --- 4,428 22.0 9.9 17.3 29.6 1.1 0.9 0.8 6.5 11.2 0.7 19.3 --<strong>SFUSD</strong> Grade: 07 --- 4,438 20.3 10.1 17.1 32.3 1.0 0.8 0.7 6.3 11.0 0.4 20.8 --<strong>SFUSD</strong> Grade: 08 --- 4,427 19.9 11.1 15.0 33.5 0.6 1.0 0.7 7.0 10.8 0.2 21.2 --<strong>SFUSD</strong> Grade: 09 --- 5,130 19.4 10.1 15.4 32.3 1.0 0.8 0.5 7.6 11.2 1.6 19.0 --<strong>SFUSD</strong> Grade: 10 --- 4,785 19.1 11.8 14.3 33.3 0.8 1.0 0.3 7.8 10.8 0.8 20.5 --<strong>SFUSD</strong> Grade: 11 --- 4,768 18.0 10.7 13.5 35.3 0.9 1.0 0.5 7.6 12.0 0.4 21.3 --<strong>SFUSD</strong> Grade: 12 --- 3,704 15.2 11.7 11.5 37.1 1.3 1.0 0.5 7.3 14.1 0.3 16.2 --<strong>SFUSD</strong> Grade: UN --- 8 25.0 25.0 12.5 -- -- -- -- 12.5 -- 25.0 -- --Operational Level <strong>Summary</strong>Elem K-5 <strong>School</strong>s --- 24,415 24.3 9.1 15.4 27.8 1.0 0.6 0.6 6.6 12.2 2.4 42.5 --Elem K-8 <strong>School</strong>s --- 3,582 17.3 18.1 17.8 20.9 1.1 3.5 1.5 2.7 15.0 2.1 20.4 --Middle <strong>School</strong>s --- 12,182 21.1 9.4 16.2 33.1 0.9 0.7 0.6 6.9 10.6 0.4 21.1 --High <strong>School</strong>s --- 18,387 18.1 11.0 13.8 34.3 1.0 1.0 0.4 7.6 11.9 0.8 19.4 --<strong>School</strong> <strong>Site</strong> Total (113 <strong>School</strong>s)<strong>School</strong> <strong>Site</strong> Total --- 58,566 21.3 10.3 15.2 30.5 1.0 0.9 0.6 6.7 11.9 1.5 29.4 --CBEDS Report Total+ <strong>School</strong> <strong>Site</strong> Total --- 58,566 21.3 10.3 15.2 30.5 1.0 0.9 0.6 6.7 11.9 1.5 29.4 --+ Cnty Alt/Opp Schs --- 73 41.1 11.0 30.1 -- -- -- 2.7 5.5 9.6 -- 23.3 --+ Cnty Juv/Com Schs --- 1,004 25.1 9.8 38.2 5.9 -- 0.3 1.7 3.6 14.7 0.7 10.6 --+ Cnty Special Ed --- 778 18.3 37.9 28.3 5.8 0.6 0.1 0.9 2.7 5.1 0.3 2.1 --CBEDS Report Total --- 60,421 21.3 10.7 15.8 29.8 0.9 0.9 0.6 6.6 11.9 1.5 28.8 --District/County Total (All Active Students)+ CBEDS Report Total --- 60,421 21.3 10.7 15.8 29.8 0.9 0.9 0.6 6.6 11.9 1.5 28.8 --+ Other (Not CBEDS) --- 364 28.8 26.6 14.8 16.5 0.5 0.5 0.3 5.2 3.8 2.7 0.3 --District TOTAL --- 60,785 21.4 10.8 15.8 29.7 0.9 0.9 0.6 6.6 11.8 1.5 28.6 --
<strong>San</strong> <strong>Francisco</strong> Unified <strong>School</strong> DistrictPg 2 of 4 10/12/2001 Ver 2.0<strong>School</strong> <strong>Site</strong> <strong>List</strong> & <strong>Summary</strong>CBEDS Information Day, October 2001<strong>School</strong>StudentSch# Count45%Ethnic RepresentationL OW AA C J K AI F ONW% % % % % % % % %DS%NEP/LEP%EDY%Elementary K-5 <strong>School</strong>sAlamo ES 413 689 5.1 26.7 1.7 40.8 3.8 2.3 0.3 2.5 13.9 2.9 30.2 --Alvarado ES 420 450 41.8 31.3 8.4 1.3 0.2 0.2 1.3 2.2 8.9 4.2 22.9 --Argonne ES 435 378 5.0 26.5 8.2 34.7 2.6 1.3 0.3 2.6 14.3 4.5 30.2 --Bryant ES 456 212 = 72.2 2.8 4.7 14.2 -- -- 0.9 2.4 1.9 0.9 67.5 --Buena Vista ES 461 359 = 53.8 22.6 5.8 1.1 0.3 0.3 1.7 0.8 10.9 2.8 31.5 --Cabrillo ES 467 248 - 4.4 18.1 4.8 46.8 0.4 2.4 0.4 4.4 14.1 4.0 54.4 --Carmichael ES 449 399 - 26.1 3.5 4.0 4.5 -- -- 0.8 49.9 9.8 1.5 54.6 --Carver ES 625 319 = 7.5 0.3 62.1 0.3 -- -- 5.3 2.2 20.7 1.6 5.6 --Chavez ES 603 434 = 67.1 3.0 3.7 18.9 -- -- 0.9 2.5 3.5 0.5 72.4 --Chin ES 872 237 = 3.8 1.7 1.7 67.1 0.4 -- -- 3.4 20.3 1.7 78.1 --Chinese Ed Ctr ES 476 57 -- -- -- 94.7 -- -- -- -- 5.3 -- 96.5 --Clarendon ES 478 558 10.4 36.6 6.5 5.7 16.1 0.4 1.1 2.0 16.1 5.2 11.8 --Clevel<strong>and</strong> ES 481 330 = 50.9 1.2 13.0 10.3 -- 0.3 0.3 10.0 13.0 0.9 51.5 --Cobb ES 525 214 = 10.7 2.3 54.2 14.5 -- -- 0.9 5.1 9.3 2.8 17.3 --De Avila ES 509 269 7.4 8.6 32.3 14.9 10.0 -- 0.7 5.9 15.6 4.5 18.2 --Drew ES 507 285 = 8.8 0.7 62.8 6.7 -- 0.4 1.8 1.4 16.1 1.4 8.4 --El Dorado ES 521 349 16.3 1.4 32.4 29.2 -- -- -- 7.7 10.6 2.3 39.3 --Fairmount ES 537 339 = 54.0 11.5 14.2 2.4 -- -- 2.1 5.0 8.3 2.7 33.6 --Flynn ES 680 457 = 60.2 2.0 20.1 3.1 -- -- 0.4 4.4 9.0 0.9 52.5 --Garfield ES 562 220 = 9.5 2.3 11.8 62.7 0.5 -- 0.5 2.3 6.4 4.1 63.6 --Glen Park ES 575 307 - 45.3 2.9 17.6 8.1 0.3 -- 1.3 11.1 11.4 2.0 37.8 --Golden Gate ES 579 235 - 17.0 0.4 47.2 20.0 -- -- -- 1.7 12.3 1.3 34.9 --Grattan ES 589 273 12.5 17.9 24.5 17.2 1.1 2.2 0.4 6.2 11.0 7.0 24.9 --Guadalupe ES 593 416 37.5 2.2 5.5 26.7 -- -- -- 14.2 13.0 1.0 57.2 --Harte ES 453 412 = 26.2 1.0 50.5 3.2 -- -- 1.2 1.5 14.8 1.7 27.4 --Hillcrest ES 614 507 34.3 2.8 12.6 22.1 0.4 -- 0.4 15.6 10.8 1.0 42.4 --Jefferson ES 644 508 - 3.1 20.7 1.0 49.0 1.6 2.6 -- 2.0 15.2 4.9 29.5 --Key ES 544 491 = 3.3 8.8 2.0 55.0 0.4 0.8 -- 5.5 19.6 4.7 50.3 --King ES 838 286 30.8 1.4 43.4 1.7 -- -- 1.4 2.8 17.5 1.0 24.5 --Lafayette ES 664 418 3.8 26.3 2.6 42.8 2.4 1.7 0.7 3.1 13.2 3.3 40.0 --Lakeshore ES 670 587 15.7 21.8 15.5 22.7 2.0 3.1 0.9 3.6 12.1 2.7 21.0 --Lau ES 490 666 = 29.6 0.3 1.1 59.3 0.2 -- -- 1.2 4.7 3.8 81.1 --Longfellow ES 691 565 26.2 2.8 1.9 25.5 -- -- 0.2 34.7 7.1 1.6 42.5 --Malcolm X ES 830 347 = 4.6 -- 60.2 -- -- -- 2.3 1.4 30.0 1.4 8.6 --Marshall ES 714 243 = 70.0 2.9 5.3 1.6 -- -- 0.4 6.6 13.2 -- 70.0 --McCoppin ES 549 294 = 3.4 9.2 5.4 54.1 1.0 0.7 0.7 3.7 18.4 3.4 52.4 --McKinley ES 718 241 41.5 9.5 32.4 2.5 0.4 -- 0.4 2.1 10.0 1.2 23.7 --Milk ES 505 233 29.6 18.9 33.9 5.6 -- -- 1.7 1.3 6.4 2.6 14.2 --Miraloma ES 722 293 14.3 8.9 19.8 35.8 0.7 -- -- 7.5 10.2 2.7 38.6 --Mission Ed Ctr ES 724 108 97.2 -- -- -- -- -- -- -- -- 2.8 88.9 --Monroe ES 729 463 42.3 1.5 3.0 32.8 -- 0.2 0.2 14.7 3.7 1.5 62.6 --Moscone ES 723 351 - 48.4 2.8 4.3 36.8 -- -- -- 2.3 4.8 0.6 58.7 --Muir ES 650 319 39.8 4.7 42.9 0.6 -- -- 0.9 1.6 7.2 2.2 33.2 --New Traditions ES 735 182 10.4 37.4 32.4 1.6 -- -- 2.7 1.6 6.6 7.1 4.9 --Ortega ES 746 340 13.8 5.0 30.9 21.5 -- 0.9 -- 10.6 13.5 3.8 34.1 --Parker ES 638 333 = 33.6 0.3 0.6 57.7 -- 0.3 0.3 0.9 4.2 2.1 82.3 --
<strong>San</strong> <strong>Francisco</strong> Unified <strong>School</strong> DistrictPg 3 of 4 10/12/2001 Ver 2.0<strong>School</strong> <strong>Site</strong> <strong>List</strong> & <strong>Summary</strong>CBEDS Information Day, October 2001<strong>School</strong>StudentSch# Count45%Ethnic RepresentationL OW AA C J K AI F ONW% % % % % % % % %DS%NEP/LEP%EDY%Elementary K-5 <strong>School</strong>sParks ES 786 284 8.8 1.1 35.6 39.4 -- -- 0.4 2.8 8.1 3.9 37.7 --Peabody ES 569 205 - 3.4 15.6 3.9 48.3 -- 2.0 1.0 7.3 16.6 2.0 37.6 --Redding ES 790 324 21.6 3.1 0.3 38.9 -- -- -- 5.9 29.0 1.2 71.6 --Revere ES 760 507 38.7 3.6 26.4 2.6 -- -- 1.0 15.8 9.9 2.2 32.3 --<strong>San</strong>chez ES 816 333 = 57.4 1.2 21.3 6.6 -- -- 1.5 3.9 7.2 0.9 48.6 --Serra ES 656 275 - 47.3 3.6 11.6 17.1 0.4 -- -- 9.1 10.2 0.7 46.9 --Sheridan ES 820 315 20.0 2.9 44.8 7.9 -- -- -- 13.7 10.2 0.6 25.7 --Sherman ES 823 397 = 8.3 10.8 8.1 55.2 0.5 0.3 -- 1.3 11.1 4.5 47.9 --Sloat ES 488 365 14.0 22.2 10.4 30.1 -- 2.5 0.5 4.9 12.9 2.5 29.9 --Spring Valley ES 834 364 33.2 1.9 2.7 44.0 -- -- -- 3.0 12.4 2.7 80.5 --Stevenson ES 782 468 = 2.8 11.8 2.6 57.5 1.3 1.1 0.4 4.7 14.7 3.2 46.4 --Sunnyside ES 842 315 37.5 2.9 11.7 24.4 0.3 -- -- 10.8 11.4 1.0 45.4 --Sunset ES 750 299 - 7.7 10.0 3.3 49.8 0.3 3.7 0.3 6.0 14.0 4.7 48.5 --Sutro ES 848 252 = 2.8 21.0 6.3 50.4 1.6 0.4 -- 2.0 13.5 2.0 53.2 --Swett ES 652 304 20.1 3.0 43.1 8.6 -- 0.3 0.3 6.6 16.1 2.0 23.7 --Taylor ES 513 706 - 24.9 1.3 8.6 45.0 -- 0.1 -- 7.9 11.0 1.0 57.5 --Tenderloin ES 859 299 23.4 6.7 11.4 23.7 -- -- -- 8.0 25.8 1.0 54.8 --Ulloa ES 862 512 - 6.6 12.3 2.1 48.6 1.0 3.7 0.6 5.3 17.2 2.5 45.7 --Vis Valley ES 867 448 14.5 0.4 16.5 41.5 -- -- 0.4 13.4 12.1 1.1 57.1 --Webster ES 497 415 38.6 1.9 24.3 25.8 0.2 -- 1.4 0.7 5.8 1.2 43.9 --West Portal ES 876 552 - 5.1 19.0 3.3 45.1 1.4 0.7 0.2 2.2 19.9 3.1 25.0 --Yick Wo ES 801 255 = 7.1 10.6 6.3 61.6 2.4 1.2 -- 0.8 9.0 1.2 51.8 --Elementary K-8 <strong>School</strong>sCreative Arts ES 809 179 10.1 40.8 20.7 0.6 1.7 -- 3.4 2.8 15.1 5.0 0.6 --Lawton Alt K8 676 583 - 8.2 11.5 4.1 47.3 1.0 3.8 1.2 2.2 18.9 1.7 23.7 --Lilienthal ES 479 623 10.8 31.3 16.1 8.7 1.3 14.8 1.8 2.1 10.8 2.6 8.3 --Rooftop ES 796 568 24.5 26.1 18.3 10.9 2.1 0.9 1.6 2.8 10.2 2.6 6.3 --S.F. Community ES 493 305 36.1 14.1 16.4 15.7 0.3 -- 1.3 5.2 9.8 1.0 33.8 --Treasure Isl<strong>and</strong> ES 852 529 29.3 7.9 15.9 24.4 -- 0.2 0.8 1.9 18.3 1.3 55.0 --Twenty-First CA ES 858 354 = 12.7 0.8 59.6 4.8 0.3 -- 3.4 4.5 13.0 0.8 12.7 --Yu Alt ES 485 441 8.2 17.7 6.6 36.7 2.3 0.9 -- 1.4 23.1 3.2 15.0 --
<strong>San</strong> <strong>Francisco</strong> Unified <strong>School</strong> DistrictPg 4 of 4 10/12/2001 Ver 2.0<strong>School</strong> <strong>Site</strong> <strong>List</strong> & <strong>Summary</strong>CBEDS Information Day, October 2001<strong>School</strong>StudentSch# Count45%Ethnic RepresentationL OW AA C J K AI F ONW% % % % % % % % %DS%NEP/LEP%EDY%Middle <strong>School</strong>sAptos MS 431 820 23.9 10.1 22.0 24.1 0.2 1.0 0.6 8.3 9.1 0.6 15.7 --Burbank MS 701 643 34.8 3.3 20.8 13.7 0.2 -- 0.2 12.9 14.0 0.2 21.9 --Davis MS 641 254 = 9.1 2.0 68.9 0.4 -- -- 3.9 0.8 15.0 -- 7.1 --Denman MS 632 741 25.8 3.4 12.8 22.1 0.1 0.1 -- 30.0 5.5 0.1 23.1 --Everett MS 529 589 = 57.9 4.1 19.7 3.7 -- -- 1.2 7.6 5.8 -- 39.2 --<strong>Francisco</strong> MS 546 558 - 11.5 4.3 12.0 46.2 -- 0.2 0.9 11.1 13.3 0.5 30.6 --Franklin MS 446 442 24.9 1.4 28.3 31.7 0.2 -- 0.9 4.3 7.7 0.7 41.0 --Giannini MS 404 1,306 = 6.8 14.9 8.6 51.4 0.8 2.0 0.5 3.2 11.3 0.5 14.5 --Hoover MS 607 1,301 11.3 17.3 8.8 42.2 3.5 1.1 0.3 2.4 12.4 0.8 11.5 --King MS 710 528 15.0 1.9 37.3 30.1 -- -- 0.6 7.8 7.4 -- 10.6 --Lick MS 634 534 - 49.3 13.5 23.2 2.4 -- 0.2 1.3 3.6 5.8 0.7 25.1 --Mann MS 618 608 = 69.7 4.6 4.6 9.9 -- 0.2 1.0 3.8 6.1 0.2 38.0 --Marina MS 708 1,029 = 10.2 7.0 11.0 60.2 0.4 0.3 0.5 2.6 7.3 0.6 24.2 --Maxell MS (P.Hill) 773 292 43.2 4.1 28.4 2.7 -- -- 0.3 12.0 9.2 -- 32.9 --Presidio MS 778 1,205 - 4.8 20.4 4.4 48.5 2.7 2.3 0.2 2.6 13.4 0.7 11.3 --Roosevelt MS 797 794 6.8 11.2 16.8 42.8 0.9 0.8 0.6 4.3 15.6 0.3 17.8 --Vis Valley MS 868 538 15.2 1.3 23.8 29.2 -- -- 0.7 11.3 18.2 0.2 26.8 --High <strong>School</strong>sAfter Six HS 407 38 34.2 15.8 5.3 28.9 -- -- -- 5.3 10.5 -- 28.9 --Balboa HS 439 951 26.8 3.9 23.1 12.0 -- -- 0.6 21.2 11.9 0.4 28.0 --Burton HS 764 1,557 26.3 2.5 18.3 22.4 0.1 0.1 0.2 22.2 7.6 0.3 19.1 --Downtown HS 742 251 33.9 3.6 31.9 9.2 -- 0.4 0.8 9.2 9.2 2.0 14.3 --Downtown HS(CBEDS) --- 289 33.9 5.2 28.4 11.8 -- 0.3 0.7 8.7 9.3 1.7 16.3 --Galileo HS 559 1,738 - 11.9 4.7 13.4 46.2 0.3 0.7 0.5 5.2 16.7 0.3 37.5 --Gateway HS 565 386 20.7 38.6 12.4 8.0 1.0 0.8 0.8 4.9 10.9 1.8 4.9 --Independence HS 466 321 36.1 14.6 15.3 9.7 0.9 0.3 1.2 11.8 9.3 0.6 8.1 --Intl Study Acdy HS 624 470 34.5 7.4 25.3 15.5 -- -- 1.3 6.8 8.7 0.4 26.4 --Leadership HS 678 346 26.6 18.2 22.8 10.7 -- 0.3 1.2 7.8 9.2 3.2 6.4 --Life Learn Acdy HS 681 52 - 28.8 13.5 46.2 -- -- -- -- 5.8 5.8 -- 9.6 --Lincoln HS 405 2,404 = 6.1 14.4 5.1 52.7 1.7 1.6 0.5 4.5 13.0 0.4 16.8 --Lowell HS 697 2,563 = 5.6 17.8 2.3 52.9 1.4 1.9 0.3 4.9 11.9 1.1 0.7 --Marshall HS 853 993 15.4 2.0 25.9 36.4 0.1 0.1 0.6 9.0 10.5 0.1 8.6 --McAteer HS 630 1,003 27.0 7.7 28.3 17.2 0.1 0.4 0.3 4.8 12.8 1.4 26.4 --Mission HS 725 865 - 47.2 3.7 23.1 9.4 -- -- 0.6 8.4 7.4 0.2 45.3 --Newcomer HS 738 326 - 34.4 2.5 -- 47.2 -- 1.5 -- 1.8 11.7 0.9 93.9 --O'Connell HS 651 528 = 68.0 7.0 9.5 4.4 0.4 -- -- 4.9 5.1 0.8 16.9 --Sch of the Arts HS 815 393 14.5 37.2 7.1 11.2 2.5 1.5 0.8 6.1 13.7 5.3 2.8 --Wallenberg HS 785 653 13.0 7.7 16.7 39.5 0.9 1.2 0.3 4.4 15.5 0.8 10.4 --Washington HS 571 2,275 - 4.7 15.8 8.1 47.3 3.1 2.1 0.3 3.5 14.2 0.9 19.9 --Wells HS 743 274 20.4 6.9 39.4 15.7 -- -- 0.7 3.3 13.5 -- 9.1 --
<strong>San</strong> <strong>Francisco</strong> Unified <strong>School</strong> District <strong>School</strong> <strong>Site</strong> <strong>List</strong> & <strong>Summary</strong>10/12/2001 Ver 2.0 CBEDS Information Day, October 2001ADDITIONAL INFORMATIONThere are 113 school sites in the <strong>SFUSD</strong> as defined by the <strong>School</strong> Operations Office.The teaching sites (County programs, Instructional programs, etc.) that did not meet thedefinition of a <strong>SFUSD</strong> school are listed below.CBEDS<strong>School</strong> District Report StudentNumber Description Grouping Grouping Count616 Hilltop TP CD CAO 73482 Phoenix (MS) CD CD CCS 35483 Phoenix (HS) CD CD CCS 936486 Home Based Ed CD CD CCS 9541 Bay HS CD CD CCS 7688 Log Cabin CS CD CCS 12892 Woodside CS CD CCS 5824 Sp Ed Home Hosp CD CSE 32827 Sp Ed Priv/Parochial CO CSE 313828 Sp Ed State Sp Sch CO CSE 4829 Sp Ed Non-Pub Sch CO CSE 429825 Sp Ed Pre-Kgn [Not in Sch] CP CXX 356Non-<strong>School</strong> or Temp NS CXX 8--------2219Notes:Explanation:CD= County/District Prgm CAO= County Alternative/ Opportunity SchCO= Other County Prgm CCS= County Juvenile Hall/ Community SchCP Other County Prgm [PK] CSE= County Special EdNS= Non-<strong>School</strong>/Prgm or Temp CXX= Not Reported to the State for CBEDSDowntown HS (CBEDS)- This special entry is included because in the CBEDS report to the State,the enrollment of After Six HS (38 students) is included with Downtown HS (251 students).The entry “Downtown HS” reflects this school’s actual enrollment.Edison ES (Sch# 517) is a state charter school <strong>and</strong> is no longer counted as a District <strong>School</strong>.Ethic RepresentationOther HeadingsCodeEthnic Category codes usedCodeExplanationLOWAACJKAIFONWDSLatino (SS=Hispanic)Other WhiteAfrican American (B=Black)ChineseJapaneseKoreanAmerican IndianFilipinoOther Non-White [also includes Arabic,Samoan, South-East Asian (SE & IC)]Declines to StateNEP/LEPEDYNon English Proficient (N) orLimited English Proficient (L)Educationally Disadvantaged Youth-- Students were identified as being EDYbased on their SAT/9 (Math or Reading)or their Brigance test scores.--->[EDY is not yet available]45% Indicates a predominant Ethnic Category(-) means Equal or Greater than 45%(=) means Equal or Greater than 50%
<strong>San</strong> <strong>Francisco</strong> Unified <strong>School</strong> DistrictPg 1 of 4 02/12/2001 Ver 4.0<strong>School</strong> <strong>Site</strong> <strong>List</strong> & <strong>Summary</strong>CBEDS Snapshot, October 2000<strong>School</strong>StudentSch# Count45%Ethnic RepresentationL OW AA C J K AI F ONW% % % % % % % % %DS%NEP/LEP%EDY%<strong>School</strong> <strong>Site</strong> <strong>Summary</strong> by Grade<strong>SFUSD</strong> Grade: K --- 4,429 25.3 10.3 15.5 22.3 1.1 0.9 0.5 5.8 11.4 6.9 40.3 40.9<strong>SFUSD</strong> Grade: 01 --- 4,770 24.8 9.9 16.0 28.2 1.1 0.8 0.7 6.1 12.2 0.2 44.9 33.6<strong>SFUSD</strong> Grade: 02 --- 4,666 25.6 10.1 15.6 26.3 1.1 1.1 0.8 5.8 13.5 0.3 45.6 33.7<strong>SFUSD</strong> Grade: 03 --- 4,789 24.5 10.3 16.6 27.2 1.0 0.9 0.8 6.0 12.6 0.3 45.8 41.4<strong>SFUSD</strong> Grade: 04 --- 4,690 24.1 10.6 16.6 27.2 0.9 0.8 0.6 6.8 12.2 0.3 40.2 43.5<strong>SFUSD</strong> Grade: 05 --- 4,721 23.2 10.7 16.9 27.5 1.1 1.0 0.8 7.2 11.5 0.2 34.2 44.3<strong>SFUSD</strong> Grade: 06 --- 4,492 20.1 10.3 18.0 31.5 1.0 0.9 0.7 6.2 11.0 0.2 25.2 47.7<strong>SFUSD</strong> Grade: 07 --- 4,485 20.2 11.5 15.9 32.2 0.8 0.9 0.8 6.7 10.9 0.1 24.5 45.2<strong>SFUSD</strong> Grade: 08 --- 4,290 20.3 11.4 15.6 30.5 1.2 0.8 0.7 7.5 11.9 0.1 22.6 45.2<strong>SFUSD</strong> Grade: 09 --- 5,349 18.9 12.4 15.8 31.3 0.7 1.0 0.4 7.4 11.4 0.6 22.1 41.4<strong>SFUSD</strong> Grade: 10 --- 4,922 19.1 11.4 14.9 32.0 1.0 1.0 0.5 7.7 12.2 0.2 20.8 47.6<strong>SFUSD</strong> Grade: 11 --- 4,785 18.9 10.8 12.5 33.9 1.1 1.0 0.5 7.9 13.2 0.1 23.7 51.1<strong>SFUSD</strong> Grade: 12 --- 3,578 15.8 13.3 12.0 35.8 1.0 1.3 0.5 8.2 11.9 0.1 17.0 46.4<strong>SFUSD</strong> Grade: UN --- 13 23.1 30.8 30.8 7.7 -- -- -- 7.7 -- -- -- 23.1Operational Level <strong>Summary</strong>Elementary K-5 --- 25,639 25.2 9.6 16.3 26.8 1.0 0.7 0.6 6.6 11.9 1.3 43.5 40.4Elementary K-8 --- 3,458 17.3 19.4 16.2 21.5 1.3 3.1 1.4 3.3 15.6 1.0 20.9 33.3Middle <strong>School</strong>s --- 12,248 20.5 10.2 16.4 32.5 0.9 0.8 0.6 7.0 10.8 0.2 25.0 46.7High <strong>School</strong>s --- 18,634 18.3 11.9 14.0 33.0 0.9 1.1 0.5 7.8 12.2 0.3 21.2 46.5<strong>School</strong> <strong>Site</strong> Total (116 <strong>School</strong>s)<strong>School</strong> <strong>Site</strong> TOTAL --- 59,979 21.7 11.0 15.6 29.6 1.0 1.0 0.6 6.9 12.0 0.7 31.5 43.1District/County Total (All Active Students)District TOTAL --- 62,569 21.8 11.6 16.1 28.7 1.0 0.9 0.6 6.7 11.8 0.7 30.4 41.9CBEDS Report Total+ <strong>School</strong> <strong>Site</strong> TOTAL --- 59,979 21.7 11.0 15.6 29.6 1.0 1.0 0.6 6.9 12.0 0.7 31.5 43.1+ Cnty Alt/Opp Schs --- 62 33.9 4.8 40.3 1.6 1.6 -- -- 11.3 3.2 3.2 22.6 45.2+ Cnty Juv/Com Schs --- 803 23.7 9.1 40.7 7.2 0.1 0.1 1.2 4.2 13.4 0.1 10.5 29.8+ Cnty Special Ed --- 922 19.3 39.2 28.0 4.2 0.1 0.1 0.5 2.4 6.0 0.2 4.7 7.4CBEDS Report TOTAL --- 61,766 21.7 11.4 16.1 28.9 1.0 0.9 0.6 6.8 11.9 0.7 30.8 42.4
<strong>San</strong> <strong>Francisco</strong> Unified <strong>School</strong> DistrictPg 2 of 4 02/12/2001 Ver 4.0<strong>School</strong> <strong>Site</strong> <strong>List</strong> & <strong>Summary</strong>CBEDS Snapshot, October 2000<strong>School</strong>StudentSch# Count45%Ethnic RepresentationL OW AA C J K AI F ONW% % % % % % % % %DS%NEP/LEP%EDY%Elementary K-5 <strong>School</strong>sAlamo ES 413 693 5.3 28.1 2.6 38.8 4.0 2.6 0.3 2.6 14.4 1.2 31.0 16.9Alvarado ES 420 465 43.9 29.5 11.0 1.7 0.2 0.2 1.7 1.9 7.7 2.2 25.8 46.2Argonne ES 435 397 4.8 28.2 8.1 37.8 2.8 0.3 0.3 2.3 13.9 1.8 30.2 23.2Bryant ES 456 226 = 63.7 1.8 7.1 22.1 -- -- 1.3 1.8 2.2 -- 67.3 64.2Buena Vista ES 461 365 - 48.8 25.2 6.6 1.1 0.3 0.3 1.9 1.6 13.7 0.5 28.8 41.6Cabrillo ES 467 277 - 5.4 19.9 3.6 47.3 0.4 2.2 0.7 5.1 14.4 1.1 53.1 33.2Carmichael ES 449 352 33.5 4.3 4.5 5.1 -- -- 0.6 41.5 9.4 1.1 55.1 45.7Carver ES 625 370 = 8.9 1.1 58.9 0.5 -- -- 5.9 3.5 20.3 0.8 5.9 34.1Chavez ES 603 468 = 60.0 3.0 5.1 24.1 -- -- 0.9 3.2 3.4 0.2 76.3 57.9Chin ES 872 234 = 4.7 3.0 0.9 65.8 0.4 -- -- 3.4 20.1 1.7 79.9 39.7Chinese Ed Ctr ES 476 43 -- -- -- 100.0 -- -- -- -- -- -- 86.0 14.0Clarendon ES 478 532 11.3 38.3 7.3 7.1 16.2 0.6 1.1 1.9 13.9 2.3 8.5 18.8Clevel<strong>and</strong> ES 481 345 = 51.6 1.7 12.2 11.6 -- 0.3 0.6 11.9 9.9 0.3 49.3 56.8Cobb ES 525 233 = 12.4 3.9 51.9 18.0 0.4 -- 0.9 3.0 8.6 0.9 19.7 49.4De Avila ES 509 341 6.2 8.8 36.1 20.5 9.1 0.3 1.2 2.9 14.1 0.9 24.3 42.5Drew ES 507 277 = 9.7 2.2 58.1 6.9 -- 0.7 0.7 2.5 18.4 0.7 11.9 50.5Edison ES 517 506 = 52.6 4.5 30.0 1.2 0.2 -- 1.0 0.8 8.9 0.8 40.5 61.5El Dorado ES 521 348 15.8 1.4 31.6 31.6 -- -- -- 8.0 9.8 1.7 43.1 50.3Fairmount ES 537 343 = 54.2 10.2 13.4 2.6 -- 0.3 2.0 7.6 8.2 1.5 35.3 55.4Filipino Ed Ctr ES 542 58 -- -- -- -- -- -- -- 100.0 -- -- 82.8 27.6Flynn ES 680 474 = 57.4 2.5 21.7 3.2 -- -- 1.3 5.5 8.2 0.2 51.5 59.5Garfield ES 562 227 = 14.1 2.2 16.3 53.7 0.4 -- -- 2.2 7.9 3.1 64.8 29.5Glen Park ES 575 308 44.8 4.9 17.5 8.1 -- -- 1.0 12.0 10.1 1.6 39.3 51.9Golden Gate ES 579 278 24.1 0.7 36.7 27.3 -- -- 0.4 0.7 9.0 1.1 53.6 63.3Grattan ES 589 309 12.0 17.8 23.0 22.7 3.2 2.3 0.6 5.5 10.7 2.3 31.7 32.0Guadalupe ES 593 412 38.6 1.9 7.0 26.0 -- -- -- 15.0 10.4 1.0 54.9 41.5Harte ES 453 411 = 29.2 1.0 50.4 3.4 -- -- 1.2 1.2 12.9 0.7 29.9 62.8Hillcrest ES 614 486 35.2 3.9 13.6 21.2 0.4 -- 0.4 14.0 10.9 0.4 43.0 37.9Jefferson ES 644 527 - 3.6 21.8 1.5 46.5 2.3 2.3 -- 1.9 16.3 3.8 38.1 22.0Key ES 544 495 = 3.8 12.1 1.6 52.5 0.4 1.2 0.4 4.8 18.6 4.4 52.5 24.6King ES 838 316 38.3 1.3 41.5 1.9 -- -- 0.3 1.9 14.9 -- 32.0 57.3Lafayette ES 664 470 4.9 27.2 2.8 40.6 1.9 2.1 0.6 3.0 14.0 2.8 39.1 30.6Lakeshore ES 670 579 16.6 24.2 15.5 21.4 2.1 2.8 0.7 3.1 12.6 1.0 15.0 28.0Lau ES 490 661 = 34.2 0.6 1.2 55.4 0.2 -- -- 0.6 4.8 3.0 82.5 37.7Longfellow ES 691 581 26.2 3.6 3.3 21.7 0.2 -- 0.2 37.7 6.5 0.7 37.9 27.9Malcolm X ES 830 384 = 4.4 0.5 59.1 0.3 -- -- 3.1 1.6 30.5 0.5 8.9 63.8Marshall ES 714 260 = 63.8 3.8 6.5 2.7 -- -- -- 7.7 15.4 -- 71.5 55.0McCoppin ES 549 314 = 3.5 11.5 6.4 53.2 1.3 2.5 0.6 3.5 15.3 2.2 50.3 25.2McKinley ES 718 265 40.0 13.2 34.3 1.9 0.4 -- -- 1.1 8.7 0.4 23.4 40.0Milk ES 505 241 32.8 14.9 33.6 5.8 -- 0.4 2.5 0.8 7.1 2.1 20.3 46.5Miraloma ES 722 317 14.2 8.5 23.7 35.0 0.3 0.6 -- 8.5 7.6 1.6 37.5 44.8Mission Ed Ctr ES 724 117 94.0 -- -- -- -- 0.9 -- -- 3.4 1.7 93.2 35.0Monroe ES 729 471 43.5 0.8 3.4 33.3 -- 0.2 -- 14.9 3.0 0.8 61.1 52.4Moscone ES 723 345 - 46.4 3.2 6.1 35.4 -- -- 0.3 2.9 5.5 0.3 61.7 38.0Muir ES 650 312 44.6 4.8 41.3 1.0 -- -- 0.3 1.6 5.4 1.0 37.5 50.0New Traditions ES 735 187 12.8 36.4 33.7 2.7 -- -- 2.7 2.1 9.1 0.5 5.3 40.6Ortega ES 746 378 15.1 3.4 25.4 27.2 -- 0.5 -- 11.1 15.1 2.1 39.4 38.6
<strong>San</strong> <strong>Francisco</strong> Unified <strong>School</strong> DistrictPg 3 of 4 02/12/2001 Ver 4.0<strong>School</strong> <strong>Site</strong> <strong>List</strong> & <strong>Summary</strong>CBEDS Snapshot, October 2000<strong>School</strong>StudentSch# Count45%Ethnic RepresentationL OW AA C J K AI F ONW% % % % % % % % %DS%NEP/LEP%EDY%Elementary K-5 <strong>School</strong>sParker ES 638 365 = 38.6 0.5 1.4 51.5 -- -- 0.3 0.8 4.7 2.2 81.4 51.8Parks ES 786 302 6.3 1.7 39.1 39.4 -- -- -- 2.3 8.6 2.6 39.7 43.7Peabody ES 569 207 - 4.8 17.4 2.4 47.3 -- 1.9 -- 7.2 17.9 1.0 47.8 36.7Redding ES 790 328 20.4 4.9 0.9 39.3 -- -- -- 7.0 27.1 0.3 72.0 36.9Revere ES 760 525 38.1 4.0 27.4 2.1 -- -- 0.8 15.2 11.2 1.1 32.6 60.4<strong>San</strong>chez ES 816 357 = 53.8 0.8 26.6 7.8 -- -- 0.8 4.2 5.6 0.3 51.0 54.6Serra ES 656 289 - 48.8 4.2 12.5 15.6 0.3 -- 0.3 8.0 9.7 0.7 57.8 51.2Sheridan ES 820 361 - 17.2 2.8 49.6 6.9 -- -- 0.3 13.3 10.0 -- 23.3 49.9Sherman ES 823 413 = 9.9 13.8 6.1 50.1 1.2 0.2 -- 1.9 13.6 3.1 45.5 25.9Sloat ES 488 355 14.1 22.8 9.6 31.3 -- 2.8 0.3 4.2 13.8 1.1 30.1 24.2Spring Valley ES 834 394 34.3 2.3 2.5 44.9 0.3 -- -- 2.3 11.2 2.3 79.2 39.8Stevenson ES 782 468 = 2.6 12.8 3.2 53.6 0.9 1.7 -- 6.2 16.7 2.4 45.9 21.2Sunnyside ES 842 318 36.8 3.1 11.0 25.5 0.6 0.9 -- 10.7 11.0 0.3 42.8 41.8Sunset ES 750 277 - 8.3 11.9 4.0 49.8 2.2 4.0 0.4 6.5 11.2 1.8 53.4 27.4Sutro ES 848 255 = 4.7 17.6 7.1 50.2 1.6 0.8 -- 2.4 13.3 2.4 47.8 38.8Swett ES 652 303 20.1 3.3 42.2 9.6 0.3 0.3 -- 6.9 16.2 1.0 29.0 51.2Taylor ES 513 698 25.5 1.6 9.0 43.6 0.1 -- -- 8.6 11.5 0.1 59.0 32.8Tenderloin ES 859 267 24.0 9.4 8.2 23.6 -- -- 0.4 7.9 25.5 1.1 62.9 44.9Ulloa ES 862 488 - 7.4 13.7 2.5 48.8 0.8 3.7 0.4 5.1 16.6 1.0 45.1 22.1Vis Valley ES 867 445 13.5 0.7 17.5 43.8 -- -- 0.7 12.1 11.0 0.7 54.2 44.3Webster ES 497 423 36.4 1.2 24.1 27.2 0.2 -- 1.7 2.4 6.1 0.7 45.9 51.8West Portal ES 876 558 - 6.1 17.6 4.3 45.2 1.3 1.1 -- 2.3 20.4 1.8 30.6 23.8Yick Wo ES 801 245 = 6.5 13.5 9.0 53.1 2.0 1.2 0.4 0.4 13.1 0.8 47.3 22.4Elementary K-8 <strong>School</strong>sCreative Arts ES 809 157 - 10.2 46.5 17.8 0.6 1.9 -- 4.5 4.5 14.0 -- 0.6 41.4Lawton Alt K8 676 596 8.7 12.4 4.7 45.0 1.7 3.4 1.2 2.7 19.3 1.0 22.7 18.6Lilienthal ES 479 589 11.9 31.7 15.8 10.2 1.5 13.4 1.7 2.0 10.7 1.0 8.7 28.7Rooftop ES 796 573 23.2 27.9 18.7 11.2 2.3 0.7 1.7 3.3 10.1 0.9 5.2 27.1S.F. Community ES 493 305 37.7 15.7 14.1 15.1 0.3 -- 1.3 5.6 8.5 1.6 33.8 43.0Treasure Isl<strong>and</strong> ES 852 501 27.9 7.6 9.8 29.1 -- -- 0.2 3.0 21.8 0.6 61.3 50.1Twenty-First CA ES 858 336 = 12.8 2.4 52.7 5.7 0.3 -- 2.4 6.8 16.4 0.6 14.9 54.5Yu Alt ES 485 401 7.5 20.4 9.0 34.4 2.2 1.0 0.2 1.0 22.7 1.5 11.2 21.9
<strong>San</strong> <strong>Francisco</strong> Unified <strong>School</strong> DistrictPg 4 of 4 02/12/2001 Ver 4.0<strong>School</strong> <strong>Site</strong> <strong>List</strong> & <strong>Summary</strong>CBEDS Snapshot, October 2000<strong>School</strong>StudentSch# Count45%Ethnic RepresentationL OW AA C J K AI F ONW% % % % % % % % %DS%NEP/LEP%EDY%Middle <strong>School</strong>sAptos MS 431 810 26.2 9.1 20.1 26.0 0.6 1.0 0.9 6.0 9.8 0.2 18.8 48.4Burbank MS 701 687 34.5 4.2 17.9 17.2 -- -- 0.1 12.8 13.2 -- 32.5 66.7Davis MS 641 309 = 14.6 1.9 61.5 1.3 -- -- 3.2 1.6 15.9 -- 11.7 80.6Denman MS 632 747 29.2 3.5 12.0 18.2 0.1 0.3 0.5 30.1 5.6 0.4 26.6 55.2Everett MS 529 513 = 55.4 3.7 18.5 6.2 -- 0.2 1.2 7.6 7.0 0.2 43.9 66.1<strong>Francisco</strong> MS 546 578 - 11.9 5.4 8.5 46.7 -- -- 0.7 11.8 14.5 0.5 40.3 49.0Franklin MS 446 528 23.5 3.6 28.2 34.1 0.2 0.4 0.6 3.0 6.1 0.4 35.2 46.0Giannini MS 404 1,281 - 6.9 16.2 9.8 47.8 0.9 1.8 0.7 4.0 11.6 0.2 19.7 31.8Hoover MS 607 1,267 10.7 18.3 8.9 41.5 3.5 0.9 0.4 2.9 12.8 0.1 15.8 32.2King MS 710 518 15.4 2.7 34.6 29.9 -- -- 1.0 9.5 6.9 -- 13.7 52.1Lick MS 634 567 - 46.9 14.1 24.3 3.5 0.2 0.2 0.5 2.6 7.4 0.2 28.9 61.6Mann MS 618 600 = 58.3 7.5 6.3 14.0 0.2 0.2 1.0 4.8 7.5 0.2 40.5 63.3Marina MS 708 978 = 9.4 8.2 14.0 55.6 0.5 0.4 0.3 2.0 9.4 0.1 29.1 41.0Potrero Hill MS 773 344 39.8 4.4 31.7 2.3 -- -- 0.6 11.9 9.0 0.3 29.9 65.1Presidio MS 778 1,145 - 4.1 22.6 3.8 47.5 3.3 3.0 0.2 2.5 12.8 0.1 14.7 24.5Roosevelt MS 797 827 7.1 12.1 12.9 44.6 0.8 1.3 0.8 4.7 15.4 0.1 19.8 40.4Vis Valley MS 868 549 12.8 1.3 29.0 30.1 -- -- 0.2 11.5 15.1 0.2 28.8 52.8High <strong>School</strong>sAfter Six HS 407 61 27.9 8.2 18.0 8.2 -- 1.6 -- 23.0 13.1 -- 14.8 41.0Balboa HS 439 1,046 27.1 5.4 22.9 9.4 0.1 0.2 0.9 22.6 11.5 -- 27.8 71.2Burton HS 764 1,674 27.5 3.0 17.8 21.8 0.1 0.1 0.2 21.9 7.4 0.2 19.1 64.0Downtown HS 742 209 27.3 7.7 44.5 5.7 -- -- 2.4 7.2 5.3 -- 6.2 71.8Downtown HS(CBEDS) --- 270 27.4 7.8 38.5 6.3 -- 0.4 1.9 10.7 7.0 -- 8.1 64.8Galileo HS 559 1,826 - 12.0 4.6 12.8 45.8 0.3 0.8 0.2 5.8 17.6 0.1 38.4 54.5Gateway HS 565 285 20.4 42.8 13.0 5.3 0.7 0.4 0.7 3.9 10.5 2.5 5.6 36.8Independence HS 466 261 36.4 20.3 13.0 7.3 1.1 0.4 1.1 10.3 9.6 0.4 7.3 62.8Intl Study Acdy HS 624 482 36.1 8.7 22.2 15.6 0.2 -- 0.8 6.8 8.9 0.6 29.0 60.8Leadership HS 678 344 29.1 22.4 19.5 8.1 -- 0.9 1.2 5.2 12.8 0.9 5.8 39.2Life Learn Acdy HS 681 54 27.8 13.0 44.4 3.7 -- 1.9 -- 3.7 5.6 -- 11.1 75.9Lincoln HS 405 2,416 = 6.0 16.3 5.3 51.0 1.4 1.7 0.4 4.3 13.4 0.1 21.2 42.6Lowell HS 697 2,506 = 7.0 18.6 2.7 51.2 1.6 2.3 0.3 4.4 11.8 0.2 1.7 4.9Marshall HS 853 1,061 14.6 2.5 27.7 33.6 -- 0.1 0.9 10.4 10.1 -- 10.5 65.7McAteer HS 630 1,118 30.3 9.5 27.4 15.4 0.3 0.6 0.8 4.9 10.7 0.1 27.9 58.2Mission HS 725 874 - 49.3 3.7 17.8 11.1 -- -- 0.7 9.2 8.1 0.1 46.3 63.8Newcomer HS 738 339 = 32.7 2.9 -- 55.5 -- 0.6 -- 1.5 6.8 -- 96.2 --O'Connell HS 651 413 = 59.1 10.2 13.3 6.8 -- -- -- 5.1 5.3 0.2 29.3 70.0Sch of the Arts HS 815 410 17.8 39.3 8.5 9.0 2.4 1.5 1.0 6.3 12.7 1.5 2.0 26.1Twain HS 737 63 14.3 11.1 15.9 25.4 1.6 -- -- 11.1 20.6 -- 7.9 74.6Wallenberg HS 785 620 13.4 7.3 16.9 38.1 1.3 1.5 0.2 4.2 16.9 0.3 9.4 43.5Washington HS 571 2,304 4.9 17.2 8.2 44.4 2.9 2.2 0.4 2.9 16.6 0.3 21.4 43.6Wells HS 743 268 22.8 7.8 41.8 13.1 -- 0.4 0.7 2.6 10.4 0.4 7.8 59.3
<strong>San</strong> <strong>Francisco</strong> Unified <strong>School</strong> District<strong>School</strong> <strong>Site</strong> <strong>List</strong> & <strong>Summary</strong>02/12/2001 Ver 4.0 CBEDS Snapshot, October 2000ADDITIONAL INFORMATIONThere are 116 school sites in the <strong>SFUSD</strong> as defined by the <strong>School</strong> Operations Office.The teaching sites (County programs, Instructional programs, etc.) that did not meet thedefinition of a <strong>SFUSD</strong> school are listed below.CBEDS<strong>School</strong> District Report StudentNumber Description Grouping Grouping Count616 Hilltop TP CD CAO 62482 Phoenix (MS) CD CD CCS 7483 Phoenix (HS) CD CD CCS 668486 Home Based Ed CD CD CCS 17541 Bay HS CD CD CCS 13688 Log Cabin CS CD CCS 45892 Woodside CS CD CCS 53824 Sp Ed Home Hosp CD CSE 23827 Sp Ed Priv/Parochial CO CSE 427828 Sp Ed State Sp Sch CO CSE 5829 Sp Ed Non-Pub Sch CO CSE 467825 Sp Ed Not in Sch [Pre-Kgn] CO CXX 792817 Sch Bus. & Commerce NS CXX 11--------2590Explanation:CD= County/District Prgm CAO= County Alternative/ Opportunity SchCO= Other County Prgm CCS= County Juvenile Hall/ Community SchNS= Temp or non-<strong>School</strong> CSE= County Special EdCXX= [-Not Reported]Note:Downtown HS (CBEDS)- This special entry is included because in the CBEDS report to the State,the enrollment of After Six HS (61 students) is included with Downtown HS (209 students).The entry “Downtown HS” reflects this school’s actual enrollment.Ethic RepresentationOther HeadingsCodeEthnic Category codes usedCodeExplanationLOWAACJKAIFONWDSLatino (SS=Hispanic)Other WhiteAfrican American (B=Black)ChineseJapaneseKoreanAmerican IndianFilipinoOther Non-White [also includes Arabic,Samoan, South-East Asian (SE & IC)]Declines to StateNEP/LEPEDYNon English Proficient (N) orLimited English Proficient (L)Educationally Disadvantaged Youth-- Students were identified as being EDYbased on their SAT/9 (Math or Reading)or their Brigance test scores.45% Indicates a predominant Ethnic Category(-) means Equal or Greater than 45%(=) means Equal or Greater than 50%
<strong>San</strong> <strong>Francisco</strong> Unified <strong>School</strong> DistrictPg 1 of 4 03/24/2000<strong>School</strong>District <strong>Summary</strong>StudentSch# Count[Revised]<strong>School</strong> <strong>Site</strong> <strong>List</strong> & <strong>Summary</strong>From <strong>SFUSD</strong> District <strong>and</strong> <strong>School</strong> ProfilesCBEDS Data, October 1999Ethnic RepresentationL OW AA C J K AI F ONW45% % % % % % % % % %NEP/LEP EDY% %<strong>SFUSD</strong> Grade: K --- 4,777 24.5 10.9 15.5 28.3 1.0 0.7 0.7 5.9 12.3 45.3 --<strong>SFUSD</strong> Grade: 01 --- 4,803 25.7 10.8 15.7 25.3 1.1 1.1 0.7 6.0 13.7 45.1 0.9<strong>SFUSD</strong> Grade: 02 --- 4,978 25.5 10.6 16.5 26.2 1.0 0.8 0.8 6.0 12.6 45.4 33.2<strong>SFUSD</strong> Grade: 03 --- 4,764 24.4 10.8 16.5 26.4 0.9 1.0 0.7 6.8 12.5 41.6 30.9<strong>SFUSD</strong> Grade: 04 --- 4,836 23.6 11.1 17.1 26.4 1.1 1.0 0.8 7.0 11.8 39.0 50.0<strong>SFUSD</strong> Grade: 05 --- 4,705 21.2 11.5 17.7 29.4 1.0 0.9 0.6 6.4 11.3 29.6 48.4<strong>SFUSD</strong> Grade: 06 --- 4,542 20.3 12.3 16.2 31.0 0.7 0.9 0.9 6.5 11.2 27.0 49.8<strong>SFUSD</strong> Grade: 07 --- 4,337 20.6 11.8 16.3 29.8 1.1 0.6 0.7 7.5 11.7 24.4 47.1<strong>SFUSD</strong> Grade: 08 --- 4,279 18.4 13.9 16.6 29.8 0.9 1.1 0.4 7.3 11.6 22.4 44.8<strong>SFUSD</strong> Grade: 09 --- 5,308 19.4 12.3 14.9 31.0 0.9 1.1 0.5 7.1 12.8 23.0 43.9<strong>SFUSD</strong> Grade: 10 --- 5,032 19.5 11.8 14.2 30.6 1.1 0.9 0.7 7.5 13.7 22.0 49.6<strong>SFUSD</strong> Grade: 11 --- 4,655 17.9 12.3 12.8 33.7 0.9 1.4 0.6 8.1 12.2 24.5 55.3<strong>SFUSD</strong> Grade: 12 --- 3,867 17.0 12.9 12.5 34.1 1.3 1.4 0.6 8.1 12.1 16.3 51.8<strong>SFUSD</strong> Grade: UN --- 53 35.8 13.2 15.1 24.5 -- -- -- 5.7 5.7 7.5 7.5District <strong>Summary</strong><strong>SFUSD</strong> Sch <strong>Site</strong> TTL --- 60,936 21.5 11.7 15.6 29.3 1.0 1.0 0.7 6.9 12.3 31.5 38.6<strong>SFUSD</strong> -Dist & Cnty --- 1,202 28.3 12.2 33.9 6.8 0.2 0.2 1.2 5.1 12.1 16.4 65.4<strong>SFUSD</strong> -Other Cnty --- 1,632 21.9 34.4 24.9 8.8 0.4 0.2 0.2 2.7 6.4 2.5 12.1<strong>SFUSD</strong> -Temp Sch --- 125 24.8 16.0 23.2 8.8 1.6 0.8 3.2 8.0 13.6 16.0 52.0<strong>SFUSD</strong> District TTL --- 63,895 21.6 12.3 16.2 28.3 1.0 0.9 0.7 6.8 12.1 30.5 38.4District <strong>Summary</strong>Elementary K-5 --- 26,503 24.7 10.2 16.7 27.4 1.0 0.6 0.7 6.7 12.0 42.4 27.6Elementary K-8 --- 3,373 17.5 20.5 15.5 21.3 1.4 3.2 1.3 3.3 16.0 21.4 27.2Middle <strong>School</strong>s --- 12,194 20.1 11.7 16.3 31.1 0.9 0.8 0.6 7.4 11.2 25.7 47.9High <strong>School</strong>s --- 18,866 18.6 12.3 13.7 32.2 1.1 1.2 0.6 7.7 12.7 21.7 49.8
<strong>San</strong> <strong>Francisco</strong> Unified <strong>School</strong> DistrictPg 2 of 4 03/24/2000<strong>School</strong>Elementary K-5 <strong>School</strong>sStudentSch# Count[Revised]<strong>School</strong> <strong>Site</strong> <strong>List</strong> & <strong>Summary</strong>From <strong>SFUSD</strong> District <strong>and</strong> <strong>School</strong> ProfilesCBEDS Data, October 1999Ethnic RepresentationL OW AA C J K AI F ONW45% % % % % % % % % %NEP/LEP EDY% %Alamo ES 413 692 4.2 26.3 2.6 41.0 4.0 2.9 0.1 2.5 16.3 30.2 12.0Alvarado ES 420 464 43.3 29.7 13.8 1.1 0.2 0.2 1.7 1.7 8.2 26.9 31.9Argonne ES 435 400 6.0 27.0 7.8 40.0 4.0 0.3 0.3 2.3 12.5 29.8 19.5Bryant ES 456 239 = 56.1 1.7 13.8 21.8 -- -- 1.3 2.9 2.5 59.0 44.4Buena Vista ES 461 363 42.7 30.0 6.9 0.6 0.3 0.3 1.9 2.8 14.6 28.4 27.0Cabrillo ES 467 316 - 6.0 24.4 4.4 45.3 0.3 1.6 1.9 3.8 12.3 47.5 23.4Carmichael ES 449 393 31.3 4.6 6.6 7.1 -- -- 0.3 41.2 8.9 57.0 30.0Carver ES 625 381 = 10.5 1.6 56.4 0.3 0.3 -- 7.1 4.5 19.4 6.0 28.9Chavez ES 603 504 = 51.4 3.8 7.5 28.8 -- -- 0.6 3.0 5.0 72.6 37.9Chin ES 872 234 = 6.4 5.1 1.3 60.7 0.4 -- -- 4.7 21.4 80.8 26.9Chinese Ed Ctr ES 476 59 -- -- -- 100.0 -- -- -- -- -- 100.0 --Clarendon ES 478 585 14.2 33.5 7.5 8.2 18.1 0.7 0.9 1.9 15.0 8.5 14.0Clevel<strong>and</strong> ES 481 365 = 50.4 2.7 14.2 12.6 -- -- 0.5 11.5 7.9 48.8 35.3Cobb ES 525 249 10.8 5.2 40.2 26.1 0.8 -- 1.2 4.0 11.6 22.9 35.3De Avila ES 509 304 3.6 9.5 37.2 34.5 -- 0.3 -- 3.0 11.8 36.8 35.5Drew ES 507 291 = 10.3 4.1 53.6 5.8 -- 0.7 1.4 3.4 20.6 14.8 32.6Edison ES 517 547 - 47.5 5.7 33.6 0.9 0.5 -- 1.3 1.1 9.3 37.5 33.6El Dorado ES 521 338 14.2 0.9 29.3 34.6 -- -- 0.3 7.1 13.6 44.1 31.4Fairmount ES 537 357 = 51.3 9.5 19.3 3.6 -- 0.3 2.0 5.9 8.1 34.7 34.7Filipino Ed Ctr ES 542 56 -- -- -- -- -- -- -- 100.0 -- 71.4 8.9Flynn ES 680 488 = 55.3 3.9 24.0 2.9 -- -- 1.2 5.5 7.2 50.8 41.8Garfield ES 562 240 = 16.7 2.5 15.0 55.4 1.3 -- -- 1.7 7.5 57.9 27.5Glen Park ES 575 322 - 47.2 6.8 17.7 7.5 -- -- 0.9 11.8 8.1 38.8 34.8Golden Gate ES 579 320 21.3 0.9 34.1 32.8 -- -- 0.6 2.2 8.1 53.1 44.1Grattan ES 589 315 9.5 19.4 24.1 26.0 3.8 0.6 0.6 5.4 10.5 25.1 28.3Guadalupe ES 593 418 35.4 4.1 7.2 24.4 -- -- -- 17.7 11.2 49.8 25.4Harte ES 453 431 - 28.3 1.2 48.7 4.2 -- -- 0.7 1.2 15.8 29.0 40.8Hillcrest ES 614 515 33.8 3.5 15.0 23.1 0.2 -- -- 12.8 11.7 42.1 28.0Jefferson ES 644 515 - 3.7 25.2 1.6 47.6 2.5 1.6 -- 1.7 16.1 38.3 15.1Key ES 544 512 = 3.3 13.3 2.0 53.9 0.4 2.1 0.4 5.9 18.8 47.7 20.9King ES 838 345 42.6 2.6 39.7 1.4 -- -- 0.3 1.7 11.6 34.2 44.1Lafayette ES 664 492 4.9 27.2 3.5 41.7 1.6 2.0 0.6 3.7 14.8 38.4 24.2Lakeshore ES 670 576 19.1 23.1 17.2 19.3 1.6 3.0 0.5 2.8 13.5 12.7 21.2Lau ES 490 680 = 38.2 0.6 1.8 52.8 0.1 -- -- 0.7 5.7 76.9 28.7Longfellow ES 691 577 26.9 4.0 3.5 19.6 -- -- 0.2 39.2 6.8 38.1 17.2Malcolm X ES 830 415 = 5.5 0.5 54.9 0.7 -- -- 4.3 2.7 31.3 7.7 45.5Marshall ES 714 268 = 56.0 4.5 6.3 3.4 -- -- 0.7 8.6 20.5 67.2 40.7McCoppin ES 549 345 = 4.9 13.3 6.1 52.2 1.4 2.9 0.6 4.6 13.9 49.3 18.6McKinley ES 718 261 37.9 15.7 31.8 2.3 -- -- 0.8 0.8 10.7 23.0 32.2Milk ES 505 245 32.2 12.7 38.0 6.1 -- -- 2.4 0.8 7.8 19.6 42.4Miraloma ES 722 323 12.1 10.5 24.8 36.5 0.6 0.6 -- 6.5 8.4 36.2 28.2Mission Ed Ctr ES 724 146 99.3 -- -- 0.7 -- -- -- -- -- 100.0 --Monroe ES 729 453 - 45.3 2.9 2.6 32.2 -- 0.4 0.4 13.5 2.6 63.6 27.8Moscone ES 723 356 - 47.2 3.1 5.9 33.7 -- -- 0.3 2.5 7.3 59.6 23.3Muir ES 650 310 43.2 6.5 39.0 2.3 -- -- 0.6 1.0 7.4 41.0 36.5New Traditions ES 735 190 12.1 37.4 36.8 2.1 0.5 -- 1.6 3.2 6.3 4.7 29.5
<strong>San</strong> <strong>Francisco</strong> Unified <strong>School</strong> DistrictPg 3 of 4 03/24/2000<strong>School</strong>Elementary K-5 <strong>School</strong>sStudentSch# Count[Revised]<strong>School</strong> <strong>Site</strong> <strong>List</strong> & <strong>Summary</strong>From <strong>SFUSD</strong> District <strong>and</strong> <strong>School</strong> ProfilesCBEDS Data, October 1999Ethnic RepresentationL OW AA C J K AI F ONW45% % % % % % % % % %NEP/LEP EDY% %Ortega ES 746 408 12.7 3.9 29.4 31.4 0.5 1.5 0.2 6.9 13.5 38.7 22.1Parker ES 638 371 = 36.1 1.6 1.6 55.5 -- -- 0.5 1.1 3.5 80.6 33.2Parks ES 786 345 4.1 2.6 38.3 42.0 0.3 -- -- 3.2 9.6 40.0 24.9Peabody ES 569 238 - 5.0 18.9 3.4 46.6 -- 1.3 -- 5.5 19.3 42.0 26.1Redding ES 790 358 16.5 5.9 2.0 41.6 -- -- -- 6.4 27.7 63.4 23.5Revere ES 760 553 37.8 3.8 27.1 2.7 0.2 -- 0.5 16.5 11.4 31.3 36.9<strong>San</strong>chez ES 816 390 - 46.9 1.3 30.0 9.2 -- -- 0.5 3.6 8.5 47.4 41.0Serra ES 656 286 - 47.9 2.8 13.3 15.0 0.3 -- -- 10.5 10.1 55.9 34.3Sheridan ES 820 360 19.7 2.8 44.7 6.9 -- -- 0.8 13.9 11.1 24.4 31.7Sherman ES 823 455 10.5 19.1 8.6 44.4 1.5 0.7 0.2 2.2 12.7 40.4 17.8Sloat ES 488 364 13.7 22.0 9.6 32.4 -- 2.7 0.3 4.1 15.1 25.8 18.4Spring Valley ES 834 409 - 34.5 1.2 3.7 46.5 -- -- -- 2.2 12.0 80.2 31.5Stevenson ES 782 479 = 4.2 15.0 3.3 52.4 0.6 1.9 -- 6.9 15.7 45.3 16.9Sunnyside ES 842 337 38.3 4.2 8.6 28.2 0.9 0.9 0.9 8.6 9.5 46.6 27.3Sunset ES 750 235 - 8.9 14.0 6.0 48.1 1.7 5.5 -- 6.0 9.8 50.2 17.9Sutro ES 848 285 - 4.6 20.4 9.5 48.4 0.7 0.7 0.7 2.5 12.6 49.5 21.4Swett ES 652 334 15.6 6.0 43.4 9.9 0.6 0.3 -- 7.8 16.5 26.6 34.7Taylor ES 513 694 26.4 2.2 9.5 41.4 -- -- -- 10.2 10.4 54.9 25.5Tenderloin ES 859 216 24.1 11.6 9.3 27.8 -- -- 0.5 6.5 20.4 66.2 14.8Ulloa ES 862 509 - 7.5 14.5 3.1 49.1 0.6 3.1 0.2 6.3 15.5 44.6 15.7Vis Valley ES 867 458 - 13.3 0.7 16.4 46.9 -- -- 0.4 12.4 9.8 52.8 31.4Webster ES 497 438 37.9 1.8 20.8 29.0 0.5 -- 1.1 2.5 6.4 48.4 32.9West Portal ES 876 543 - 8.3 17.5 4.6 46.8 1.8 0.9 -- 2.0 18.0 28.4 16.4Yick Wo ES 801 243 - 7.0 17.7 9.1 49.4 1.6 1.2 0.4 0.4 13.2 41.2 21.8Elementary K-8 <strong>School</strong>sCreative Arts ES 809 117 - 12.0 48.7 12.8 3.4 3.4 -- 5.1 1.7 12.8 -- 26.5Lawton Alt K8 676 631 8.7 15.7 5.4 42.5 1.6 3.3 1.1 3.3 18.4 21.1 15.8Lilienthal ES 479 584 11.3 33.7 16.6 10.1 1.4 13.4 1.2 1.7 10.6 7.9 19.5Rooftop ES 796 570 23.0 30.0 18.9 11.2 2.5 0.4 1.8 3.0 9.3 6.7 26.3S.F. Community ES 493 300 35.7 18.7 17.3 12.7 0.3 -- 1.3 6.0 8.0 31.0 37.3Treasure Isl<strong>and</strong> ES 852 477 29.6 6.7 3.1 30.8 -- 0.4 0.2 2.9 26.2 67.3 38.2Twenty-First CA ES 858 335 = 14.6 2.1 50.1 5.4 0.3 0.3 2.4 6.3 18.5 15.5 47.8Yu Alt ES 485 359 7.2 20.3 9.7 34.0 2.2 1.1 0.3 1.9 23.1 11.1 18.7
<strong>San</strong> <strong>Francisco</strong> Unified <strong>School</strong> DistrictPg 4 of 4 03/24/2000<strong>School</strong>Middle <strong>School</strong>sStudentSch# Count[Revised]<strong>School</strong> <strong>Site</strong> <strong>List</strong> & <strong>Summary</strong>From <strong>SFUSD</strong> District <strong>and</strong> <strong>School</strong> ProfilesCBEDS Data, October 1999Ethnic RepresentationL OW AA C J K AI F ONW45% % % % % % % % % %NEP/LEP EDY% %Aptos MS 431 723 29.6 9.0 20.2 20.7 0.4 1.0 1.2 7.1 10.8 19.2 47.3Burbank MS 701 704 33.4 3.8 18.2 19.7 -- -- -- 13.4 11.5 35.4 65.6Davis MS 641 357 = 20.2 3.4 52.1 2.0 -- -- 4.2 2.5 15.7 16.8 78.4Denman MS 632 753 30.0 3.3 12.7 16.7 0.1 0.1 0.4 29.9 6.6 25.5 56.8Everett MS 529 518 = 50.4 5.2 19.9 7.9 -- -- 1.0 6.4 9.3 48.6 66.0<strong>Francisco</strong> MS 546 557 - 11.8 6.3 7.9 46.5 -- -- 0.9 10.1 16.5 39.0 53.9Franklin MS 446 568 20.4 3.7 28.5 38.7 0.2 0.2 0.4 2.3 5.6 42.8 47.5Giannini MS 404 1,273 7.1 19.8 9.3 44.5 0.9 1.6 0.9 3.7 12.1 17.6 30.3Hoover MS 607 1,276 10.5 20.1 8.7 40.1 3.1 1.2 0.3 3.4 12.6 15.0 32.6King MS 710 512 16.2 2.7 33.0 29.3 -- -- 0.8 9.2 8.8 19.1 57.0Lick MS 634 504 - 46.6 14.7 25.2 3.8 0.2 -- 0.2 2.8 6.5 25.0 64.3Mann MS 618 615 - 47.0 11.4 7.0 16.1 0.5 0.2 0.8 7.8 9.3 35.8 60.5Marina MS 708 896 = 9.9 9.6 14.4 51.1 0.3 0.4 0.3 2.9 10.9 26.7 42.0Potrero Hill MS 773 448 40.6 7.1 29.7 1.8 0.2 -- 0.7 12.3 7.6 32.1 71.0Presidio MS 778 1,138 4.3 26.4 4.0 44.4 2.9 2.8 -- 2.7 12.4 15.9 25.7Roosevelt MS 797 815 - 4.9 14.0 11.9 46.3 0.9 2.0 0.2 4.9 15.0 22.3 38.8Vis Valley MS 868 537 14.0 2.2 27.4 28.7 -- -- 0.2 12.3 15.3 33.0 61.6High <strong>School</strong>sAfter Six HS 407 57 22.8 12.3 17.5 8.8 1.8 1.8 -- 22.8 12.3 19.3 61.4Balboa HS 439 1,187 28.3 5.1 21.9 8.9 0.2 0.1 0.8 24.3 10.4 29.3 76.4Burton HS 764 1,631 28.5 3.3 19.2 20.6 0.1 -- 0.4 20.6 7.3 18.3 63.5Downtown HS 742 203 36.5 7.4 36.5 1.5 0.5 -- 1.0 5.9 10.8 19.2 87.7Galileo HS 559 1,843 13.5 5.8 11.3 44.9 0.3 0.8 0.3 5.4 17.9 36.8 60.5Gateway HS 565 182 - 20.9 46.2 9.3 4.4 -- -- 1.1 4.4 13.7 7.7 36.3Independence HS 466 369 29.8 21.7 15.4 11.4 0.3 1.6 0.8 8.4 10.6 11.9 69.6Intl Study Acdy HS 624 492 35.2 12.2 19.5 16.1 0.4 -- 1.8 5.1 9.8 27.8 67.1Leadership HS 678 265 25.7 23.4 23.0 7.2 0.4 1.1 1.9 6.0 11.3 6.8 38.9Life Learn Acdy HS 681 21 = 19.0 4.8 57.1 4.8 -- 4.8 4.8 -- 4.8 4.8 81.0Lincoln HS 405 2,453 - 6.5 16.3 5.6 49.2 1.6 2.0 0.4 4.3 14.0 22.3 42.8Lowell HS 697 2,543 - 9.2 17.9 4.1 47.1 1.5 2.4 0.4 4.6 12.9 1.5 7.9Marshall HS 853 1,077 17.4 2.6 28.6 31.4 0.1 0.1 0.7 9.1 10.1 8.7 64.1McAteer HS 630 1,139 31.2 11.1 24.4 17.2 0.2 0.4 0.4 4.2 11.0 33.1 68.7Mission HS 725 866 43.9 3.3 15.5 15.7 0.1 0.1 1.0 9.8 10.5 45.7 72.5Newcomer HS 738 370 43.2 1.9 -- 43.8 -- 0.3 -- 0.8 10.0 100.0 --O'Connell HS 651 330 43.0 15.2 15.5 13.3 0.3 -- 1.5 3.6 7.6 25.5 73.0Sch of the Arts HS 815 407 17.7 36.9 10.3 11.1 3.7 1.5 1.7 5.2 12.0 3.7 31.0Twain HS 737 183 15.3 13.1 13.7 26.2 0.5 1.6 0.5 10.9 18.0 8.2 66.1Wallenberg HS 785 618 16.7 7.8 15.0 36.2 1.6 1.6 0.3 5.5 15.2 8.1 46.9Washington HS 571 2,392 4.2 18.9 8.7 43.0 3.1 2.3 0.5 2.7 16.7 20.5 43.4Wells HS 743 238 23.5 7.1 42.0 10.9 0.4 0.8 0.8 2.9 11.3 13.9 81.1
<strong>San</strong> <strong>Francisco</strong> Unified <strong>School</strong> District<strong>School</strong> <strong>Site</strong> <strong>List</strong> & <strong>Summary</strong>03/24/2000 [Revised] From <strong>SFUSD</strong> District <strong>and</strong> <strong>School</strong> ProfilesCBEDS Data, October 1999ADDITIONAL INFORMATIONStudents at a teaching site that the <strong>School</strong> OperationsOffice has NOT defined as a school site.Profile Grp Original StudentGrouping Code Sch# Describe CountDist/Cnty PrgmOther CountyTemp <strong>School</strong>CD 482 Noriega CD 32CD 483 Golden Gate CD 991CD 486 Home Based Ed CD 23CD 541 Bay HS CD 4CD 616 Hilltop TP 86CD 688 Log Cabin CS 26CD 824 Sp Ed Home Hosp 40------1202CO 825 Sp Ed Not in Sch 656CO 827 Sp Ed Priv/Paroch 590CO 828 Sp Ed State Sp Sch 8CO 829 Sp Ed Non-Pub Sch 378------1632NS 402 MS Operations 37NS 403 HS Operations 81NS 884 Old Wilson HS 7------125Ethic RepresentationOther HeadingsCodeEthnic Category codes usedCodeExplanationLOWAACJKAIFONWLatino (SS=Hispanic)Other WhiteAfrican American (B=Black)ChineseJapaneseKoreanAmerican IndianFilipinoOther Non-White (also includesArabic, Samoan, Indo-Chinese)NEP/LEPEDYNon English Proficient orLimited English ProficientEducationally Disadvantaged Youth45% One Ethnic Category exceeds 45%(-) means Equal or Greater than 45%(=) means Equal or Greater than 50%
<strong>San</strong> <strong>Francisco</strong> Unified <strong>School</strong> DistrictPg 1 of 4 01/20/2000<strong>School</strong>District <strong>Summary</strong>StudentSch# Count<strong>School</strong> <strong>Site</strong> <strong>List</strong> & <strong>Summary</strong>From <strong>SFUSD</strong> District <strong>and</strong> <strong>School</strong> ProfilesCBEDS Data, October 1998Ethnic RepresentationL OW AA C J K AI F ONW45% % % % % % % % % %NEP/LEP EDY% %<strong>SFUSD</strong> Grade: K --- 4,804 26.0 10.9 15.3 25.1 1.0 1.0 0.7 6.1 13.8 44.9 --<strong>SFUSD</strong> Grade: 01 --- 5,094 25.8 10.9 16.6 25.7 1.1 0.9 0.9 5.8 12.4 45.2 0.5<strong>SFUSD</strong> Grade: 02 --- 4,900 24.5 11.3 17.0 25.6 0.8 0.9 0.7 6.6 12.8 44.5 27.3<strong>SFUSD</strong> Grade: 03 --- 4,946 23.6 11.7 17.1 25.7 1.1 1.0 0.7 7.2 11.8 43.0 34.0<strong>SFUSD</strong> Grade: 04 --- 4,753 21.1 11.8 18.1 28.7 1.0 1.0 0.6 6.3 11.5 38.0 44.6<strong>SFUSD</strong> Grade: 05 --- 4,753 21.6 13.0 16.3 29.2 0.7 0.9 0.8 6.7 10.8 29.7 49.1<strong>SFUSD</strong> Grade: 06 --- 4,354 21.6 11.9 16.3 28.4 1.1 0.6 0.7 7.4 12.0 28.1 48.3<strong>SFUSD</strong> Grade: 07 --- 4,298 19.0 14.2 17.4 28.3 0.8 1.2 0.4 7.3 11.4 24.1 47.2<strong>SFUSD</strong> Grade: 08 --- 4,332 19.2 13.0 16.9 28.6 0.9 0.9 0.6 7.0 12.8 23.3 45.6<strong>SFUSD</strong> Grade: 09 --- 5,297 18.7 12.0 15.4 29.6 1.0 1.0 0.8 7.5 14.0 22.5 41.0<strong>SFUSD</strong> Grade: 10 --- 4,923 19.4 12.1 15.2 30.4 0.8 1.2 0.7 8.0 12.2 22.1 43.1<strong>SFUSD</strong> Grade: 11 --- 5,024 19.0 11.9 14.0 32.2 1.1 1.3 0.6 8.2 11.6 24.7 41.3<strong>SFUSD</strong> Grade: 12 --- 3,572 14.6 13.4 11.7 33.7 1.4 1.7 0.4 10.0 13.2 14.3 40.1<strong>SFUSD</strong> Grade: UN --- 4 50.0 -- 25.0 25.0 -- -- -- -- -- 25.0 --District <strong>Summary</strong><strong>SFUSD</strong> Sch <strong>Site</strong> TTL --- 61,054 21.3 12.1 16.0 28.4 1.0 1.0 0.7 7.2 12.3 31.6 35.1<strong>SFUSD</strong> -Dist & Cnty --- 1,061 28.6 13.5 33.3 4.9 0.3 0.4 0.8 4.6 13.8 16.7 66.8<strong>SFUSD</strong> -Other Cnty --- 1,635 20.8 34.9 26.2 8.1 0.2 0.2 0.4 2.6 6.5 2.9 16.8<strong>SFUSD</strong> -Temp Sch --- 175 28.6 14.9 22.9 6.3 0.6 0.6 1.7 20.0 4.6 12.0 47.4<strong>SFUSD</strong> District TTL --- 63,925 21.4 12.7 16.6 27.5 1.0 1.0 0.7 7.0 12.2 30.6 35.2District <strong>Summary</strong>Elementary K-5 --- 26,937 24.2 11.0 16.9 27.0 0.9 0.7 0.7 6.8 11.8 42.2 25.8Elementary K-8 --- 3,149 17.7 20.0 15.8 21.5 1.3 3.2 1.2 3.0 16.2 23.4 26.7Middle <strong>School</strong>s --- 12,152 20.3 12.2 16.7 29.1 1.0 0.9 0.6 7.4 11.8 26.1 47.7High <strong>School</strong>s --- 18,816 18.2 12.3 14.3 31.3 1.1 1.3 0.7 8.3 12.7 21.4 41.5
<strong>San</strong> <strong>Francisco</strong> Unified <strong>School</strong> DistrictPg 2 of 4 01/20/2000<strong>School</strong>Elementary K-5 <strong>School</strong>sStudentSch# Count<strong>School</strong> <strong>Site</strong> <strong>List</strong> & <strong>Summary</strong>From <strong>SFUSD</strong> District <strong>and</strong> <strong>School</strong> ProfilesCBEDS Data, October 1998Ethnic RepresentationL OW AA C J K AI F ONW45% % % % % % % % % %NEP/LEP EDY% %Alamo ES 413 703 4.6 27.5 2.0 40.5 3.7 3.7 -- 1.8 16.2 30.7 13.1Alvarado ES 420 458 42.8 28.8 14.0 1.5 0.2 0.2 1.3 1.5 9.6 29.3 26.4Argonne ES 435 390 6.7 26.7 8.5 38.7 4.1 0.5 0.3 1.5 13.1 28.5 17.2Bryant ES 456 258 - 49.6 3.9 15.5 22.1 0.4 0.4 1.9 2.3 3.9 58.9 37.6Buena Vista ES 461 362 39.2 33.1 8.3 0.6 0.3 0.3 1.9 2.8 13.5 23.5 27.3Cabrillo ES 467 348 5.7 23.0 4.3 44.5 0.3 1.4 1.4 4.0 15.2 46.6 21.3Carmichael ES 449 399 - 26.1 4.0 3.8 7.5 -- 0.5 0.8 45.4 12.0 59.9 25.8Carver ES 625 391 - 13.0 2.0 49.4 0.5 0.3 -- 9.2 5.4 20.2 8.2 31.2Chavez ES 603 530 - 47.7 4.9 8.7 28.5 -- -- 0.8 2.8 6.6 69.2 28.1Chin ES 872 235 = 8.5 6.8 3.8 51.9 0.4 -- -- 4.7 23.8 72.8 15.3Chinese Ed Ctr ES 476 97 -- -- -- 96.9 -- -- -- -- 3.1 100.0 --Clarendon ES 478 580 13.6 33.8 7.1 8.4 17.9 0.9 0.7 1.9 15.7 8.6 16.9Clevel<strong>and</strong> ES 481 353 - 48.7 3.4 16.1 12.2 -- -- 0.3 12.5 6.8 52.4 31.4Cobb ES 525 260 10.4 5.8 39.2 31.2 0.8 -- 0.8 3.8 8.1 25.4 32.7Creative Arts ES 809 96 12.5 41.7 7.3 6.3 2.1 -- 4.2 3.1 22.9 3.1 6.3De Avila ES 509 328 3.4 10.1 30.8 44.5 0.3 0.9 0.3 2.7 7.0 41.8 33.5Drew ES 507 288 - 13.5 7.3 45.1 6.3 -- 0.7 1.7 3.5 21.9 14.9 28.5Edison ES 517 465 40.2 6.0 39.1 2.4 0.2 -- 0.6 3.4 8.0 34.6 30.1El Dorado ES 521 349 15.5 1.7 32.1 27.8 -- -- 0.3 8.3 14.3 39.0 37.5Fairmount ES 537 357 - 48.2 9.5 26.9 3.1 -- -- 0.8 5.0 6.4 32.2 35.9Filipino Ed Ctr ES 542 46 -- -- -- -- -- -- -- 100.0 -- 82.6 4.3Flynn ES 680 517 - 48.7 5.0 28.6 3.5 -- -- 1.0 5.8 7.4 45.5 34.6Garfield ES 562 250 = 22.0 4.0 17.2 50.0 -- -- -- 2.0 4.8 58.4 30.0Glen Park ES 575 323 - 47.4 6.5 21.7 8.4 -- -- 0.6 7.7 7.7 42.4 28.8Golden Gate ES 579 382 19.4 0.8 32.5 37.2 -- -- 0.3 2.6 7.3 59.7 39.3Grattan ES 589 342 12.6 20.8 19.6 29.8 2.6 0.6 -- 5.0 9.1 35.1 26.9Guadalupe ES 593 424 33.0 4.0 8.5 21.9 -- -- -- 21.5 11.1 47.9 36.8Harte ES 453 439 = 30.3 0.9 50.6 3.4 0.2 -- 0.5 2.3 11.8 28.0 40.1Hillcrest ES 614 539 32.3 3.3 18.9 19.7 0.2 -- -- 14.8 10.8 39.1 28.2Jefferson ES 644 513 - 3.1 28.1 1.8 46.4 1.6 1.6 -- 1.9 15.6 37.0 11.9Key ES 544 545 - 3.1 16.1 2.9 46.8 0.6 2.6 0.4 5.5 22.0 46.8 22.4King ES 838 353 - 46.5 4.0 38.0 0.6 -- -- 1.1 1.4 8.5 38.2 39.4Lafayette ES 664 497 4.6 27.8 4.2 40.2 1.4 1.8 0.4 2.8 16.7 41.2 19.7Lakeshore ES 670 575 20.3 24.9 16.9 18.1 1.2 3.1 1.0 2.4 12.0 13.2 22.3Lau ES 490 692 - 40.2 0.9 1.9 49.6 0.1 -- 0.1 1.3 5.9 73.0 20.2Longfellow ES 691 537 28.1 3.7 3.5 18.4 -- -- 0.2 39.5 6.5 41.3 12.3Malcolm X ES 830 443 = 7.0 2.5 51.7 0.7 -- -- 3.4 2.5 32.3 10.4 43.1Marshall ES 714 280 - 49.6 4.3 7.5 5.4 -- -- 0.7 12.1 20.4 67.1 29.6McCoppin ES 549 353 - 5.9 14.7 7.4 49.6 0.8 2.3 -- 4.2 15.0 41.9 19.8McKinley ES 718 258 38.0 16.3 31.8 4.3 -- -- 0.8 0.4 8.5 21.7 34.5Milk ES 505 252 35.7 11.9 34.9 6.0 -- -- 2.8 1.6 7.1 20.2 41.3Miraloma ES 722 350 15.1 7.1 25.7 38.0 0.6 0.9 0.3 4.9 7.4 36.9 25.1Mission Ed Ctr ES 724 131 97.7 1.5 -- 0.8 -- -- -- -- -- 98.5 --Monroe ES 729 460 - 45.0 3.7 1.1 32.0 -- 0.4 -- 14.8 3.0 60.9 23.7Moscone ES 723 353 - 45.9 3.7 5.9 32.6 -- -- 0.8 2.5 8.5 59.2 24.9Muir ES 650 292 - 46.2 9.6 32.5 2.1 0.3 -- 0.3 1.0 7.9 48.3 27.1
<strong>San</strong> <strong>Francisco</strong> Unified <strong>School</strong> DistrictPg 3 of 4 01/20/2000<strong>School</strong>Elementary K-5 <strong>School</strong>sStudentSch# Count<strong>School</strong> <strong>Site</strong> <strong>List</strong> & <strong>Summary</strong>From <strong>SFUSD</strong> District <strong>and</strong> <strong>School</strong> ProfilesCBEDS Data, October 1998Ethnic RepresentationL OW AA C J K AI F ONW45% % % % % % % % % %NEP/LEP EDY% %New Traditions ES 735 192 14.1 31.8 38.5 1.6 0.5 -- 1.6 4.7 7.3 5.2 28.6Ortega ES 746 427 11.7 5.6 30.2 31.6 0.9 2.1 0.7 6.8 10.3 35.8 26.0Parker ES 638 362 = 37.6 2.2 2.8 51.7 -- 0.3 -- 0.8 4.7 76.8 25.7Parks ES 786 342 4.1 3.5 36.0 43.9 0.6 -- -- 2.6 9.4 43.9 26.3Peabody ES 569 262 - 5.3 20.6 3.1 45.0 0.8 1.5 0.4 3.4 19.8 48.1 23.7Redding ES 790 381 12.9 8.4 1.3 43.0 -- -- -- 7.3 27.0 69.6 22.8Revere ES 760 558 41.9 4.1 27.4 2.5 0.2 -- 0.7 14.7 8.4 31.9 32.4<strong>San</strong>chez ES 816 378 - 47.4 1.6 28.3 10.1 -- -- 0.8 3.7 8.2 47.1 36.5Serra ES 656 278 - 45.3 2.9 13.3 15.5 0.4 -- 0.4 12.6 9.7 53.6 24.8Sheridan ES 820 369 20.9 2.2 44.4 7.6 -- 0.3 0.8 12.7 11.1 25.5 25.2Sherman ES 823 469 11.1 20.9 7.7 44.8 1.1 0.6 0.2 2.8 10.9 36.7 14.9Sloat ES 488 369 12.7 22.2 12.2 28.5 -- 2.2 -- 5.4 16.8 26.0 22.8Spring Valley ES 834 442 = 30.1 1.4 4.8 50.5 -- 0.2 -- 1.6 11.5 71.0 23.8Stevenson ES 782 488 - 6.4 17.8 4.1 46.7 1.0 2.7 0.2 5.7 15.4 43.9 16.4Sunnyside ES 842 336 41.7 5.4 7.4 25.9 1.2 0.9 0.3 8.6 8.6 43.8 30.7Sunset ES 750 195 - 9.7 16.9 8.7 45.6 -- 4.6 -- 6.2 8.2 50.3 15.4Sutro ES 848 288 - 3.1 18.8 9.4 49.3 0.7 0.7 0.3 3.1 14.6 46.5 22.2Swett ES 652 313 16.3 6.7 36.7 12.5 0.6 0.6 1.3 7.7 17.6 30.7 40.9Taylor ES 513 692 28.5 2.5 12.9 34.7 -- -- -- 12.3 9.2 49.9 25.9Tenderloin ES 859 139 24.5 10.1 8.6 33.8 -- -- -- 7.2 15.8 73.4 4.3Ulloa ES 862 510 - 9.2 14.5 4.3 49.4 0.8 2.9 0.4 5.1 13.3 47.6 17.6Vis Valley ES 867 468 - 12.6 0.4 18.6 45.1 -- -- 0.4 12.6 10.3 55.6 28.2Webster ES 497 453 37.3 1.5 20.3 31.3 0.2 -- 1.1 3.1 5.1 53.2 33.6West Portal ES 876 569 - 6.2 19.5 6.9 45.3 1.4 0.5 0.4 2.5 17.4 28.6 21.3Yick Wo ES 801 264 7.2 21.2 9.8 41.7 1.5 1.1 0.8 1.9 14.8 31.8 20.5Elementary K-8 <strong>School</strong>sLawton ES 676 626 7.8 18.1 6.1 41.2 1.4 3.4 1.0 2.9 18.2 21.7 19.0Lilienthal ES 479 522 10.3 33.3 16.3 11.1 1.9 14.0 1.0 1.7 10.3 8.8 18.2Rooftop ES 796 588 22.6 29.9 20.1 10.2 2.6 0.2 1.9 2.4 10.2 5.6 24.3S.F. Community ES 493 292 37.3 19.2 19.5 7.9 0.3 -- 0.7 6.2 8.9 26.7 38.4Treasure Isl<strong>and</strong> ES 852 494 29.4 6.5 3.8 32.2 -- 0.4 0.4 2.2 25.1 74.5 28.5Twenty-First CA ES 858 303 - 15.2 3.3 46.5 4.6 0.3 0.7 3.3 5.6 20.5 13.2 47.9Yu ES 485 324 6.8 21.6 12.7 32.4 1.9 0.9 0.3 1.9 21.6 11.1 26.2
<strong>San</strong> <strong>Francisco</strong> Unified <strong>School</strong> DistrictPg 4 of 4 01/20/2000<strong>School</strong>Middle <strong>School</strong>sStudentSch# Count<strong>School</strong> <strong>Site</strong> <strong>List</strong> & <strong>Summary</strong>From <strong>SFUSD</strong> District <strong>and</strong> <strong>School</strong> ProfilesCBEDS Data, October 1998Ethnic RepresentationL OW AA C J K AI F ONW45% % % % % % % % % %NEP/LEP EDY% %Aptos MS 431 628 32.0 9.9 20.9 17.8 0.8 1.1 0.5 7.5 9.6 23.7 49.4Burbank MS 701 708 34.2 4.1 18.9 18.9 -- -- 0.1 13.0 10.7 33.8 65.0Davis MS 641 365 27.7 3.6 39.5 2.7 -- -- 3.3 2.7 20.5 18.9 70.1Denman MS 632 755 31.0 3.8 14.6 13.1 0.1 0.1 0.8 30.5 6.0 30.2 54.0Everett MS 529 542 44.3 5.4 21.2 9.8 -- -- 0.6 7.7 11.1 46.7 70.7<strong>Francisco</strong> MS 546 574 - 11.7 5.9 9.2 45.8 0.2 0.2 0.7 7.1 19.2 42.2 51.0Franklin MS 446 634 21.1 3.3 25.9 39.4 0.2 0.3 0.6 3.0 6.2 47.3 49.8Giannini MS 404 1,297 8.6 22.1 10.3 39.1 0.8 2.1 0.5 4.2 12.1 16.7 32.4Hoover MS 607 1,278 11.7 20.7 8.4 38.7 3.1 1.2 0.3 3.2 12.7 16.2 31.9King MS 710 504 17.7 4.0 34.7 25.8 -- -- 0.8 6.5 10.5 17.5 57.1Lick MS 634 479 - 45.9 12.1 26.9 3.8 -- 0.2 0.8 2.1 8.1 22.5 64.1Mann MS 618 600 38.0 14.5 11.2 16.3 0.5 -- 0.7 9.0 9.8 27.7 53.7Marina MS 708 811 9.7 11.2 17.1 44.0 0.6 0.6 -- 3.9 12.7 23.6 41.1Potrero Hill MS 773 493 44.8 5.9 28.4 1.4 -- -- 1.2 12.8 5.5 33.7 65.7Presidio MS 778 1,155 4.0 25.2 4.7 43.7 3.4 2.9 -- 2.7 13.4 17.0 28.5Roosevelt MS 797 825 5.0 15.6 11.6 41.9 1.2 1.7 0.5 4.5 17.9 21.2 41.1Vis Valley MS 868 504 12.7 2.0 28.4 29.4 -- -- 0.2 13.3 14.1 34.3 60.7High <strong>School</strong>sAfter Six HS** 407 69 33.3 8.7 20.3 8.7 -- 1.4 2.9 17.4 7.2 13.0 62.3Balboa HS 439 1,223 26.8 6.5 19.9 7.9 0.3 0.2 0.9 28.1 9.4 30.5 66.1Burton HS 764 1,607 27.7 3.4 21.0 18.8 -- -- 0.5 20.2 8.5 17.1 55.4Downtown HS 742 188 30.9 6.4 43.6 2.7 -- 0.5 -- 8.0 8.0 15.4 79.8Galileo HS 559 1,910 13.2 6.6 12.8 42.3 0.4 0.8 0.3 5.4 18.1 37.0 55.5Gateway HS 565 101 21.8 44.6 7.9 4.0 1.0 -- 2.0 4.0 14.9 5.0 26.7Independence HS 466 400 29.3 19.5 20.5 7.8 0.5 1.3 1.3 10.0 10.0 12.0 63.8Intl Study Acdy HS 624 512 33.2 10.9 17.6 19.7 0.6 -- 1.8 5.9 10.4 28.5 47.1Leadership HS 678 187 27.8 25.1 17.1 6.4 0.5 2.1 2.7 6.4 11.8 8.0 28.9Life Learn Acdy HS-# 681 0 -- -- -- -- -- -- -- -- -- -- --Lincoln HS 405 2,314 - 6.2 16.1 5.8 48.3 1.9 2.0 0.3 4.9 14.5 20.1 33.4Lowell HS 697 2,534 10.9 17.4 4.2 43.3 1.6 3.0 0.4 5.7 13.5 1.1 2.2Marshall HS 853 982 17.1 3.3 27.2 32.2 0.2 0.2 1.1 8.9 9.9 7.9 48.3McAteer HS 630 1,307 30.8 11.4 23.4 17.0 0.3 0.5 0.5 5.8 10.2 35.3 58.8Mission HS 725 905 44.1 2.9 16.0 18.1 -- -- 0.8 9.3 8.8 43.9 63.5Newcomer HS 738 291 = 20.3 4.5 0.3 68.0 -- 0.7 -- 0.7 5.5 100.0 0.3O'Connell HS 651 380 40.3 12.6 17.4 14.2 -- -- 1.8 5.5 8.2 18.2 63.4Sch of the Arts HS 815 404 14.9 37.6 11.9 11.4 3.5 1.5 2.5 5.4 11.4 4.7 21.5Twain HS 737 187 11.2 12.8 21.4 24.1 0.5 1.1 -- 10.2 18.7 8.0 58.8Wallenberg HS 785 632 17.6 8.9 16.6 32.9 1.4 1.3 0.5 6.0 14.9 9.7 32.6Washington HS 571 2,455 4.4 19.2 9.3 41.8 2.8 2.3 0.4 2.3 17.4 20.4 32.9Wells HS 743 228 23.2 7.9 44.7 11.0 -- 0.9 0.9 4.4 7.0 16.2 77.2
<strong>San</strong> <strong>Francisco</strong> Unified <strong>School</strong> District <strong>School</strong> <strong>Site</strong> <strong>List</strong> & <strong>Summary</strong>01/20/2000 From <strong>SFUSD</strong> District <strong>and</strong> <strong>School</strong> ProfilesCBEDS Data, October 1998ADDITIONAL INFORMATIONStudents at a teaching site that the <strong>School</strong> OperationsOffice has NOT defined as a school site.ProfileGroupingDist/Cnty PrgmOther CountyTemp <strong>School</strong>Grp Original-----Code Sch# DescribeCD 482 Noriega CD 45CD 483 Golden Gate CD 798CD 486 Home Based Ed CD 34CD 541 Bay HS CD 6CD 616 Hilltop TP 89CD 688 Log Cabin CS 44CD 817 Sch Bus.& Commerce 1CD 824 Sp Ed Home Hosp 44------1061CO 825 Sp Ed Not in Sch 530CO 827 Sp Ed Priv/Paroch 611CO 828 Sp Ed State Sp Sch 13CO 829 Sp Ed Non-Pub Sch 481------1635NS 401 ES Operations 4NS 402 MS Operations 49NS 403 HS Operations 122------175Note:Life Learn Acdy HS-#: At the time of the CBEDS extract, no students were enrolled on the District’scomputer system for this school. (The school had an enrollment of 19 students.),Ethic RepresentationOther HeadingsCodeEthnic Category codes usedCodeExplanationLOWAACJKAIFONWLatino (SS=Hispanic)Other WhiteAfrican American (B=Black)ChineseJapaneseKoreanAmerican IndianFilipinoOther Non-White (also includesArabic, Samoan, Indo-Chinese)NEP/LEPEDYNon English Proficient orLimited English ProficientEducationally Disadvantaged Youth45% One Ethnic Category exceeds 45%(-) means Equal or Greater than 45%(=) means Equal or Greater than 50%
<strong>San</strong> <strong>Francisco</strong> Unified <strong>School</strong> DistrictPg 1 of 4 01/20/2000<strong>School</strong>District <strong>Summary</strong>StudentSch# Count<strong>School</strong> <strong>Site</strong> <strong>List</strong> & <strong>Summary</strong>From <strong>SFUSD</strong> District <strong>and</strong> <strong>School</strong> ProfilesCBEDS Data, October 1997Ethnic RepresentationL OW AA C J K AI F ONW45% % % % % % % % % %NEP/LEP EDY% %<strong>SFUSD</strong> Grade: K --- 5,044 26.1 11.5 15.9 26.2 1.0 0.9 0.8 5.8 12.0 45.3 --<strong>SFUSD</strong> Grade: 01 --- 4,937 25.6 11.2 16.4 25.0 0.9 0.9 0.7 6.8 12.6 44.2 0.2<strong>SFUSD</strong> Grade: 02 --- 5,049 24.1 11.8 17.3 25.3 1.1 1.1 0.7 7.1 11.6 46.2 28.1<strong>SFUSD</strong> Grade: 03 --- 4,839 21.5 11.8 18.5 27.5 1.0 1.0 0.7 6.4 11.6 43.0 40.8<strong>SFUSD</strong> Grade: 04 --- 4,766 21.9 13.5 16.5 28.4 0.7 0.7 0.8 6.6 10.8 40.3 46.3<strong>SFUSD</strong> Grade: 05 --- 4,461 22.5 12.8 16.4 26.5 1.1 0.7 0.7 7.5 11.7 34.3 52.8<strong>SFUSD</strong> Grade: 06 --- 4,295 19.7 14.5 17.8 26.6 0.9 1.1 0.5 7.4 11.5 28.7 47.7<strong>SFUSD</strong> Grade: 07 --- 4,366 19.4 13.4 17.8 27.1 0.9 0.8 0.7 6.9 12.9 26.5 48.5<strong>SFUSD</strong> Grade: 08 --- 4,282 19.0 13.1 16.2 26.9 1.2 0.9 0.9 7.6 14.3 23.8 44.7<strong>SFUSD</strong> Grade: 09 --- 5,245 19.5 13.0 15.2 28.8 0.9 1.2 0.6 7.6 13.2 25.1 41.1<strong>SFUSD</strong> Grade: 10 --- 5,051 20.1 11.6 16.4 29.3 1.1 1.2 0.8 7.9 11.6 23.7 43.7<strong>SFUSD</strong> Grade: 11 --- 5,171 18.8 12.7 13.3 29.7 1.1 1.6 0.5 10.3 11.9 26.9 42.8<strong>SFUSD</strong> Grade: 12 --- 3,492 15.2 11.1 12.2 36.4 1.3 1.9 0.4 9.2 12.4 17.7 40.5<strong>SFUSD</strong> Grade: UN --- 13 30.8 7.7 61.5 -- -- -- -- -- -- 23.1 30.8District <strong>Summary</strong><strong>SFUSD</strong> Sch <strong>Site</strong> TTL --- 61,011 21.2 12.5 16.2 27.8 1.0 1.1 0.7 7.4 12.1 33.2 36.1<strong>SFUSD</strong> -Dist & Cnty --- 943 28.7 13.8 32.2 6.0 0.2 0.8 1.2 3.3 13.7 16.2 65.7<strong>SFUSD</strong> -Other Cnty --- 1,462 19.2 34.6 27.6 8.3 0.5 0.3 0.5 2.6 6.4 2.5 16.8<strong>SFUSD</strong> -Temp Sch --- 149 30.9 14.1 25.5 5.4 0.7 0.7 1.3 18.1 3.4 11.4 47.7<strong>SFUSD</strong> District TTL --- 63,565 21.3 13.0 16.7 27.0 1.0 1.0 0.7 7.3 12.0 32.2 36.1District <strong>Summary</strong>Elementary K-5 --- 26,891 24.1 11.5 17.1 26.8 0.9 0.7 0.7 7.0 11.4 43.6 27.8Elementary K-8 --- 2,920 17.4 21.4 15.3 21.7 1.5 3.1 1.3 2.8 15.5 23.5 24.8Middle <strong>School</strong>s --- 12,238 19.7 12.8 17.2 27.4 1.0 0.9 0.7 7.5 12.8 27.2 47.7High <strong>School</strong>s --- 18,962 18.7 12.2 14.5 30.6 1.1 1.5 0.6 8.7 12.3 23.9 42.2
<strong>San</strong> <strong>Francisco</strong> Unified <strong>School</strong> DistrictPg 2 of 4 01/20/2000<strong>School</strong>Elementary K-5 <strong>School</strong>sStudentSch# Count<strong>School</strong> <strong>Site</strong> <strong>List</strong> & <strong>Summary</strong>From <strong>SFUSD</strong> District <strong>and</strong> <strong>School</strong> ProfilesCBEDS Data, October 1997Ethnic RepresentationL OW AA C J K AI F ONW45% % % % % % % % % %NEP/LEP EDY% %Alamo ES 413 702 4.4 27.6 1.9 42.6 3.7 3.8 0.1 2.0 13.8 26.5 15.2Alvarado ES 420 418 42.3 28.5 17.2 0.7 -- 0.2 1.4 1.2 8.4 29.9 32.3Argonne ES 435 380 6.1 27.6 7.1 38.4 4.2 1.8 0.3 1.8 12.6 28.7 17.6Bryant ES 456 281 - 45.9 3.9 17.8 19.6 0.4 -- 1.8 5.3 5.3 55.9 40.2Buena Vista ES 461 364 39.0 32.4 9.1 0.8 0.3 0.3 1.4 3.3 13.5 23.6 30.5Cabrillo ES 467 359 - 4.2 22.8 5.3 45.4 1.1 0.6 1.4 4.7 14.5 44.3 28.7Carmichael ES 449 387 - 26.6 4.4 3.1 8.3 -- 0.3 1.0 45.0 11.4 65.4 22.7Carver ES 625 370 - 15.1 2.4 46.2 0.5 0.3 -- 8.9 5.9 20.5 12.7 35.9Chavez ES 603 542 - 46.7 5.4 8.7 29.0 0.4 -- 1.1 2.6 6.3 69.4 29.9Chin ES 872 232 - 9.1 8.2 6.5 49.6 0.4 -- -- 5.6 20.7 69.0 19.8Chinese Ed Ctr ES 476 115 -- -- -- 94.8 -- -- -- -- 5.2 100.0 --Clarendon ES 478 557 13.5 33.2 6.3 9.0 18.9 0.9 0.7 2.5 15.1 11.1 20.3Clevel<strong>and</strong> ES 481 367 - 45.8 5.4 17.7 11.7 -- 0.3 0.5 11.2 7.4 48.8 37.1Cobb ES 525 273 12.1 6.6 38.1 33.0 -- -- 0.7 4.0 5.5 36.6 37.7Creative Arts ES 809 77 7.8 44.2 7.8 2.6 1.3 2.6 3.9 2.6 27.3 1.3 2.6De Avila ES 509 361 5.8 7.8 34.9 41.3 0.3 0.6 -- 1.7 7.8 43.8 34.1Drew ES 507 305 15.4 9.2 39.7 5.9 -- 0.7 3.0 4.3 22.0 19.7 34.8Edison ES 517 379 44.9 2.6 40.6 3.7 -- -- 0.3 2.6 5.3 43.0 41.4El Dorado ES 521 354 16.7 1.7 31.1 24.6 -- -- 0.3 11.6 14.1 38.1 35.6Fairmount ES 537 375 43.7 10.9 30.9 2.4 -- -- 0.5 4.8 6.7 28.3 41.3Filipino Ed Ctr ES 542 68 -- 1.5 -- -- -- -- -- 98.5 -- 89.7 --Flynn ES 680 501 - 46.9 5.4 30.1 4.4 -- -- 0.8 4.8 7.6 45.5 33.7Garfield ES 562 259 = 24.3 3.9 16.2 51.7 -- -- -- 0.4 3.5 67.2 34.7Glen Park ES 575 330 - 46.1 6.7 21.5 11.2 0.3 -- 0.6 7.0 6.7 40.9 30.9Golden Gate ES 579 394 15.7 0.8 34.0 41.4 -- 0.3 0.3 1.8 5.8 57.1 44.2Grattan ES 589 349 9.7 20.9 22.6 33.2 1.1 0.9 -- 2.9 8.6 35.8 29.8Guadalupe ES 593 418 30.1 3.1 11.5 17.9 -- -- -- 23.0 14.4 45.5 33.0Harte ES 453 414 - 34.8 1.2 45.4 2.9 0.2 -- -- 1.7 13.8 32.6 38.4Hillcrest ES 614 537 32.6 3.5 17.7 20.3 -- -- 0.4 15.3 10.2 40.4 32.2Jefferson ES 644 533 - 3.8 26.8 1.5 46.5 1.9 1.3 -- 3.6 14.6 32.6 12.8Key ES 544 540 - 4.6 17.0 3.9 46.1 0.7 1.9 0.2 5.0 20.6 54.8 22.2King ES 838 355 44.2 5.1 36.3 3.1 -- -- 0.6 1.1 9.6 41.4 39.4Lafayette ES 664 559 5.5 27.2 4.7 41.3 1.8 1.1 0.5 3.2 14.7 45.6 25.4Lakeshore ES 670 564 20.9 25.4 17.6 16.8 0.5 2.7 1.1 2.1 12.9 9.9 23.8Longfellow ES 691 555 28.6 4.7 2.9 16.0 -- -- 0.2 40.5 7.0 43.8 14.1Malcolm X ES 830 445 - 8.5 2.5 49.2 0.7 -- -- 3.6 2.7 32.8 12.4 41.6Marshall ES 714 270 - 47.0 4.8 8.5 6.3 -- -- 0.7 12.6 20.0 70.0 28.5McCoppin ES 549 361 - 5.3 16.3 7.8 46.0 1.9 2.2 0.3 3.3 16.9 39.1 21.3McKinley ES 718 259 37.8 18.5 29.7 5.0 -- -- 0.4 0.8 7.7 27.8 34.4Milk ES 505 234 35.5 12.8 33.8 6.0 -- -- 2.1 2.1 7.7 23.1 40.6Miraloma ES 722 349 15.2 10.6 24.1 33.2 0.6 1.1 0.9 5.7 8.6 35.8 26.4Mission Ed Ctr ES 724 104 100.0 -- -- -- -- -- -- -- -- 99.0 --Monroe ES 729 456 - 45.4 5.3 1.5 30.5 -- 0.4 -- 14.0 2.9 62.5 32.9Moscone ES 723 362 - 46.1 5.0 6.1 30.9 -- -- 0.3 3.6 8.0 66.9 24.9Muir ES 650 289 43.9 10.4 32.2 1.7 0.3 -- -- 0.7 10.7 50.9 28.7New Traditions ES 735 190 12.6 33.2 39.5 2.6 0.5 -- 1.1 4.2 6.3 7.4 32.1
<strong>San</strong> <strong>Francisco</strong> Unified <strong>School</strong> DistrictPg 3 of 4 01/20/2000<strong>School</strong>Elementary K-5 <strong>School</strong>sStudentSch# Count<strong>School</strong> <strong>Site</strong> <strong>List</strong> & <strong>Summary</strong>From <strong>SFUSD</strong> District <strong>and</strong> <strong>School</strong> ProfilesCBEDS Data, October 1997Ethnic RepresentationL OW AA C J K AI F ONW45% % % % % % % % % %NEP/LEP EDY% %Ortega ES 746 445 12.4 5.6 33.9 27.9 0.2 0.9 0.9 7.6 10.6 36.2 23.1Parker ES 638 369 - 39.0 2.4 4.6 48.8 -- 0.5 0.8 1.1 2.7 77.0 25.5Parks ES 786 356 3.9 4.8 36.5 43.3 0.3 -- -- 2.5 8.7 44.7 31.7Peabody ES 569 263 6.1 23.6 3.0 44.9 0.4 0.8 0.4 3.8 17.1 43.3 31.9Redding ES 790 394 11.2 9.1 1.8 44.2 -- 0.3 -- 7.1 26.4 69.8 23.4Revere ES 760 539 43.8 5.0 25.4 2.0 -- -- 0.9 14.7 8.2 35.8 35.4<strong>San</strong>chez ES 816 411 43.1 1.5 32.4 9.5 -- -- 0.5 4.9 8.3 41.6 41.8Serra ES 656 282 - 46.8 4.3 13.1 11.7 0.7 -- 0.4 12.8 10.3 50.7 26.6Sheridan ES 820 362 24.9 2.5 41.2 8.0 -- 0.3 1.1 15.2 6.9 33.1 24.6Sherman ES 823 464 9.3 25.6 7.8 44.6 0.9 0.6 0.2 2.2 8.8 35.8 16.8Sloat ES 488 393 12.5 23.4 11.7 27.0 0.3 2.3 0.3 6.4 16.3 24.7 23.7Spring Valley ES 834 485 - 31.8 1.9 5.6 49.9 0.4 0.2 -- 0.8 9.5 70.7 26.0Stevenson ES 782 459 - 7.8 19.6 3.5 45.3 1.1 2.4 0.2 4.8 15.3 48.6 20.3Stockton ES 490 728 - 42.6 1.1 1.5 46.8 -- -- -- 1.2 6.7 74.6 20.9Sunnyside ES 842 331 41.7 2.7 10.3 24.2 0.9 0.6 0.6 10.9 8.2 49.8 25.4Sunset ES 750 176 12.5 18.2 7.4 44.3 0.6 3.4 -- 4.0 9.7 47.2 9.7Sutro ES 848 286 - 2.1 24.1 8.4 46.2 0.3 2.1 0.3 1.7 14.7 53.5 16.1Swett ES 652 302 16.6 6.0 39.7 12.6 0.3 0.3 0.7 8.9 14.9 28.5 41.4Taylor ES 513 710 28.0 3.1 13.2 33.7 -- -- 0.1 12.7 9.2 51.1 29.7Ulloa ES 862 518 - 8.5 15.8 7.1 46.5 0.6 2.7 0.4 6.2 12.2 51.9 19.3Vis Valley ES 867 453 12.1 0.4 18.1 44.8 -- -- 0.2 14.3 9.9 58.3 27.4Webster ES 497 445 38.2 1.6 21.6 30.6 0.2 -- 1.1 2.0 4.7 56.9 34.2West Portal ES 876 575 - 5.7 19.5 7.7 45.7 1.6 1.0 0.7 3.3 14.8 30.3 23.0Yick Wo ES 801 252 6.7 24.2 10.7 36.1 2.0 0.4 0.8 2.0 17.1 38.1 22.6Elementary K-8 <strong>School</strong>sLawton ES 676 632 7.4 20.4 8.2 38.9 1.3 2.8 0.8 2.7 17.4 19.1 21.7Lilienthal ES 479 457 9.2 31.7 15.8 12.3 2.8 14.7 1.5 2.0 10.1 11.8 12.9Rooftop ES 796 578 22.0 32.7 19.0 8.5 2.2 0.3 1.9 2.4 10.9 3.5 23.0S.F. Community ES 493 285 39.3 21.4 18.6 8.4 0.4 -- 0.7 5.3 6.0 27.7 37.5Treasure Isl<strong>and</strong> ES 852 455 27.3 6.8 3.5 34.5 -- 0.2 0.2 2.2 25.3 76.5 19.8Twenty-First CA ES 858 237 - 16.0 4.2 45.1 5.9 -- 0.4 4.6 5.5 18.1 14.3 50.6Yu ES 485 276 6.5 22.1 13.0 31.9 2.9 0.7 -- 1.1 21.7 11.2 27.9
<strong>San</strong> <strong>Francisco</strong> Unified <strong>School</strong> DistrictPg 4 of 4 01/20/2000<strong>School</strong>Middle <strong>School</strong>sStudentSch# Count<strong>School</strong> <strong>Site</strong> <strong>List</strong> & <strong>Summary</strong>From <strong>SFUSD</strong> District <strong>and</strong> <strong>School</strong> ProfilesCBEDS Data, October 1997Ethnic RepresentationL OW AA C J K AI F ONW45% % % % % % % % % %NEP/LEP EDY% %Aptos MS 431 570 26.5 9.5 24.6 17.5 0.7 0.9 1.1 8.6 10.7 28.4 52.3Burbank MS 701 758 33.5 5.9 19.8 14.9 -- -- 0.3 15.3 10.3 31.7 61.5Davis MS 641 379 27.7 6.1 38.5 2.6 -- -- 3.2 4.5 17.4 17.7 61.5Denman MS 632 728 29.5 4.1 17.3 12.5 -- 0.1 1.0 29.4 6.0 32.4 58.7Everett MS 529 629 43.9 8.9 18.9 8.9 -- -- 0.6 6.8 11.9 48.2 67.7<strong>Francisco</strong> MS 546 611 - 10.6 6.5 7.4 46.6 0.3 0.2 0.5 6.2 21.6 47.6 53.7Franklin MS 446 573 18.8 3.7 30.0 36.5 0.2 0.2 0.3 2.6 7.7 40.7 51.5Giannini MS 404 1,336 7.9 22.0 11.2 36.8 1.5 2.1 0.7 4.2 13.7 15.6 30.5Hoover MS 607 1,284 12.5 19.2 8.7 38.6 3.5 1.4 0.3 3.1 12.6 19.6 31.4King MS 710 494 17.8 3.2 35.6 23.7 -- -- 1.8 6.9 10.9 17.2 55.7Lick MS 634 495 43.2 12.3 30.1 3.0 -- 0.2 0.4 3.0 7.7 24.8 66.5Mann MS 618 615 38.2 15.9 10.9 13.7 -- -- 1.1 9.4 10.7 31.9 55.4Marina MS 708 805 7.7 12.8 16.8 44.1 0.4 0.7 0.5 3.9 13.2 20.4 40.0Potrero Hill MS 773 521 43.4 5.4 28.0 1.9 -- -- 0.8 13.1 7.5 35.1 66.0Presidio MS 778 1,164 3.6 25.1 4.4 43.8 2.7 3.2 0.1 2.3 14.8 20.9 27.9Roosevelt MS 797 810 4.4 18.4 11.7 36.4 1.7 1.5 0.7 3.2 21.9 22.8 42.2Vis Valley MS 868 466 14.8 3.0 27.5 24.0 -- -- 0.6 15.5 14.6 34.3 59.9High <strong>School</strong>sAfter Six HS** 407 119 39.5 12.6 19.3 7.6 0.8 -- 0.8 10.9 8.4 19.3 61.3Balboa HS 439 1,385 27.9 4.8 19.6 7.4 0.3 0.2 0.4 30.0 9.3 34.6 66.6Burton HS 764 1,495 27.3 2.7 22.2 21.3 -- 0.1 0.4 17.0 9.0 20.9 54.4Downtown HS 742 201 32.3 4.0 44.3 1.5 -- -- 1.0 9.0 8.0 13.9 82.6Galileo HS 559 1,900 13.4 7.3 12.8 43.1 0.5 0.6 0.3 5.1 16.9 40.8 54.3Independence HS 466 431 26.7 19.5 23.9 5.6 0.2 0.5 1.4 13.5 8.8 8.6 62.4Intl Study Acdy HS 624 482 32.0 10.4 15.8 22.2 0.4 -- 2.1 6.0 11.2 23.9 49.2Leadership HS 678 98 18.4 39.8 16.3 5.1 1.0 2.0 2.0 7.1 8.2 5.1 19.4Lincoln HS 405 2,199 - 7.3 17.0 7.0 46.7 1.4 2.7 0.5 5.0 12.6 21.9 38.0Lowell HS 697 2,571 10.7 17.5 4.2 42.2 1.6 3.6 0.4 6.2 13.7 1.8 2.0Marshall HS 853 994 18.2 5.1 24.0 30.4 0.5 0.5 0.7 10.4 10.2 13.6 45.0McAteer HS 630 1,346 30.2 11.3 24.0 16.7 0.4 0.4 0.5 6.0 10.5 37.8 60.5Mission HS 725 1,047 43.4 2.9 14.5 19.0 -- 0.2 0.5 10.6 9.0 47.6 61.1Newcomer HS 738 369 = 27.4 8.9 -- 50.7 0.8 0.3 -- 4.1 7.9 99.7 0.3O'Connell HS 651 380 38.4 15.8 17.6 13.4 -- 0.3 1.8 5.3 7.4 26.6 68.2Sch of the Arts HS 815 403 13.9 39.0 11.2 11.7 4.2 1.2 2.7 5.7 10.4 6.2 21.3Twain HS 737 120 11.7 11.7 25.0 16.7 0.8 3.3 -- 14.2 16.7 6.7 60.0Wallenberg HS 785 641 17.5 9.2 15.9 34.0 1.7 1.6 0.5 5.6 14.0 10.6 28.4Washington HS 571 2,542 5.3 18.7 10.9 40.0 2.8 2.6 0.3 3.1 16.4 18.4 34.6Wells HS 743 239 21.8 7.5 36.8 15.1 -- 2.1 1.3 3.8 11.7 18.4 80.8
<strong>San</strong> <strong>Francisco</strong> Unified <strong>School</strong> District <strong>School</strong> <strong>Site</strong> <strong>List</strong> & <strong>Summary</strong>01/20/2000 From <strong>SFUSD</strong> District <strong>and</strong> <strong>School</strong> ProfilesCBEDS Data, October 1997ADDITIONAL INFORMATIONStudents at a teaching site that the <strong>School</strong> OperationsOffice has NOT defined as a school site.ProfileGroupingGrp Original-----Code Sch# DescribeDist/Cnty PrgmOther CountyTemp <strong>School</strong>CD 482 Noriega CD 32CD 483 Golden Gate CD 690CD 486 Home Based Ed CD 18CD 541 Bay HS CD 3CD 616 Hilltop TP 86CD 688 Log Cabin CS 41CD 694 Lombard CD 29CD 824 Sp Ed Home Hosp 44------943CO 825 Sp Ed Not in Sch 400CO 827 Sp Ed Priv/Paroch 621CO 828 Sp Ed State Sp Sch 11CO 829 Sp Ed Non-Pub Sch 430------1462NS 401 ES Operations 2NS 402 MS Operations 45NS 403 HS Operations 102------149Ethic RepresentationOther HeadingsCodeEthnic Category codes usedCodeExplanationLOWAACJKAIFONWLatino (SS=Hispanic)Other WhiteAfrican American (B=Black)ChineseJapaneseKoreanAmerican IndianFilipinoOther Non-White (also includesArabic, Samoan, Indo-Chinese)NEP/LEPEDYNon English Proficient orLimited English ProficientEducationally Disadvantaged Youth45% One Ethnic Category exceeds 45%(-) means Equal or Greater than 45%(=) means Equal or Greater than 50%