- Page 1:
DYNAMICSUser’s GuideVersion 7.1(M
- Page 6 and 7:
ContentsRegularization Graph ......
- Page 8 and 9:
Contentsvi DYNAMICS User’s Guide
- Page 10:
Chapter 1: About DYNAMICSWhat is DY
- Page 16 and 17:
Chapter 2: Getting StartedInstallin
- Page 18 and 19:
Chapter 2: Getting Started• The P
- Page 20 and 21:
Chapter 2: Getting StartedYou can o
- Page 22 and 23:
Chapter 2: Getting StartedThe Exper
- Page 24 and 25:
Chapter 2: Getting StartedSetting A
- Page 26 and 27:
Chapter 2: Getting StartedCalculato
- Page 28 and 29:
Chapter 2: Getting Startedmass and
- Page 30 and 31:
Chapter 2: Getting StartedUsing the
- Page 32 and 33:
Chapter 2: Getting StartedSaving Pa
- Page 34 and 35:
Chapter 3: Defining HardwareAutodet
- Page 36 and 37:
Chapter 3: Defining HardwareAdding
- Page 38 and 39:
Chapter 3: Defining Hardware• Opt
- Page 40 and 41:
Chapter 4: Setting ParametersSettin
- Page 42 and 43:
Chapter 4: Setting ParametersCorrel
- Page 44 and 45:
Chapter 4: Setting Parametersmanual
- Page 46 and 47:
Chapter 4: Setting ParametersCuvett
- Page 48 and 49:
Chapter 4: Setting Parameters1. For
- Page 50 and 51:
Chapter 4: Setting Parameters• Cl
- Page 52 and 53:
Chapter 4: Setting ParametersManagi
- Page 54 and 55:
Chapter 4: Setting ParametersCreati
- Page 56 and 57:
Chapter 4: Setting Parameters4. Cli
- Page 58 and 59:
Chapter 4: Setting ParametersDefini
- Page 60 and 61:
Chapter 4: Setting ParametersIf you
- Page 62 and 63:
Chapter 4: Setting ParametersPrevio
- Page 64 and 65:
Chapter 4: Setting ParametersUsing
- Page 66 and 67:
Chapter 4: Setting ParametersCreati
- Page 68 and 69:
Chapter 4: Setting ParametersCreati
- Page 70 and 71:
Chapter 4: Setting Parameters4. Onc
- Page 72 and 73:
Chapter 4: Setting ParametersNote t
- Page 74 and 75:
Chapter 4: Setting Parameters4-36 D
- Page 76 and 77:
Chapter 5: Automating ExperimentsSc
- Page 78 and 79:
Chapter 5: Automating ExperimentsEv
- Page 80 and 81: Chapter 5: Automating ExperimentsEv
- Page 82 and 83: Chapter 5: Automating ExperimentsNa
- Page 84 and 85: Chapter 5: Automating ExperimentsPl
- Page 86 and 87: Chapter 5: Automating Experiments
- Page 88 and 89: Chapter 5: Automating Experiments5-
- Page 90 and 91: Chapter 6: Recording DataMonitoring
- Page 92 and 93: Chapter 6: Recording DataRecording
- Page 94 and 95: Chapter 6: Recording Data2. To chan
- Page 96 and 97: Chapter 6: Recording DataWell Label
- Page 98 and 99: Chapter 6: Recording DataTable 6-3:
- Page 100 and 101: Chapter 6: Recording DataDeleting D
- Page 102 and 103: Chapter 7: Displaying DataPrinting
- Page 104 and 105: Chapter 7: Displaying DataPropertyD
- Page 106 and 107: Chapter 7: Displaying Data3. Select
- Page 108 and 109: Chapter 7: Displaying DataWorking w
- Page 110 and 111: Chapter 7: Displaying DataTo change
- Page 112 and 113: Chapter 7: Displaying DataWorking w
- Page 114 and 115: Chapter 7: Displaying DataThe Graph
- Page 116 and 117: Chapter 7: Displaying DataYou can u
- Page 118 and 119: Chapter 7: Displaying DataColumn Na
- Page 120 and 121: Chapter 7: Displaying DataDatalog G
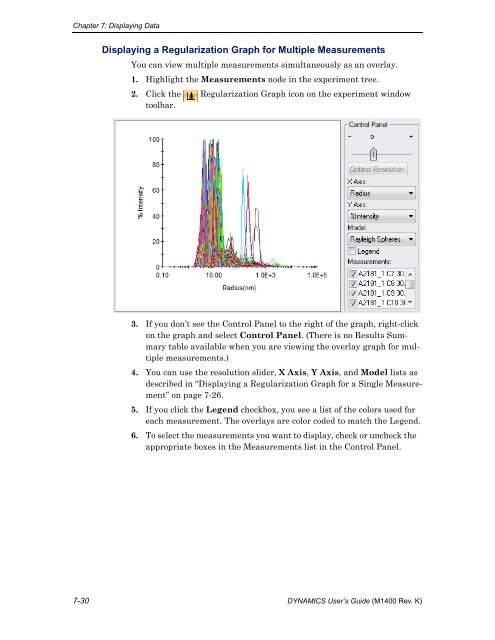
- Page 122 and 123: Chapter 7: Displaying DataDisplayin
- Page 124 and 125: Chapter 7: Displaying DataHint:Afte
- Page 126 and 127: Chapter 7: Displaying DataRegulariz
- Page 128 and 129: Chapter 7: Displaying DataIf you en
- Page 132 and 133: Chapter 7: Displaying DataSpectral
- Page 134 and 135: Chapter 7: Displaying DataAbout Tem
- Page 136 and 137: Chapter 7: Displaying Data5. You ca
- Page 138 and 139: Chapter 7: Displaying DataPlater Re
- Page 140 and 141: Chapter 7: Displaying Datato the ti
- Page 142 and 143: Chapter 7: Displaying Data2. Right-
- Page 144 and 145: Chapter 7: Displaying DataFiltering
- Page 146 and 147: Chapter 7: Displaying Data7-46 DYNA
- Page 148 and 149: Chapter 8: Interpreting DataInterpr
- Page 150 and 151: Chapter 8: Interpreting DataMonomod
- Page 152 and 153: Chapter 8: Interpreting DataPolydis
- Page 154 and 155: Chapter 8: Interpreting DataHydrody
- Page 156 and 157: Chapter 8: Interpreting DataMultimo
- Page 158 and 159: Chapter 8: Interpreting DataCorrela
- Page 160 and 161: Chapter 8: Interpreting DataLarge P
- Page 162 and 163: Chapter 8: Interpreting Databeing c
- Page 164 and 165: Chapter 8: Interpreting DataCaution
- Page 166 and 167: Chapter 8: Interpreting DataMolar M
- Page 168 and 169: Chapter 8: Interpreting DataSize Di
- Page 170 and 171: Chapter 8: Interpreting Data8-24 DY
- Page 172 and 173: Appendix A: Analysis MethodsCumulan
- Page 174 and 175: Appendix A: Analysis MethodsThe cum
- Page 176 and 177: Appendix A: Analysis MethodsA-6 DYN
- Page 178 and 179: Appendix B: Quick ReferenceFile Men
- Page 180 and 181:
Appendix B: Quick ReferenceWindow M
- Page 182 and 183:
IndexRamp Rate 2-16calibrationdata
- Page 184 and 185:
IndexExit command 2-4New command 2-
- Page 186 and 187:
Indexmultimodal 1-3monodisperse 8-1
- Page 188 and 189:
IndexSample Parameters node 4-7Samp
- Page 190:
IndexWyatt Technology Corporationco