VRIJE UNIVERSITEIT BRUSSEL Acoustics - the Dept. of ...
VRIJE UNIVERSITEIT BRUSSEL Acoustics - the Dept. of ...
VRIJE UNIVERSITEIT BRUSSEL Acoustics - the Dept. of ...

You also want an ePaper? Increase the reach of your titles
YUMPU automatically turns print PDFs into web optimized ePapers that Google loves.
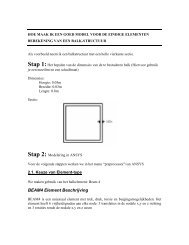
48 CHAPTER 3. MEASURING SOUNDFigure 3.13: Dosimeter. Source: Bruël&Kjær.Typical cumulative distributions are <strong>the</strong> L 99 , L 95 , L 50 , L 10 , L 5 and L 01 distributions.L x indicates that during x% <strong>of</strong> <strong>the</strong> time, a sound pressure levelis present larger than or equal to <strong>the</strong> indicated value. For example; L 95 = 60dB indicates that 95% <strong>of</strong> <strong>the</strong> time, <strong>the</strong> sound pressure level is at least equalto 60dB. L95 and L 90 can be interpreted as <strong>the</strong> sound pressure levels thatare continuously present, whereas L 10 and L 05 indicate sound pressure levelsthat are caused by accidental noises (eg. passing vehicles).3.8.4 The Noise Rating valueNoise pollution is related to <strong>the</strong> loudness and <strong>the</strong> frequency spectrum <strong>of</strong> <strong>the</strong>sound. This is <strong>the</strong> case because <strong>of</strong> <strong>the</strong> following reasons : a) high tones proveto contribute more to <strong>the</strong> nuisance <strong>of</strong> sound than <strong>the</strong> low tones; b) whendealing with noise one wants to track <strong>the</strong> source, and this is only possiblewith a frequency spectrum analysis. One has searched for a better one digitsystem, thatalso takes into account <strong>the</strong>spectrum. Inthis wayonegets<strong>the</strong>socalled ISO-limit curve for noise, also called <strong>the</strong> N.R. or Noise Rating curves(see Figure 3.14), presented by Kosten and Van Os. These are prescribedfor e.g. <strong>the</strong> determination <strong>of</strong> noise <strong>of</strong> ventilators and HVAC units. Theydisplay an octave band level (dB) in function <strong>of</strong> <strong>the</strong> frequency. They areenumerated according to <strong>the</strong> number <strong>of</strong> dB sound pressure in <strong>the</strong> 1000Hz