Annals of Warsaw University of Life Sciences - SGGW.
Annals of Warsaw University of Life Sciences - SGGW.
Annals of Warsaw University of Life Sciences - SGGW.

Create successful ePaper yourself
Turn your PDF publications into a flip-book with our unique Google optimized e-Paper software.
<strong>Annals</strong><strong>of</strong> <strong>Warsaw</strong><strong>University</strong><strong>of</strong> <strong>Life</strong><strong>Sciences</strong>– <strong>SGGW</strong>Agriculture(Agricultural and Forest Engineering No 52)<strong>Warsaw</strong> 2008
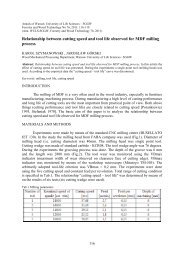
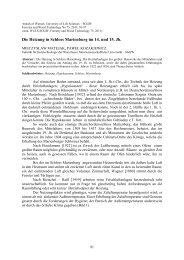
6 G. ViselgaEXPERIMENTAL OBJECTIVEThe experimental objective is to group,analyse and generalise the key trends andneeds <strong>of</strong> field crop and potato productionmodernisation, and to determine therelationship between them.To investigate the processes <strong>of</strong>soil deep loosening, furrow looseningby rotary implements separating andcrushing the clods, and mulching whengrowing potatoes with permanenttramlines and on enlarged furrows, aswell as to determine possibilities for thereduction <strong>of</strong> soil packing energy costsper unit <strong>of</strong> production and for potatolifting improvement.To evaluate the possibilities <strong>of</strong> thesimplest circular energetic modulus(Fig. 1) <strong>of</strong> the gantry agriculture, theconditions for the operation <strong>of</strong> the mainworking parts in the circular trajectoryand to use the best results to make theperspective simplification trends <strong>of</strong> thetechnological schemes <strong>of</strong> the powermodulus <strong>of</strong> the reciprocal movementtype.EXPERIMENTAL METHODSThe following composite parts <strong>of</strong>combined aggregates testing stands wereformed: rotary cultivator – mulchingequipment, tramlining equipment withdeep loosening chisel shares, clod andstone separator, special spur-type roller.These implements can be aggregatedwith 14 kN class MTZ-82 tractorsautonomously or fitted in combinedaggregates.Tramlining equipment is designedto form tramlines and to loosen the soilbetween them while planting potatoes,as well as for localisation <strong>of</strong> soil rich inhumus or green manure while preparingthe soil for potatoes. It consists <strong>of</strong> anuniversal frame, two tramline hillers,two support depth control wheels, andthree chisel shares. Tramline hillers areplaced in front <strong>of</strong> tractor wheels.For the determination <strong>of</strong> soil hardnesswe used an electronic self-writingpenetrometer CP20 (England) with astandard 12.5 mm diameter cone-shapedtip. Soil resistance to this tip pressingAR p1R p2l 1 =0; α 1 =0.α 2l 2AFIGURE 1. The scheme <strong>of</strong> the power modulus <strong>of</strong> the circular gantry system
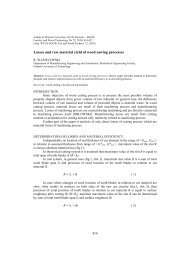
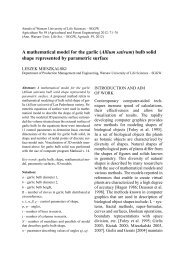
Inveatigations on soil conservation and precision... 7is recorded in the memory <strong>of</strong> thisapparatus every 15 mm from the surfaceto the set depth. For measuring <strong>of</strong> soilhardness distribution in the width <strong>of</strong> thewhole interrow and for the measuring<strong>of</strong> furrow pr<strong>of</strong>ile, besides hardnessmetering equipment, we used 1.5 m longhorizontal plank with legs stuck in thesoil, in which 1,4 m length on both sidesevery 10 mm (with 5 mm sliding) holes<strong>of</strong> 15 mm diameter were drilled.We investigated the circular (Fig. 1)and shuttle gantry aggregates. Thecircular carriage driven by the electricmotor rotates the cantilever beam aroundthe support centre. The implementmounting cart moves across the beam.Different working implements can bemounted on this cart and they wouldacquire the spiral movement or that<strong>of</strong> concentric circles. The shuttle unitswere investigated by laser measurementimplements.EXPERIMENTAL RESULTSMajor engineering soil conservationmeans in field crop and potato production,besides tillage <strong>of</strong> soil with adequatemoisture regime at optimum terms,education <strong>of</strong> agricultural producers,control <strong>of</strong> environmental aspects, canbe grouped into three main parts: meansrelated to machinery improvement,advancement <strong>of</strong> technologies andreduction <strong>of</strong> chemical pollution.Firstly, an important and considerablepart is devoted to the reduction <strong>of</strong>chassis pressure on the soil. One can findtraditionally used means among themsuch as: doubling <strong>of</strong> wheels, speciallow-pressure tyres, caterpillar and semicaterpillarchassis. Regardless highenergy costs, on stony soils it is necessaryto remove small stones over 3 cm insize. Our long-term experiments suggestthat from energy and soil conservationpoint <strong>of</strong> view it is most efficient toremove stones in one time from thewhole arable layer, while preparing thesoil for potatoes by combined complexaggregates. Arable layer is sifted, stonesare separated into fractions: small stonesup to 6–8 cm are crushed and spread inthe soil, bigger stones are removed fromthe field in a hopper. Up to 40% <strong>of</strong> fuelis economised, potato yield is increasedabout 10% and anti-erosive effect iscreated.An important role is played byadvancement <strong>of</strong> machinery design –evenly operating ploughs, mouldboardless implements and ploughs ploughingwith mounted rotary soil loosening orclod crushing implements. Optimumoperation regime is <strong>of</strong> special importancefor actively operating working parts.When preparing the soil byconventional cultivators with passiveworking parts the soil and interrows arepassed several times during the springsoil preparation. Soil hardness increaseswith every pass (Fig. 2).Mulching <strong>of</strong> green manure crops oilradish and white mustard in the surface10 cm soil layer reduces soil hardness(Fig. 3), weed incidence on the fields(Fig. 4), increases productivity, nutrientcontent and the amount <strong>of</strong> earth-wormsin the soil as much as 10 times. It is anundoubtedly valuable soil improvementmeans. No increase in the amount <strong>of</strong>earth-worms was found after sprayingpotatoes with pesticides.
8 G. ViselgaFIGURE 2. The relationship between soil hardness in the middle <strong>of</strong> an interrow and the number <strong>of</strong>passes <strong>of</strong> tractor’s MTZ-82 earthing-up and planting aggregatesFIGURE 3. Effect <strong>of</strong> mulching on soil hardness in potato furrows before potato liftingFIGURE 4. Effect <strong>of</strong> soil loosening (a), mulching and cultivation methods (b) on weed incidence
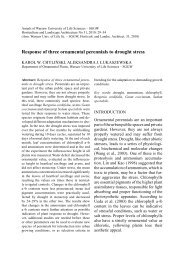
Inveatigations on soil conservation and precision... 9When loosening by a combinedaggregate and planting separately, theamount <strong>of</strong> clods over 30 mm in diametercollected during potato lifting was 28.5%lower and on average 18.4% lower in allthe experimental treatments than in thecontrol.While setting modernisation trends <strong>of</strong>field crop production a special attentionshould be drawn to the reduction <strong>of</strong>energy costs. It is equal to the reduction<strong>of</strong> production costs and enhancement <strong>of</strong>pr<strong>of</strong>itability. It goes without saying thaton cultivated, not compacted soils energycosts are always lower. Therefore, all thethree mentioned trends are interrelated.Replacement <strong>of</strong> organic fertilisersby mulching <strong>of</strong> green manure crops andgrowing <strong>of</strong> ecological production are alsoways to save energy costs, as these meansis increased, as it is possible to narrowinterrows and protection zones <strong>of</strong> somecrops and not to pack the soil. It is atechnology <strong>of</strong> the future.The operation width <strong>of</strong> the gantrysystem implements when perpendicularmounted on the beam depends on theirdistance up to the revolution centre Rpand the beam l. The smallest divergence<strong>of</strong> the operation width from the designone that is equal to 0.18 m (Fig. 5) willbe when the implements are under thebeam, i.e. l = 0. But in some cases itis difficult to do l = 0 in practice, thenthe implements should be turned bythe radius angle α πarctg R pl= −2depending on the turn. At that time theoperation width <strong>of</strong> the plough will can becalculated according to equation:b =2 23bp+ anbp+ an+ Rp+ l + 2 3 2 22 244result in lower energy consumption, lowersoil compaction and better suppression<strong>of</strong> weeds. Technologies <strong>of</strong> precisionand gantry agriculture are completelynew. Experimental results <strong>of</strong> circle andshuttle gantry systems [Viselga 1998]have shown that wheel skidding is aslow as 1%, and soil loosening energycosts can be reduced as much as 20%.Installed power according to the results<strong>of</strong> our tests makes up only 3–5 kW, andfor ploughing and cultivation only about240 kWh/ha is used. In gantry agriculturethe amount <strong>of</strong> production per area unit2 22 2 an− bp− Rp + l +4⎛2 2( Rp+ l⎜) sin arctg ⎜⎜⎝⎞2bp⎟+2 2an− bp⎟⎠where: a n – the length <strong>of</strong> the ploughshareblade, b p – the design width <strong>of</strong> the plough.When the turn radius <strong>of</strong> gantryimplements is (3–6) m, one side <strong>of</strong> thepr<strong>of</strong>ile <strong>of</strong> the potato furrow, closer tothe rotation centre, has the smaller areathan the other side <strong>of</strong> the pr<strong>of</strong>ile (Fig. 6).When the implements move away fromthe centre, on the contrary, the area <strong>of</strong> theperipheral side <strong>of</strong> the furrow pr<strong>of</strong>ile issmaller than the area <strong>of</strong> the other side <strong>of</strong>the furrow pr<strong>of</strong>ile: when the turn radiusis (9–12) m, the furrow asymmetry is13%, and when it is (15–18) m, the
10 G. ViselgaFIGURE 5. The relationship <strong>of</strong> the operating width <strong>of</strong> the plough body on its distance to the beam andthe turn radius, when the implements are perpendicular to the beam20ñm1510201510201510500262,2 cm 2 284,4 cm 215304560(3-6)m; (0,16-(9-12)m; (0,47-(15-18)m; (0,79-FIGURE 6. The row pr<strong>of</strong>iles and their cross-section areas in dependence <strong>of</strong> turn radiusfurrow asymmetry is 1%. The furrowasymmetry is insignificant, when thehiller is at (6–12) m distance from therotation centre.Experimental tests showed that theoperation speed has the greatest influenceto the work quality <strong>of</strong> the hilling bodies,if compared with all the other testedimplements. The operation speed shouldbe not smaller than 0.55 m per secondbecause only at this speed the symmetricalrow pr<strong>of</strong>iles may be formed (Fig. 6).From the shuttle modules the simplestare the positional beam with two chassis500299,6 cm 2 266,1 cm 2 01530456050260,8 cm 2 258,9 cm 215304560ñmand longitudinally mounted mowingimplements. The field area is unlimited,the motor power is 3–4 kW.The wheels <strong>of</strong> positional shuttlemodules precisely copy unevenness <strong>of</strong>field and the beam has more deviations<strong>of</strong> straight movement (Fig. 7). Walkingchassis with length support decreasesthis deviations and quantity <strong>of</strong> positionalcorrections. The gantry modules andespecially positional shuttle modulesin comparison <strong>of</strong> the tractors decreasemotor power and deviations from straightmovement and width <strong>of</strong> rows.
Inveatigations on soil conservation and precision... 11FIGURE 7. The influence <strong>of</strong> shuttle module chassis type to quantity <strong>of</strong> positional correctionCONCLUSIONS• Tractors with a front suspensionrod and a front power shaft, evenlyploughing ploughs with mountedloosening implements, mouldboardless aggregates, mulching implements,gantry systems, complex andcombined implements are the means<strong>of</strong> field crop production modernisationwhich should be used as widely aspossible.• By one pass <strong>of</strong> a combined soiltillage aggregate and experimentalpotato growing technology involvingnarrow-wheeled tractors it is feasibleto reduce soil hardness in the zone <strong>of</strong>tracks 1.5 times and to increase thedepth <strong>of</strong> friable soil to 22 cm.• Rotary cultivators loosen the soil moreintensively than mouldboard ploughsor passive shares <strong>of</strong> cultivators. Thesoil loosened by these implementsas well as mulched soil is packedless before potato planting, the clodcontent is lower in them, the weedincidence is 2.5 times lower and thetubers are 18–28 cleaner.• Soil friability, reduction <strong>of</strong> harmfuleffect <strong>of</strong> soil compaction by wheelsand mulching <strong>of</strong> green manure cropsincreased potato yield 40.3% andreduced dirt content.• Very important is the indicator <strong>of</strong>incorporation fullness <strong>of</strong> green manurecrops, as mineralisation <strong>of</strong> greenmanure in the soil surface is low.• The angle <strong>of</strong> the deviation <strong>of</strong> theplough body and other implementsfrom the design position if directlyproportional to the body distance fromthe bar the gantry circular module andwidth is smaller than the design onenot more than 10%. The ploughingdepth at the centre is smaller by 32mm than in the peripheral part.• To avoid the furrow asymmetry at thecentre, the hillers should be as closeas possible to the circular module barand their operation speed should beincreased, at least, up to 0.55 m/s.
12 G. ViselgaREFERENCESBAREIŠIS R., ŠNIAUKA P. 2000: Tiltiniųžemdirbystės sistemų tyrimai. LŽŪUniversiteto mokslo darbai 5 (1).POWAŁKA M. 2007: Changes in soilphysical properties in arable layer underpressure <strong>of</strong> tractor outfit wheels. <strong>Annals</strong><strong>of</strong> <strong>Warsaw</strong> <strong>University</strong> <strong>of</strong> <strong>Life</strong> <strong>Sciences</strong>– <strong>SGGW</strong>, Agriculture No 51: 13–17.SKREBELIS S. 2007: Peculiarities <strong>of</strong>plowless tillage technology when growingcrops. <strong>Annals</strong> <strong>of</strong> <strong>Warsaw</strong> <strong>University</strong> <strong>of</strong><strong>Life</strong> <strong>Sciences</strong> – <strong>SGGW</strong>, Agriculture No51: 29–34.VISELGA G. 1998: Tiltines zemdirbystesprincipu taikymo mazuose plotuose tyrimai.Daktaro disertacija. Raudondvaris.VISELGA G. 2006: Research <strong>of</strong> AccuracyParameters <strong>of</strong> the Gantry Course. SolidState Phenomena. Vol. 113 “MechatronicSystems and Materials”, p. 50–54.VISELGA G., KAMIŃSKI J.R. 2006: Analysis<strong>of</strong> soil compaction at potato cultivation.PAN. Zeszyty Problemowe PostepówNauk Rolniczych, 508: 203–208.Streszczenie: Badania konserwującej uprawygleby z wykorzystaniem ciągnika oraz urządzeniabramowego. W porównaniu z narzędziamibiernymi, ugniecioną glebę znacznie intensywniejspulchniają brony aktywne. Brony wirnikowemogą być stosowane zarówno w tradycyjnejuprawie przedsiewnej, jak również podczas siewunasion w mulcz. W uprawie ziemniaków zalecanesą bronowanie i wielokrotne obsypywanie. Zalecasię usunięcie kamieni, szczególnie z pól przeznaczonychpod uprawę ziemniaków. Wielokrotneprzejazdy powodują nadmierne ugniecenie glebyw międzyrzędziach kołami ciągników i maszynrolniczych. Dążąc do ograniczenia liczby przejazdówmaszyn po polu wyposaża się ciągnikiw przedni i tylny TUZ. Umożliwia to stosowaniezłożonych, wieloczynnościowych agregatówuprawowych zawieszanych z przodu i z tyłu ciągnika.To pozwala zmniejszyć liczbę przejazdówdo niezbędnego minimum. Natomiast całkowiteograniczenie ugniatania gleby można uzyskaćpoprzez zastosowanie systemu tzw. rolnictwabramowego. W tym wypadku zabiegi agrotechnicznewykonywane są narzędziami montowanymina wózku przetaczającym się po specjalnychszynach. Stwierdzono korzystny wpływ takiegosystemu uprawy na strukturę i fizyczne właściwościgleby.MS. received June 2008Author’s address:Gintas ViselgaVilnius Gediminas Technical <strong>University</strong>,Department <strong>of</strong> Machine Building,LT-03224 Vilnius, J. Basanaviciaus St. 28,Lithuaniae-mail: visgin@one.lt
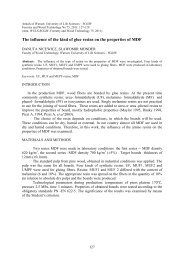
<strong>Annals</strong> <strong>of</strong> <strong>Warsaw</strong> <strong>University</strong> <strong>of</strong> <strong>Life</strong> <strong>Sciences</strong> – <strong>SGGW</strong>Agriculture No 52 (Agricultural and Forest Engineering) 2008: 13–21(Ann. <strong>Warsaw</strong> Univ. <strong>of</strong> <strong>Life</strong> Sci. – <strong>SGGW</strong>, Agricult. 52, 2008)Precision and energy parameters <strong>of</strong> the positioned gantry module1 GINTAS VISELGA, 2 JAN R. KAMIŃSKI1 Vilnius Gediminas Technical <strong>University</strong>, Department <strong>of</strong> Machine Building, Vilnius, Lithuania2 Department <strong>of</strong> Agricultural and Forest Machinery, <strong>Warsaw</strong> <strong>University</strong> <strong>of</strong> <strong>Life</strong> <strong>Sciences</strong> – <strong>SGGW</strong>,<strong>Warsaw</strong>, PolandAbstract: Precision and energy parameters<strong>of</strong> the positioned gantry module. The course<strong>of</strong> the positioned gantry module is maintainedby a laser instrument. A laser beam generatoremitting a vertical beam is placed at the end <strong>of</strong>the experimental field. A laser beam catcher withphoto diodes is mounted on a positioned gantrymodule replaceable support. Course deviationswere assessed in two cases: when laser, straightcoursemaintaining mechanism was mounted atthe same end <strong>of</strong> the spar as positioning trundle;and when it was mounted at the middle <strong>of</strong> the spar.Furthermore, we estimated how course deviationsvary when changing inter-axial distance <strong>of</strong>laser catcher photodiodes. Electromechanicaltransmitter was used in the tests. Gantry moduleis positioned by a special positioning trundle. It isrun by a 12 V electric motor through a worm self--braking reduction gear.Key words: gantry unit, shuttle movement,accuracy parameters, positioning, straight-linecourse movement.INTRODUCTIONGantry unit allows to dispense withdifferential global positioning system(DGPS), since a straight-line coursecan be maintained by special permanenttramlines using cheaper means suchas gyroscopic system or according tolaser beam. Some researchers confirmthat gantry units can be more precisethan DGPS [Holt, Tillet 1989, Quick1987], and due to the simpler automaticcontrol system, gantry units can be moreeconomical [Viselga 2006, Viselga,Kamiński 2006, Viselga, Bareisis 2003].There are two types <strong>of</strong> shuttle movementgantry units:••the ones whose chassis together withthe working parts inertly fitted ongantry spar move along the objectand at headlands they are re-arrangedat working width to the adjacent strip<strong>of</strong> land;with working parts moving acrossthe field during operation with thebeam periodically positioned alongthe object according to the workingwidth <strong>of</strong> the working parts.The second type has one majoradvantage – the discrepancy betweenenergy needs for the positioning <strong>of</strong>spar and for working parts motiondeclines the installed power. In orderto integrate the chief potentials in theshuttle movement gantry module onehas to study the methods for precisionincreasing using automatically controlledmore straight forward means that do notrequire direct involvement <strong>of</strong> man. In thefuture this would allow to refuse internalcombustion engines in the gantry unitsas well as unreeling electric cables andto change over to the use <strong>of</strong> other energysources [Viselga 1989].
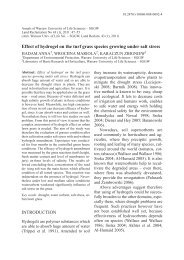
14 G. Viselga, J.R. KamińskiEXPERIMENTAL OBJECTIVETo identify possibilities to reducedeviations <strong>of</strong> straight-line coursemovement and positioning in relation tothe effect <strong>of</strong> micro and macro unevenness<strong>of</strong> the field, by choosing chassis type,control methods and parameters, andto estimate technological and energeticefficiency <strong>of</strong> the model.EXPERIMENTAL METHODSThe course <strong>of</strong> the positioned gantrymodule (PGM) is maintained by alaser instrument UKL – 1 (УКЛ – 1).A laser beam generator emitting avertical beam is placed at the end <strong>of</strong> theexperimental field. A laser beam catcherwith photo diodes is mounted on a PGMreplaceable support (Fig. 1). When themodule deviates from the course, laserbeam is passed into one <strong>of</strong> the marginalphotodiodes and a signal is formed, whichis passed into the control panel. Thecontrol panel switches <strong>of</strong>f transmitter <strong>of</strong>one or the other chassis and when PGMspar turns perpendicularly to the straightlinecourse, the transmitter <strong>of</strong> the chassisis turned on again.PGM is positioned by a specialpositioning trundle. It is run by a 12 Velectric motor through a worm self--braking reduction gear.When positioning trundle is running,a horizontal round tube inertly joinedwith it, moves along the bracket withterminal switches. When running, PGMbracket with terminal switches movesalong the tube <strong>of</strong> stopped positioningtrundle. Having moved on motionlimiters, the terminal switch <strong>of</strong> theFIGURE 1. Technological scheme <strong>of</strong> PGM: 1 – spar; 2 – chassis; 3 – working parts stretcher; 4 – rope<strong>of</strong> working parts stretcher; 5 – working parts; 6 – working parts fixing carriage; 7 –axis <strong>of</strong> turning <strong>of</strong>working parts; 8 – back disconnectors with the switchover contact; 9 – flexible cable; 10 – cable drum;11 – horizontal tube with motion limiters; 12 – laser catcher with photodiodes; 13 – positioning trundle;14 – motor <strong>of</strong> working parts stretcher; A – distance between centres <strong>of</strong> photodiodes; B – distance <strong>of</strong>catcher’s photodiodes to the spar (B = 1 m); C – catcher’s distance from a wheel positioned the chassis;l s – spar length (l s = 18 m)
Precision and energy parameters <strong>of</strong> the positioned gantry module 15electric motor switches <strong>of</strong>f transmitter<strong>of</strong> the chassis and switches on motors<strong>of</strong> working parts carriage stretcherand <strong>of</strong> positioning trundle transmitter.When positioning trundle has run the setpositioning distance, motion limiters onthe tube press the terminal <strong>of</strong>f switch andthe trundle stops. The distance that PGMruns between stops, is set by shiftingmotion limiters on the tube <strong>of</strong> positioningtrundle. When the working parts carriagehas moved to the end <strong>of</strong> its motion, theterminal switch is pressed, the motor<strong>of</strong> working parts carriage stretcher’stransmitter is switched <strong>of</strong>f and motors <strong>of</strong>chassis transmitters are switched on. Theabove-described cycles revolve.Precision <strong>of</strong> PGM stops in setpositions was measured in series <strong>of</strong> threereplications. Command to stop by asignal <strong>of</strong> an electric control scheme wasgiven by a mechanism <strong>of</strong> positioningtrundle.Precision <strong>of</strong> PTM stops in a setposition was assessed in the followingway:•••on stopping, special marks weremade on the soil surface according tospecial supports in tramlines;afterwards a line was stretched withinthe length <strong>of</strong> the experimental plot,parallel to tramlines at marks in orderto maintain measuring straightness inthe course direction;the distance between the marks wasmeasured by a tape-measure stretchedat the line ties.PGM straight – line course deviationswere measured along the whole length <strong>of</strong>the experimental plot by stretching theline and tape-measure, leaving the samedistance from the middle <strong>of</strong> the tramlineat the ends. The imprint <strong>of</strong> the middle <strong>of</strong>chassis support wheels protector in thesoil <strong>of</strong> tramlines was considered as themiddle <strong>of</strong> tramline. The distance fromthe line to the middle <strong>of</strong> the tramline wasmeasured by a ruler every 0.5 m. PGMcourse deviations were assessed in threereplications in two cases: when laser,straight-course maintaining mechanismwas mounted at the same end <strong>of</strong> thespar as positioning trundle (C = 0); andwhen it was mounted at the middle <strong>of</strong> thespar (C = l s /2 = 6 m). Furthermore, weestimated how course deviations varywhen changing inter-axial distance <strong>of</strong>laser catcher photodiodes.Electromechanical transmitter wasused in the tests.Average soil moisture content in thetramlines was: 6.1–12.6% at the 50 mmdepth, 8.7–13.2% at the 50–100 mmdepth.EXPERIMENTAL RESULTSThe right and the left chassis <strong>of</strong> PGMmove on the surfaces with differentevenness.According to the experimental data<strong>of</strong> tramlines unevenness measuring andcomputer chassis simulation programmedeveloped in the Matlab environment, weobtained positioning deviation results <strong>of</strong>PGM individual chassis run between positionsdistances or number <strong>of</strong> positionsto permissible set position (Fig. 2). Theyenable to compare the effects <strong>of</strong> wheelchassis tramlines levelling on the corrections<strong>of</strong> the set straight-line course.In the case <strong>of</strong> wheel chassis thewheels are in contact with the brokenline <strong>of</strong> tramlines.
16 G. Viselga, J.R. KamińskiNumber <strong>of</strong> positions to corrections80706050403020100both tramlines <strong>of</strong> chassis not levelledone tramline levelled1 2 3 4Succession <strong>of</strong> correctionsFIGURE 2. The effects <strong>of</strong> tramline on the frequency <strong>of</strong> course correctionWhen moving along natural nonlevelledtramlines both tracks needlevelling, because levelling <strong>of</strong> onetramline even increases the number <strong>of</strong>positions to corrections and increases theinter-difference <strong>of</strong> the distance done bythe chassis in the direction <strong>of</strong> the courseduring correction. This results from thefact that when both chassis move alongnon-levelled tramlines their unevennesscompensate one another.When positioning trundle andphotodiodes <strong>of</strong> laser catcher with A = 30mm inter-axial distance were mountedon the same chassis (C = 0), mean coursedeviation <strong>of</strong> this chassis amounted to67.6 mm, and mean square deviation±15.0 mm (Fig. 3). Straight-line coursedeviations <strong>of</strong> the other chassis weredetermined by the unevenness <strong>of</strong> itstramline and other already-mentionedfactors, therefore its mean straight-linecourse deviation was higher (102.2mm), and mean square deviation wasconsiderably higher ±33.9 mm.When photodiodes are mounted in themiddle <strong>of</strong> the spar (C = 6 m) and the leftchassis is positioned by the trundle, meandeviation from the straight-line course <strong>of</strong>the right chassis significantly declines,compared with the first case (75.6 mm)(Fig. 4). Its average straight-line coursedeviation are smaller (25.5 mm). Meansquare deviations <strong>of</strong> straight-line coursedeviations were 4.1 mm bigger for theright chassis.Precision <strong>of</strong> positioning depends onthe speed <strong>of</strong> PGM. When increasing thespeed from 0.08 m/s to 0.24 m/s, thedistance between the left, positioned bya trundle, chassis stops in the positionsincreased by on average 31 mm, and that<strong>of</strong> the right chassis by 20 mm. When thespeed is increased from 0.08 m/s to 0.39m/s, this distance increases by 61 mm and55 mm, respectively. Average positioningsquare deviation <strong>of</strong> the chassis positionedby a trundle is lower and at a speed <strong>of</strong>0.08 m/s it reached on average ±32 mm.An increase in the chassis speed resultsin an increases in mean square deviation.At a speed <strong>of</strong> 0.38 m/s it was ±50 mm.Average square deviations <strong>of</strong> thedistance between positions <strong>of</strong> the right
Precision and energy parameters <strong>of</strong> the positioned gantry module 1718,51817,519,51920,520160 .21 21,5 22140120100806040200Course deviation<strong>of</strong> chassis, mm33,544,55Left chassisRight chassis5,566,57177,516,58168,515,51514,51413,513 12,5121111,51010,59,59Distance coveredby the chassis, mFIGURE 3. Course deviation, when positioning trundle and photodiodes <strong>of</strong> laser catcher were mountedon the left chassis17,51716,51818,519 120 .1008060Course deviation<strong>of</strong> chassis, mm33,544,55Left chassisRight chassis16405,515,52061506,514,57147,513,58138,512,59 Distance covered129,5 by the chassis, m11,511 10,510FIGURE 4. Course deviation, when photodiodes are mounted in the middle <strong>of</strong> the spar and the leftchassis is positioned by the trundle
18 G. Viselga, J.R. Kamińskichassis positioned according to the bend<strong>of</strong> the spar were by on average 1.6––2.1 times higher due to differences intramline unevenness.The distance between photodiodes,when A = 20–30 mm did not have anysignificant effect on the positioningprecision <strong>of</strong> the right chassis positionedby a trundle. Mean deviations rangedbetween 62–64 mm, and mean squaredeviations amounted to 19–26 mm, meandeviations <strong>of</strong> the other chassis rangedwithin wider limits <strong>of</strong> 29–63 mm, andmean square deviation when increasingthe distance between photodiodes from50 to 67 mm, increased by 1.3 times,from 81 to 104 mm.On the basis <strong>of</strong> the above-mentioneddata we can find that positioning speedis a decisive factor for positioningprecision. With increasing speed, inertiaforces increase when stopping or startingduring positioning, which increasespositioning deviations.Variation <strong>of</strong> asynchronous motorspower <strong>of</strong> electromechanical transmitteris rather typical (Fig. 5a). Duringpositioning, the power depended onthe speed <strong>of</strong> chassis. During automaticactuation <strong>of</strong> chassis motors the powerslightly exceeded the mean value. At0.083 m/s speed <strong>of</strong> chassis the powerinappreciably fluctuated and amountedto on average 0.08 kW. During the coursecorrections when motors temporarilyswitched <strong>of</strong>f, the power declined to zero.Duration <strong>of</strong> corrections was about 0.8––1.0 s. The power <strong>of</strong> individual motors<strong>of</strong> chassis slightly differed, most likelydue to the different distances coveredduring skid.Motor power <strong>of</strong> electromechanicaltransmitter <strong>of</strong> rope stretcher <strong>of</strong> implementcarriage at actuation moments wasat its peak, up to 4.8 kW, and duringstabilisation <strong>of</strong> implement tractionresistance, declined to 0.74 kW. Thelength <strong>of</strong> peak was 0.8–1.2 s. Due tothese power peaks, the working width <strong>of</strong>the implements was limited.An increase in positioning speed<strong>of</strong> PGM with an electromechanicaltransmitter to over 0.1 m/s wascomplicated due to the impacts duringtransitional processes.Comparison <strong>of</strong> power utilisationgraphs presented in Figure 5 suggeststhat chassis speeds in the case <strong>of</strong>electromechanical transmitter were4.7 times lower, and the power <strong>of</strong>chassis differed by 3.7 times, i.e. withincreasing speed the power increasesless. Implement speeds in the case <strong>of</strong>hydromechanical transmitter were by1.76 times higher, and the power 3times higher compared with implementcarriage pulling using electromechanicaltransmitter. This increase in poweroccurred due to the flow in throttletransmitter. When throttling is reduced,i.e. when revolution frequency is reducedby a mechanical transmitter, the powerdoes not increase significantly.Low power requirement <strong>of</strong> chassisenables to position chassis even bya muscle power <strong>of</strong> man. The power <strong>of</strong>implement carriage stretcher is higherand increases with increasing the workingwidth <strong>of</strong> implements. The total requiredpower can be fully generated bysolar energy photoconverters, havingmounted over the spar and chassis. Thearea <strong>of</strong> PGM cover fitted up from thephotoconverters l s × 2b would be 80–100m 2 for 20 m long spar and would protectPGM mechanism from precipitation. In
Precision and energy parameters <strong>of</strong> the positioned gantry module 194,0N, kWN max =4,77kW3,53,0positioningN=N k +N dWork <strong>of</strong> implement carriageN=N padpositioningN=N k +N d2,5a)2,01,5implement <strong>of</strong> carriage (P pv) N pad )left <strong>of</strong> left chassis chassis (N k) (P k)right <strong>of</strong> right chassis chassis (Nd)(P d)totaltotalpower(P)(N)correctioncorrection1,00,50,00 10 20 30 40 t, s 507,0N, kW6,0positioningwork <strong>of</strong> implement carriagepositioningwork <strong>of</strong> implement carriage5,04,0b)3,02,01,0correctioncorrection0,0130 135 140 145 150 155 t, s 160a – in electromechanical transmitter (mean parameters: v chas. = 0,083 m/s N važ = 0,89 kW, v pad = 0,57 m/s,N pad = 0,74 kW)b – in hydromechanical transmitter (v chas. = 0,390 m/s, N chas. = 3,29 kW, v impl. = 1,00 m/s, N impl. = 2,21 kW,intensity <strong>of</strong> corrections –3)FIGURE 5. Power variation fragment <strong>of</strong> asynchronous motorsthe long run, it is more viable to use theenergy <strong>of</strong> chemical fuel converters forPGM or to combine it with the use <strong>of</strong> solarenergy.For the calculation <strong>of</strong> energy input,it is necessary to estimate the capacitiesand power <strong>of</strong> implements W impl. andchassis W chas :W impl. = 0.36 l s B p /t p , == 0.36 B p v impl. , ha/h (1)W chas. = 0,36q/t == 0,36 l p v chas. , ha/h (2)where: l p – positioning distance, m.Since we cannot add these capacitiesor calculate their average, to find totalPGM capacity we have to calculateworking time input per ha <strong>of</strong> implementsand positioning and to add it. Total PGMlabour efficiency is calculated as aninverse value <strong>of</strong> total working time input.
20 G. Viselga, J.R. KamińskiE.g. in this way we calculate, that a 40m-long spar will provide a possibility forPGM to operate at 0.42 ha/h net labourefficiency.Summing up energy input <strong>of</strong> PGMpositioning and implements in workingpositions we can determine total energyinput.Having adopted the earlier-mentionedperspective PGM parameters and networking efficiency: for implements 0.45ha/h and chassis 7 ha/h, we determinedthat energy input <strong>of</strong> implements workequals 8.0 kWh/ha, and that <strong>of</strong> chassispositioning 0.6 kWh/ha. Therefore, totalenergy input can make up only 8.6 kWh/ha.CONCLUSIONS• When automatically controllingpositioned gantry module there has tobe a straight-line course maintenancesystem, e.g. according to the laserbeam.• Accuracy <strong>of</strong> positioning increasesat reduction <strong>of</strong> speed <strong>of</strong> movementchassis and with that <strong>of</strong> the connectedforces <strong>of</strong> inertia <strong>of</strong> the gantry unit.• Straight-line course deviations <strong>of</strong> theright chassis are reduced by distancingphotodiodes from the straight-linecourse positioned left chassis C > 0and reduction <strong>of</strong> their inter-axial distanceA. Mean square deviation whenincreasing the distance between photodiodesfrom 50 to 67 mm, increasedby 1.3 times, from 81 to 104 mm.• Energy input for a single-time soilloosening at 10 cm <strong>of</strong> the perspectivePGM amounts to 8.0 kWh/ha, forchassis positioning 0.6 kWh/ha, thetotal energy input can amount only toabout 8.6 kWh/ha.REFERENCESHOLT J.B., TILLETT N.D. 1989: The development<strong>of</strong> a nine metre span gantry forthe mechanized production and harvesting<strong>of</strong> cauliflowers and other field vegetables.Journal <strong>of</strong> agricultural engineeringresearch. Vol. 43, p. 125–135.QUICK R.G. 1987: Engineering an agriculturalfuture. Agricultural engineering.Australia. Vol. 16, p. 8–11.VISELGA G. 2006: Research <strong>of</strong> AccuracyParameters <strong>of</strong> the Gantry Course. SolidState Phenomena, Vol. 113 „MechatronicSystems and Materials“, p. 50–54.VISELGA G., BAREISIS R., SNIAUKAP. 2003: Investigation <strong>of</strong> positioningaccuracy <strong>of</strong> shuttle gantry tillage modules.Bioagrotechnical systems engineering.Research papers. <strong>Warsaw</strong> <strong>University</strong> <strong>of</strong>technology. Poland. No 2–3 (11–12),p. 127–134. (In Russian).VISELGA G. 1998: Investigation <strong>of</strong> theutilization <strong>of</strong> the principles <strong>of</strong> gantryagriculture in small fields. Doctoralthesis. Raudondvaris. (In Lithuanian).VISELGA G., KAMIŃSKI J.R. 2006: Analysis<strong>of</strong> soil compaction at potato cultivation.Zeszyty Problemowe PostępówNauk Rolniczych, 508: 203–208.Streszczenie: Precyzja i parametry energetycznepozycjonowanego modułu bramowego. Sterowaniepozycjonowaniem urządzenia bramowego(wózka narzędziowego) odbywa się za pomocąurządzenia laserowego. Generator laserowejwiązki promieniowania emitujący pionową wiązkępromieni, umieszczony jest na końcu uprawianegopola. Odbiornik laserowej wiązki promieniz fotodiodami zamontowany jest na module nastawczymurządzenia bramowego. Dokładnośćpozycjonowania została zbadana dla dwóch przypadków,gdy urządzenie laserowe zostało zamontowanena końcu wraz z toczącymi się rolkami,oraz gdy było zamontowane centralnie. Oszaco-
Precision and energy parameters <strong>of</strong> the positioned gantry module 21wano wielkość odchyleń przebiegu procesu w zależnościod zmian wzajemnego położenia emiteralaserowego i fotodiod. W teście użyto nadajnikaelektromagnetycznego. Moduł sterujący zamocowanybył na specjalnych rolkach prowadzących.Do napędu wykorzystano silnik elektryczny zasilanyprądem o napięciu 12 V z zabezpieczeniemtermicznym.Jan R. KamińskiWydział Inżynierii Produkcji <strong>SGGW</strong>Katedra Maszyn Rolniczych i Leśnych02-787 Warszawa, ul. Nowoursynowska 164Polande-mail: jan_kaminski@sggw.plMS. received June 2008Authors’ address:Gintas ViselgaVilnius Gediminas Technical <strong>University</strong>,Department <strong>of</strong> Machine Building,LT-03224 Vilnius, J. Basanaviciaus St. 28,Lithuaniae-mail: visgin@one.lt
<strong>Annals</strong> <strong>of</strong> <strong>Warsaw</strong> <strong>University</strong> <strong>of</strong> <strong>Life</strong> <strong>Sciences</strong> – <strong>SGGW</strong>Agriculture No 52 (Agricultural and Forest Engineering) 2008: 23–30(Ann. <strong>Warsaw</strong> Univ. <strong>of</strong> <strong>Life</strong> Sci. – <strong>SGGW</strong>, Agricult. 52, 2008)Methods for evaluation <strong>of</strong> breaking up <strong>of</strong> maize chaff separatedon the sieve separatorALEKSANDR LISOWSKI, KRZYSZTOF ŚWIĄTEK, KRZYSZTOF KOSTYRA,JAROSŁAW CHLEBOWSKIDepartment <strong>of</strong> Agricultural and Forest Engineering, <strong>Warsaw</strong> <strong>University</strong> <strong>of</strong> <strong>Life</strong> <strong>Sciences</strong> – <strong>SGGW</strong>,<strong>Warsaw</strong>, PolandAbstract: Methods for evaluation <strong>of</strong> breaking up<strong>of</strong> maize chaff separated on the sieve separator.The work aimed at determination <strong>of</strong> breakingup degree <strong>of</strong> maize chaff and grain with the use<strong>of</strong> the sieve separator, fabricated according toANSI/ASAE S424.1 Standard, and at comparison<strong>of</strong> the methods for evaluation <strong>of</strong> chaff particlelength distribution. As the quality indices <strong>of</strong>evaluation <strong>of</strong> maize breaking up degree therewere taken: geometric mean <strong>of</strong> chaff length,standard deviation <strong>of</strong> length and index <strong>of</strong> maizegrain breaking up. These indices were determinedon the basis <strong>of</strong> mass distribution. The threevarieties <strong>of</strong> maize plants were investigated: SAN,LG2244 and REDUTA <strong>of</strong> moisture content 62.8,59.4 and 63.2%, respectively, harvested with twoself-propelled forage harvesters. It was found thatthe chaff length ranged from 7.82 to 12.92 mm,depending on forage harvester used and maizevariety. The ANSI/ASAE S424.1 method fordetermination <strong>of</strong> geometric mean <strong>of</strong> chaff lengthwas verified with the use <strong>of</strong> Rosin-Rammlermodel, by calculating hypothetical dimension<strong>of</strong> sieve mesh, which passed through a half <strong>of</strong>material being sifted. The obtained results provedusability <strong>of</strong> both the methods for determination <strong>of</strong>the chaff length distribution.Key words: breaking up, sieve separator, chaffdistribution, method.INTRODUCTIONMaize silage is a basic feed used in nongrazingfeeding <strong>of</strong> cattle. To achieve thebest feeding results, the maize must beproperly broken up prior to ensilaging(Michalski 1997). As it is evident frommany research findings, in order to ensurebetter absorption <strong>of</strong> particular nutrientsone should try to get short chaff andhighest degree <strong>of</strong> maize grain breaking up.The forage harvesters equipped with thedrum chopping unit combine the optimalbreaking up <strong>of</strong> maize plants and grainduring harvesting. The sieve separator(analyzer) can be used in evaluation <strong>of</strong>chaff particle length and uniformity aswell as maize grain breaking up degree.The work aimed at determination <strong>of</strong>breaking up degree <strong>of</strong> maize chaff and grainwith the use <strong>of</strong> sieve separator fabricatedaccording to own technical documentationand ANSI/ASAE S424.1 Standard, andalso at comparison <strong>of</strong> the methods forevaluation chaff length distribution.As the quality indices <strong>of</strong> evaluation<strong>of</strong> maize breaking up degree there weretaken: geometric mean <strong>of</strong> chaff length,standard deviation <strong>of</strong> length and index <strong>of</strong>maize grain breaking up. These indiceswere determined on the basis <strong>of</strong> massdistribution.MATERIAL AND METHODSAnalysis <strong>of</strong> breaking up was executedfor three maize varieties: SAN, LG2244and REDUTA <strong>of</strong> moisture content
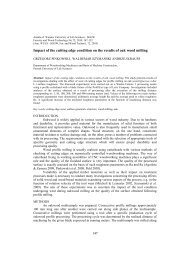
24 A. Lisowski et al.62.8, 59.4 and 63.2%, respectively.The varieties SAN and LG2244 wereharvested with forage harvester ClassJaguar 690 SL equipped with rowindependentattachment Champion3000; the mass productivity amountedto 71 t/h. The plants <strong>of</strong> REDUTA varietywere harvested with forage harvesterClass Jaguar 682 S equipped with 4-rowattachment; mass productivity amountedto 62 t/h. Both harvesters were equippedwith the drum chopping unit.In order to determine the percentagemass ratio <strong>of</strong> particular parts <strong>of</strong> amaize plant, 10 plants <strong>of</strong> each varietywere randomly chosen, divided intohomogeneous components and weighedon an electronic scale. Mean values aregiven in Table 1.The investigated chaff samples weretaken immediately after harvest from 5different places <strong>of</strong> the trailer (accordingto a single envelope method). Meansamples <strong>of</strong> each variety <strong>of</strong> volumeamounted to 10 liters were measured.The samples were put into the separator’scharging hopper (Fig. 1) to separatethem into fractions according to length.The separator was equipped with theshoe with rectangular sieves <strong>of</strong> squareshape mesh (Sar 2007) and dimensions406 × 565 mm. The shoe was driven byTABLE 1. Averaged parameters <strong>of</strong> plant materialParameterMaize varietyMaize variety SAN LG2244 REDUTAMass <strong>of</strong> whole plant[g] 730.06 559.65 549.20Mass <strong>of</strong> leaves at stem [g] 112.63 82.09 72.27Mass <strong>of</strong> stem [g] 271.46 237.12 184.49Mass <strong>of</strong> panicle [g] 2.72 1.59 3.96Mass <strong>of</strong> cob with leaves [g] 341.25 229.21 276.46Mass <strong>of</strong> leaves at cob [g] 32.53 14.06 15.84Mass <strong>of</strong> cob with grain [g] 281.94 212.42 246.53Mass <strong>of</strong> grain [g] 214.01 161.58 200.22Mass <strong>of</strong> torus [g] 64.93 40.32 46.04Length <strong>of</strong> plant [mm] 2401.00 2383.10 2741.00Number <strong>of</strong> grains on cob [pcs] 481.90 438.90 501.70Length <strong>of</strong> panicle [mm] 321.00 375.10 414.10Height <strong>of</strong> cob fixing [mm] 530.00 699.60 871.00Length <strong>of</strong> cob [mm] 209.00 198.90 165.50Diameter <strong>of</strong> cob [mm] 48.80 42.76 52.15Diameter <strong>of</strong> torus [mm] 18.00 14.69 14.26cutting 26.20 22.65 22.63250 [mm] 24.45 21.19 21.60500 [mm] 22.20 20.26 20.38Diameter <strong>of</strong> stem at height 750 [mm] 19.45 18.54 18.851000 [mm] 16.75 15.53 16.691250 [mm] 15.20 13.09 14.081500 [mm] 12.05 10.02 12.00
Methods for evaluation <strong>of</strong> breaking up <strong>of</strong> maize chaff separated... 25FIGURE 1. Sieve separator: 1 – base, 2 – gear box, 3 – electric motor, 4 – inverter, 5 – rubber shockabsorber, 6 – frame <strong>of</strong> ground wheels, 7 – guide <strong>of</strong> circular section, 8 – housing with linear bearing, 9– sieve, 10 – sieve shoe, 11 – eccentric mechanismeccentric mechanism, which allowed forhorizontal movement <strong>of</strong> sieves (imitatinghand sifting), consisted <strong>of</strong> complexmotion: rotary and to-and-fromotion.The separation time <strong>of</strong> each sampleamounted to 120 s, starting from themoment <strong>of</strong> stabilization <strong>of</strong> separator’selectric motor speed. Material particleswere separated on sieves dependingon their length; the sieve parametersand lengths <strong>of</strong> particles remaining onparticular sieves are given in Table 2. Theshoe movement frequency was equal to2.4 Hz (144 cycles per minute). Rotationalspeed <strong>of</strong> electric motor was controlled withinverter and monitored on electronic gauge.Upon completion <strong>of</strong> separation, the mass<strong>of</strong> mixture on each sieve and the bottom(Fig. 2) was weighed on an electronic scalewith accuracy 0.05 g. Besides, the wholegrains remaining on sieves were pickedup and weighed.The measurements for each varietywere repeated 30 times and the resultswere averaged. If material on the firstsieve weighed less than 1% <strong>of</strong> entire
26 A. Lisowski et al.TABLE 2. Parameters <strong>of</strong> sievesNo <strong>of</strong>sieveDimension <strong>of</strong> square opening[mm]Mesh diagonal, X i[mm]Mean length <strong>of</strong> particle[mm]1 19 26.9 482 12.7 18.0 223 6.3 8.98 12.74 3.96 5.61 7.15 1.17 1.65 3.04Bottom – – 0.82X iFIGURE 2. Effect <strong>of</strong> maize plant mixture separation (on sieves there are given mesh dimensionsin mm)sample, it was not considered in analysis<strong>of</strong> the chaff length; if mass <strong>of</strong> materialexceeded 1%, the length <strong>of</strong> particularparticles was measured with a slidecaliper.The effect <strong>of</strong> maize grain breaking upwas evaluated on the basis <strong>of</strong> breakingup index (Niewęgłowski 2006):mpuz− Σmcikz=⋅100 (1)mpuzwhere:k z – breaking up index <strong>of</strong> maize grain, %,m p – mass <strong>of</strong> chaff sample, g,u z – mass ratio <strong>of</strong> grains in the wholemaize plant,m ci – mass <strong>of</strong> unbroken maize grains oni-sieve, g.Mass ratio <strong>of</strong> grains in the wholemaize plant was determined basing onhand hulling <strong>of</strong> grains <strong>of</strong> 10 plants. Incombination with unbroken grain mass,
Methods for evaluation <strong>of</strong> breaking up <strong>of</strong> maize chaff separated... 27it enabled to determine effectiveness<strong>of</strong> maize grain breaking up by forageharvester.Geometric mean <strong>of</strong> chaff particlelength X gm and standard deviation S gmwere calculated according to ANSI/ASAE S424.1 Standard with equations:−1 Σ( m XXilog i)gm = logΣmi(2)1⎡2mi Xi − X ⎤−1Σ (log log gm)2Sgm= log ⎢⎥⎢ Σm⎣i ⎥⎦(3)where:m i – mass <strong>of</strong> chaff on i-sieve, g,X i – mean length <strong>of</strong> particle on i-sieve,mm.Length <strong>of</strong> particles on the first sieve(X l ) measured with a slide caliperaveraged to 48 mm for all varieties. Themean length <strong>of</strong> particle on the bottom(X 6 ) amounted to 0.82 mm (half <strong>of</strong>sieve diagonal <strong>of</strong> smallest dimension).Geometric means <strong>of</strong> lengths for theremaining sieves were calculated withequations:1Xi = [ Xi ⋅X( i−1)] 2 (4)where:X i – mesh diagonal <strong>of</strong> i-sieve (i = 2÷5), m,X (i-1) – mesh diagonal <strong>of</strong> sieve abovei-sieve, mm.In order to verify the geometricmean <strong>of</strong> chaff length calculated withANSI/ASAE S424.1 method there wasdetermined the particle mean value withthe use <strong>of</strong> modified dependence <strong>of</strong> Rosin-Rammler method. Thus, the hypotheticalvalue <strong>of</strong> sieve mesh X 50 (mesh diagonal)was evaluated, which passed through ahalf <strong>of</strong> material being sifted:bX− ⎛ XQ w = − ⎝ ⎜⎞⎟1 250 ⎠(5)where:Q w – cumulated frequency <strong>of</strong> undersievemass,X – mesh diagonal, mm,b – regression coefficient.By finding the double logarithmfor equation (5) there was obtained thefollowing linear equation <strong>of</strong> regressioncoefficients b and C:( )⎛log log 1−Qw⎞⎜⎟ =⎝ log 05 . ⎠= b⋅logX −b⋅ log X50== b⋅ log X + C(6)Knowing b coefficient and freeterm C in the equation (6) one couldcalculate X 50 . Regression coefficientswere determined with statistical methodswith the use <strong>of</strong> Statgraphics Plus v.4.1program.RESULTS OF MEASUREMENTSAND CALCULATIONSThe obtained breaking up indexes k zwere close to 1. In samples <strong>of</strong> SAN andLG2244 varieties <strong>of</strong> plants harvestedwith forage harvester Class Jaguar 690SL with row-independent attachment,the single grains were found (one piece
28 A. Lisowski et al.in three and two repetitions, respectively,in 30 samples), while in 14 samples (out<strong>of</strong> 30) <strong>of</strong> REDUTA variety, harvestedwith forage harvester Class Jaguar 682 Swith 4-row attachment, there were foundin total 23 unbroken grains (averagebelow 1 piece per sample).The mean chaff mass on sieves andtheir percentage ratio are presented inTable 3.X− ⎛ 1.779SAN: Q w = − ⎝ ⎜ ⎞⎠ ⎟1 2 11 . 12because: X 50 = 11.12 mm b = 1.79X− ⎛ 2.297LG2244: Q w = − ⎝ ⎜ ⎞⎠ ⎟1 2 782 .because: X 50 = 7.82 mm b = 2.297TABLE 3. Chaff mass on sieves for particular varietiesNo <strong>of</strong>sieveMassSAN LG 2244 REDUTASieve Q w Mass Sieve Q w Mass Sieveresidueresidueresidue[g] [%] [–] [g] [%] [–] [g] [%] [–]1 52.28 2.47 0.975 0 0.00 1.000 65.48 3.96 0.9602 251.4 11.85 0.857 139.94 6.71 0.933 229.01 13.87 0.8223 1169.96 55.17 0.305 1157.48 55.51 0.378 941.68 57.02 0.2514 322.88 15.22 0.153 406.98 19.52 0.183 267.01 16.17 0.0905 264.95 12.49 0.028 306.87 14.72 0.035 131.85 7.98 0.010Bottom 59.27 2.80 – 73.75 3.54 – 16.56 1.00 –Total 2120.74 100 – 2085.02 100 – 1651.59 100 –Q wIn the case <strong>of</strong> LG2244 variety thechaff mass on the first sieve amountedto less than 1% <strong>of</strong> the whole sample;therefore, it was assumed as 0.Substituting values <strong>of</strong> Tables 2 and3 to Equations (2) and (3) there wasobtained:Using Rosin-Rammler model (5) thefollowing equations were obtained:SAN: X gm = 9.93 mmS gm = 2.08 mmLG2244: X gm = 8.65 mmS gm = 2.04 mmREDUTA: X gm = 11.41 mmS gm = 1.87 mmX− ⎛ 2.122REDUTA: Q w = − ⎝ ⎜ ⎞⎠ ⎟1 2 12 . 92because: X 50 = 12.92 mm b = 2.122Figure 3 presents graphical representation<strong>of</strong> cumulated frequency <strong>of</strong> undersievemass Q w calculated with dependence(5). The smallest mesh dimension(7.82 mm) needed to sift 50% <strong>of</strong> samplemass for particular maize varieties wasfound for LG2244 variety, proving itsbest breaking up.
Methods for evaluation <strong>of</strong> breaking up <strong>of</strong> maize chaff separated... 291Frequencies <strong>of</strong> under-sieve mass, Q w0,90,80,70,60,50,40,30,20,10RedutaLG 2244San0 2 4 6 8 10 12 14 16 18 20 22 24 26Mesh diagonal, X i [mm]FIGURE 3. Cumulated frequencies <strong>of</strong> under-sieve mass for various maize varieties based on Rosin--Rammler modelSUMMARYThe obtained results enable t<strong>of</strong>ind that both forage harvesters werecharacterized by good breaking upefficiency. Almost 100% <strong>of</strong> grains werebroken, while optimal length <strong>of</strong> cutamounted to about 10 mm with relativelysmall scatter. Mean geometric lengths <strong>of</strong>particles differed from those calculatedwith Rosin-Rammler equation. Forvarieties SAN and REDUTA, X gm valueswere lower than X 50 by 12 and 13.2%,respectively, while for LG2244 varietyX gm was bigger than X 50 by 9.6%.However, these differences were notvery big, since they were contained in therange <strong>of</strong> scatter determined by standarddeviation. It proved the usability <strong>of</strong> boththe methods in determination <strong>of</strong> chafflength distribution.REFERENCESMICHALSKI T. 1997: Wartość pastewnaplonów kukurydzy w zależności od sposobówi terminów zbioru. Zeszyty ProblemowePostępów Nauk Rolniczych,450: 133–162.ANSI/ASAE S424.1 MAR98: Method <strong>of</strong> determiningand expressing participle size<strong>of</strong> chopped forage materials by screening.NIEWĘGŁOWSKI K. 2006: Wpływ czynnikówtechnicznych i eksploatacyjnychna wskaźniki jakościowe rozdrabnianiaroślin kukurydzy zbieranych sieczkarniąpolową. Praca doktorska, maszynopis.Warszawa <strong>SGGW</strong>.SAR Ł. 2007: Projekt konstrukcyjny separatorasitowego. Praca inżynierska,maszynopis. Warszawa <strong>SGGW</strong>.Streszczenie: Celem pracy było określenie stopniarozdrobnienia sieczki oraz ziarna kukurydzyza pomocą separatora sitowego wykonanego
30 A. Lisowski et al.według normy ANSI/ASAE S424.1 oraz porównaniemetod oceny rozkładu długości cząsteksieczki. Za wskaźniki jakościowe oceny stopniarozdrobnienia kukurydzy przyjęto średnią geometrycznądługości sieczki, odchylenie standardowedługości oraz wskaźnik rozdrobnienia ziaren kukurydzy.Wskaźniki te określono na podstawierozkładu masowego. Zbadano rozdrobnienie roślinkukurydzy odmian SAN, LG2244 i REDU-TA, o wilgotności odpowiednio 62,8, 59,4 i 63,2%zbieranych dwiema sieczkarniami samojezdnymi.Stwierdzono, że długość sieczki zawiera się wzakresie 7,82-12,92 mm i zależy od zastosowanejsieczkarni oraz odmiany kukurydzy. Metodęwyznaczenia średniej geometrycznej długościsieczki według ANSI/ASAE S424.1 zweryfikowanoposługując się modelem Rosina-Rammlera,obliczając hipotetyczny wymiar oczka sita, przezktóry przechodzi połowa masy przesiewanegomateriału. Uzyskane wyniki świadczą o przydatnościobydwu metod do opisywania rozkładu długościsieczki.MS. received May 2008Authors’ address:Szkoła Główna Gospodarstwa WiejskiegoKatedra Maszyn Rolniczych i Leśnych02-787 Warszawa, ul. Nowoursynowska 166,tel. +22 5934527,e-mail: aleksander_lisowski@sggw.pl
<strong>Annals</strong> <strong>of</strong> <strong>Warsaw</strong> <strong>University</strong> <strong>of</strong> <strong>Life</strong> <strong>Sciences</strong> – <strong>SGGW</strong>Agriculture No 52 (Agricultural and Forest Engineering) 2008: 31–37(Ann. <strong>Warsaw</strong> Univ. <strong>of</strong> <strong>Life</strong> Sci. – <strong>SGGW</strong>, Agricult. 52, 2008)Economic efficiency <strong>of</strong> growing and technological processesfor cerealsJAROSLAV JÁNSKÝ, IVA ŽIVĚLOVÁDepartment <strong>of</strong> Business and Economics, Mendel <strong>University</strong> <strong>of</strong> Agriculture and Forestry, Brno, CzechRepublicAbstract: Economic effi ciency <strong>of</strong> growing andtechnological processes for cereals. The paperdeals with the draft <strong>of</strong> silviculture/technologicalprocesses for selected crops in organic system <strong>of</strong>farming. The impact <strong>of</strong> recommended silviculturetechnologies on economics <strong>of</strong> selected field cropsgrowing was carried out in order to increasethe competitiveness as well as the comparisonto economic results in conventional system <strong>of</strong>farming, which can contribute to increasing share<strong>of</strong> cereals grown on arable land thereby meetingincreasing demand for bio-products <strong>of</strong> organicorigin in the Czech Republic.Key words: organic farming, cereals, silviculture/technological processes, economic efficiency.INTRODUCTIONGrowth <strong>of</strong> crops is complex and includesa range <strong>of</strong> forms. Field crops are themost important among them. Thesesecure the main part <strong>of</strong> human nutrition.Nevertheless, field crops it is possibleto consider as „ecosystems in which isman not only important force, but forthis kind <strong>of</strong> ecosystem also the necessarycondition for its existence. Man usesfield crops so, that significant share <strong>of</strong>its energy, which the crops gain from thephotosynthesis process, gets out duringthe harvesting from the place <strong>of</strong> rise andregulates the stream <strong>of</strong> energy into theplaces <strong>of</strong> need (Jánský 2005).The agriculture in the European conditionsshould be multifunctional, sustainableand competitive. Approximationor achieving the sustainable agriculturedemands: decrease <strong>of</strong> inputs, increasingthe efficiency <strong>of</strong> all used sources andgreater use <strong>of</strong> natural processes as biologicalnitrogen fixation, circulation <strong>of</strong>nutrients, prevention in plant protectionand so on. These general principles mustbe realized in individual growing technologies.The system <strong>of</strong> organic farming,in adequate extent and in selectedconditions together with observance <strong>of</strong>environment friendly or equilibriumrules in agro-systems is one <strong>of</strong> the ways,which could play very important rolefor sustainability <strong>of</strong> agriculture but withlower yields.GOAL AND METHODOLOGYThe result <strong>of</strong> this paper is formulation <strong>of</strong>recommended silviculture/technologicalprocesses <strong>of</strong> selected cereals in organicsystem <strong>of</strong> farming. Evaluation <strong>of</strong> theimpact <strong>of</strong> recommended silviculturetechnologies on selected cereals growingand comparison with economic resultsin conventional systems <strong>of</strong> farmingwas carried out for increasing thecompetitiveness. It is assumed that theachieved results contribute to increasethe share <strong>of</strong> crops grown on arable land
Economic effi ciency <strong>of</strong> growing and technological processes for cereals 33growing stages it is possible to harrow innecessary cases and with lower effect.Inter-row distance is important forweed regulation. Line weed controlneeds minimal inter-row distance <strong>of</strong> 16cm and more. Inter-row distance <strong>of</strong> 8––12 cm could be use together with weedregulation done by harrowing. Vegetationgrown in narrower rows inhibits betterthe weeds. The use <strong>of</strong> narrow rows is lesslabor intensive. Line weeding is possibleto choose while greater occurrence <strong>of</strong>weeds.Recommended growing andtechnological processes for cerealsgrowing and its evaluation for winterwheatWheat is the most important foodcereal and as food is used in corn andbeat growing regions. Wheat flower isused in food industry for bread bakingand for other wide range <strong>of</strong> bakery andpasta. The grain is processed into groutand semolina, together with millingwaste is grain valuable feed. The grainis in smaller amounts used as industrymaterial for starch production, alcoholand beer production. Wheat straw is usedas bedding.It is the most demanding for soilfertility and water accessibility out <strong>of</strong>all crops. The use <strong>of</strong> nutrients per onehectare is clear from Table 1. It uses verygood deep and heavier soils with largewater capacity. Very light or shallow andpeaty soils are not suitable for it.TABLE 1. Nutrients consumption (kg/ha)N P 2 O 5 K 2 OOrganic farming 60 29 58Conventional farming 119 57 114Winter form <strong>of</strong> wheat reacts the mostsensibly from all crops to the crop grownin prior season. Very good prior-cropsfor winter wheat in this means are cropswith wide leafs or crops fertilized withmanure. For example it can be perennialfodder crops (besides the drier areas,where it can worsen the water regime forconsequent crop). Other very good cropsare leguminous crops, pulse-cerealsmixed green crops, early and semi-earlypotatoes and corn for silage. These kinds<strong>of</strong> crops are important for the quality<strong>of</strong> winter wheat, especially concerningthe amount <strong>of</strong> aleurone. The highestamounts <strong>of</strong> aleurone are after clover andpulse crops.Winter wheat is grown by number <strong>of</strong>farmers in the organic system <strong>of</strong> farming.The efficiency <strong>of</strong> farming is determinedabove all by costs and revenues. Theoverview <strong>of</strong> average costs per one hectare<strong>of</strong> harvested area while following abovementioned technological processes insystem <strong>of</strong> organic farming is clear fromTable 2.TABLE 2. Structure <strong>of</strong> average costs and revenuesfor winter wheat in system <strong>of</strong> organic farmingCosts per 1haIndicator<strong>of</strong> harvestedarea (CZK)Seeds 1 765Fertilizers 1 113Other direct material costs 210Direct material costs in total 3 088Costs <strong>of</strong> growing technology 4 619Indirect costs 2 735Costs in total 10 442Marginal contribution 619Costs <strong>of</strong> major product (CZK/t) 3 829Per hectare yield (t/ha) 2.40Average farmers’ price (CZK/t) 3 469
Economic effi ciency <strong>of</strong> growing and technological processes for cereals 35TABLE 4. Characteristics <strong>of</strong> costs and revenues for winter wheat in the sample file <strong>of</strong> organic farmersIndicator Average Minimal value Maximal value MedianSeeds 1 787.60 750.00 2 440.00 1 600.00Fertilizers 1 307.10 875.00 5985.00 1 859.00Other direct material costs 35.00 0.00 520.00 24.00Direct material costs in total 3 129.71 1 625.00 8 945.00 3 483.00Costs <strong>of</strong> growing technology 5 643.39 948.00 21 518.00 4 343.00Indirect costs 1 618.16 x x 5 048.00Costs in total 10 391.26 7 407.00 24 203.00 12 874.00Marginal contribution –443.46 x x 5 043.70Costs <strong>of</strong> major product (CZK/t) 6 178.08 2 332.64 8 048.37 4 315.59Per hectare yield (t/ha) 2.03 1.14 4.15 3.10Average farmers’ price (CZK/t) 4 110.33 3 199.99 5 000.04 4 151.52is by 276 CZK less than it is set inrecommended technological process.Marginal contribution presented bymedian is in the sample file higher thanthe average shown in Table 2, i.e. by1062 CZK per one hectare. It is causedby higher per hectare yield and lowervariable costs.Even when the comparison <strong>of</strong> thesample file <strong>of</strong> organic farmers withthe set recommended value is for thesample file favorable, in comparisonto conventional farmers is organicallygrown winter wheat by far less efficient,which is possible to deduce from data inTable 5.Total per hectare costs shown byorganic farmers have by 3972 CZKlower average value than companies inconventional system <strong>of</strong> farming. In themeans <strong>of</strong> median it is less by 1489 CZK.The main reason for lower costs is theabsence in use <strong>of</strong> chemical protectivemeans by organic farmers as well asman-made fertilizers, which is clear fromindexes in Table 6.TABLE 5. Structure <strong>of</strong> average costs andrevenues <strong>of</strong> winter wheat in conventional system<strong>of</strong> farmingCosts per 1 haIndicator<strong>of</strong> harvestedarea (CZKSeeds 1 078Fertilizers 2 509Other direct material costs 2 659Direct material costs in total 6 246Costs <strong>of</strong> growing technology 5 824Indirect costs 2 293Costs in total 14 363Marginal contribution 3 155Costs <strong>of</strong> major product (CZK/t) 2 667Per hectare yield (t/ha) 4.74Average farmers’ price (CZK/t) 3 212Different per hectare yield is exposedinto costs per one ton <strong>of</strong> grain. Perhectare yield is in this sample file <strong>of</strong>organic farmers in the range <strong>of</strong> 1.14 till4.15 tons per hectare, while in the system<strong>of</strong> conventional farming it is in average4.74 tons. Different is average farmers’price as well, in the sample file <strong>of</strong> organic
36 J. Jánský, I. ŽivělováTABLE 6. Comparison <strong>of</strong> average costs andrevenues <strong>of</strong> winter wheat for companies farmingin organic and conventional conditionsIndicatorIndexSeeds 1.64Fertilizers 0.44Other direct material costs 0.08Direct material costs in total 0.49Costs <strong>of</strong> growing technology 0.79Indirect costs 1.19Costs in total 0.73Marginal contributionxCosts <strong>of</strong> major product (CZK/t) 1.44Per hectare yield (t/ha) 0.51Average farmers’ price (CZK/t) 1.08farmers it is 3200 till 5000 CZK per onetone <strong>of</strong> grain – the average is only 4110CZK. From the median in the level <strong>of</strong>4152 CZK it is possible to conclude thatorganic farmers are partially selling theorganic winter wheat as organic product.Nevertheless, the winter wheat seemsto be unpr<strong>of</strong>itable crop in the system <strong>of</strong>organic farming.CONCLUSIONImportant aspect that influences the decision-making<strong>of</strong> farmers about transformationinto organic farming is economicresults. For better awareness inthis area it is necessary to compare theeconomic results <strong>of</strong> individual sectors inconventional as well as organic systems<strong>of</strong> farming and thus to get objective datafor consequent decision-making abouthow to contribute to the development <strong>of</strong>organic farming especially on the arableland, which represents in the conditions<strong>of</strong> the Czech Republic 7.5% out <strong>of</strong> totalarea <strong>of</strong> organically farmed land.The result <strong>of</strong> this paper is formulation<strong>of</strong> recommended silvicultural/technologicalprocesses <strong>of</strong> selected cereals in organicsystem <strong>of</strong> farming. Similar analysis as itwas carried out for winter wheat was alsosolved in the research project for other cerealsas spring wheat, spelt, winter barley,oats, rye, triticale and some other plantsgrown on arable land.Evaluation <strong>of</strong> the impact <strong>of</strong> recommendedsilvicultural technologies onselected field crops growing and comparisonwith economic results in conventionalsystems <strong>of</strong> farming was carriedout for increasing the competitiveness,which can contribute to increasethe share <strong>of</strong> crops grown on arable landthereby meeting increasing demand forbio-products <strong>of</strong> organic origin in theCzech Republic.REFERENCESJÁNSKÝ J.: Analysis <strong>of</strong> the current situationin sales <strong>of</strong> selected organic products in theCzech Republic. Zemědělská ekonomikač. 7, 51, Praha 2005, p. 309–313.Jánský J., Živělová I: Analýza vztahu cena nákladů na vybrané rostlinné bioprodukty.Sborník příspěvků z mezinárodníhovědeckého semináře „Manažment a ekonomikaekologickej polnohospodárskejvýroby“, SPU Nitra, 2005, p. 39–42.(zborník anotácií).Streszczenie: Ekonomiczna efektywność technologiiuprawy zbóż. W pracy przedstawiono projektprzebiegu technologii uprawy zbóż w systemierolnictwa organicznego w aspekcie ekonomicznym.Otrzymane wyniki porównano z efektamiekonomicznymi dla rolnictwa tradycyjnegow Republice Czeskiej i stwierdzono, że technologierolnictwa organicznego mogą być konkurencyjneprzy rosnącym popycie na biomasę pochodzącąz upraw roślin zbożowych.
Economic effi ciency <strong>of</strong> growing and technological processes for cereals 37MS. received June 2008Authors’ addresses:Jaroslav JánskýDepartment <strong>of</strong> Business and EconomicsFaculty <strong>of</strong> EconomicMendel <strong>University</strong> <strong>of</strong> Agriculture and ForestryBrnoZemědělská 1, 613 00 Czech Republice-mail: jansky@mendelu.czIva ŽivělováDepartment <strong>of</strong> Business and EconomicsFaculty <strong>of</strong> EconomicMendel <strong>University</strong> <strong>of</strong> Agriculture and ForestryBrnoZemědělská 1, 613 00 Czech Republice-mail: zivelova@mendelu.cz
<strong>Annals</strong> <strong>of</strong> <strong>Warsaw</strong> <strong>University</strong> <strong>of</strong> <strong>Life</strong> <strong>Sciences</strong> – <strong>SGGW</strong>Agriculture No 52 (Agricultural and Forest Engineering) 2008: 39–44(Ann. <strong>Warsaw</strong> Univ. <strong>of</strong> <strong>Life</strong> Sci. – <strong>SGGW</strong>, Agricult. 52, 2008)Effect <strong>of</strong> storage conditions on biological value <strong>of</strong> wheat and barleygrainCZESŁAW WASZKIEWICZ, MICHAŁ SYPUŁADepartment <strong>of</strong> Agricultural and Forest Engineering, <strong>Warsaw</strong> <strong>University</strong> <strong>of</strong> <strong>Life</strong> <strong>Sciences</strong> – <strong>SGGW</strong>,<strong>Warsaw</strong>, PolandAbstract: Effect <strong>of</strong> storage conditions onbiological value <strong>of</strong> wheat and barley grain. Therewas compared the rate <strong>of</strong> mould attacking <strong>of</strong> wheatand barley grain during storage at temperatures20, 25 and 30°C and relative air humidity 94and 99%. The samples were put in a climaticchamber and constant storage conditions weremaintained. Using linear regression method therewere determined equations describing the rate <strong>of</strong>grain attacking, as a function <strong>of</strong> storage time forparticular storage conditions. Basing on carriedout analysis <strong>of</strong> investigation results it was provedthat the wheat grain was earlier attacked by mouldand it lost its germination capacity earlier, whencompared to barley grain.Key words: grain, wheat, barley, germinationcapacity, mould.INTRODUCTIONGrain is a live organism, with continuoustransformations going inside it. Thepurpose <strong>of</strong> proper storage is to inhibitbiological processes to the highestpossible extent and to eliminateunfavourable environmental factors,which limit duration <strong>of</strong> the safe storage.The biochemical processes occurring ingrain are directly influenced by moisturecontent, air temperature, contact withair and condition <strong>of</strong> grain (degree <strong>of</strong>damage) (Janowicz 2005; Ryniecki1998; Waszkiewicz 1986).The best-known criteria for safestorage are: degree <strong>of</strong> mould development,degree <strong>of</strong> deterioration <strong>of</strong> germinationability and amount <strong>of</strong> carbon dioxideemission and the connected loss in graindry mass (Ryniecki 1998).A general equation for calculation <strong>of</strong>permissible duration <strong>of</strong> wheat storagedepending on storage conditions anddegree <strong>of</strong> mechanical damage <strong>of</strong> grainwas developed by Al-Yahya (1999), whoassumed the amount <strong>of</strong> cargo dioxideemission as an evaluation criterion.The time <strong>of</strong> loosing 1% <strong>of</strong> grain masswas taken in this equation as the indexfor determination <strong>of</strong> admissible time <strong>of</strong>wheat storage there.Wilcke et al. (2000) determinedpermissible duration <strong>of</strong> maize grainstorage with the use <strong>of</strong> Thompsonequation; they calculated the loss <strong>of</strong> graindry mass as a function <strong>of</strong> time and amount<strong>of</strong> carbon dioxide emission, and assumedthe time <strong>of</strong> loosing 0.5% <strong>of</strong> grain dry massas permissible time <strong>of</strong> storage.In references one can find a generalmathematical model for prediction thevitality <strong>of</strong> grain <strong>of</strong> high content <strong>of</strong> starch,protein and oil depending on storageconditions; the equilibrium relativemoisture content was used in modeldescription instead the grain moisturecontent (Chen and Jayas 2000).The most severe criterion for grainis development <strong>of</strong> mould, leading to
40 Cz. Waszkiewicz, M. Sypułaspoilage <strong>of</strong> grain by deterioration <strong>of</strong>its sowing, feeding and technologicalvalue.Therefore, this work aimed atdetermination <strong>of</strong> the effect <strong>of</strong> storageconditions for wheat and barley grainon mould development and changes ingermination energy and capacity duringstorage. The temperature, air humidityand time <strong>of</strong> storage were taken asparameters for determination <strong>of</strong> storageconditions.MATERIAL AND METHODSThe investigations were carried out onwinter wheat grain <strong>of</strong> Flair variety andspring barley grain <strong>of</strong> Justyna varietyharvested in 2006. Grain was put intoclimatic chamber KPK200 <strong>of</strong> Feutronmake and was stored in galvanizedcontainers at fixed temperature and airmoisture content. Investigations wereexecuted at the following air parametersin the chamber:––3 temperature levels (20°C, 25°C and30°C),2 levels <strong>of</strong> relative humidity (94%and 99%).Relative air humidity set up in thechamber to 94% and 99% enabled tosteady the equilibrium moisture content<strong>of</strong> grain at given temperature duringstorage. The equilibrium moisturecontent ranged from 20.2 to 23.6% forwheat grain and from 19.8 to 24.8%for barley grain, depending on storageparameters.Temperature and air humidity in thechamber were measured with the use <strong>of</strong>hytherograph LB-701 <strong>of</strong> LAB-EL make,with maximal error <strong>of</strong> temperaturemeasurements 0.4°C and maximalerror <strong>of</strong> moisture content measurements1.5%.Then, at specified time intervals3 grain samples were taken out <strong>of</strong>the chamber, each <strong>of</strong> 100 pieces, andthere was determined the number <strong>of</strong>mould attacked grains and germinationcapacity.The mould attacked grain wasevaluated visually with the use <strong>of</strong>magnifying glass, searching forcharacteristic symptoms <strong>of</strong> mould(white, then green, green and yellow,and brown or black). After counting<strong>of</strong> mould-attacked seeds, there wascalculated their percentage ratio in entireamount <strong>of</strong> seeds taken from the samples.The germination capacity and energy forwheat and barley grain were investigatedaccording to PN-79/R-95950 with theuse <strong>of</strong> Jacobsen’s germination apparatus.The germination energy was determinedafter 3 days (barley) and 4 days (wheat)<strong>of</strong> keeping grain in the apparatus, whilethe measurements on germinationcapacity were executed after 7 and 8days, respectively.RESULTS OF INVESTIGATIONSAND DISCUSSIONThe multifactor analysis <strong>of</strong> varianceproved that all three consideredindependent variables (temperature,relative air humidity, time <strong>of</strong> storage)influenced significantly the moulddevelopment and germination capacity.The results presented in Figure 1 pointout that temperature 30°C and humidity99% are the most favourable conditionsfor mould development, since after twodays 10% <strong>of</strong> wheat grain was attacked,
Effect <strong>of</strong> storage conditions on biological value <strong>of</strong> wheat and barley grain 41a) b)rate <strong>of</strong> mould development[%]7060wheat5040302010barley00 5 10 15storage time [days]rate <strong>of</strong> moulddevelopment [%]50403020100wheatbarley0 5 10 15 20storage time [days]c)rate <strong>of</strong> mould development[%]100806040wheat20barley00 10 20 30storage time [days]FIGURE 1. Changes in mould development as a function <strong>of</strong> storage time at air humidity 99% and temperature:a) 30°C, b) 25°C, c) 20°Cand after 12 days this figure increased toabove 50%. For barley grain this processwas even quicker; at the same parameters30% <strong>of</strong> grain was attacked by mould.At the remaining temperature (20°Cand 25°C) the mould creation processwas slower than at 30°C, while the firstsymptoms <strong>of</strong> mould were found after 3days on mechanically damaged grain.After 12 days <strong>of</strong> storage mould wasfound on 42% <strong>of</strong> seeds at temperature25°C and 26% at temperature 20°C,and after three weeks all the grain wasattacked. It was also found that themould process was slower in the initialperiod, and later on it was quicker. This isbecause the mouldy grain is a good focus<strong>of</strong> infection for the adjacent grain. Therate <strong>of</strong> mould development in barley waslower under the same storage conditions;at temperature 20°C after three weeksonly 40% <strong>of</strong> grain was affected.Figure 2 presents comparison betweenrate <strong>of</strong> mould development on consideredgrain at temperature 20°C and 25°Cat constant relative air humidity 94%.After 16 days <strong>of</strong> storage at temperature25°C the percentage <strong>of</strong> attacked wheatgrain amounted to 70%, while for thebarley grain to 30%. The rate <strong>of</strong> moulddevelopment in the same time at lowertemperature (20°C) was slower andamounted to 17 and 12% for wheat andbarley, respectively.The rate <strong>of</strong> mould development as afunction <strong>of</strong> storage time was describedby empirical formulae and presented inTable 1.
42 Cz. Waszkiewicz, M. Sypułaa) b)note rate <strong>of</strong> moulddevelopment [%]80706050403020100wheatbarley0 4 8 12 16 20rate <strong>of</strong> moulddevelopment [%]80706050403020100wheatbarley0 5 10 15 20 25 30 35 40 45 50 55storage time [days]storage time [days]FIGURE 2. Changes in mould development as a function <strong>of</strong> storage time at air humidity 94% andtemperature: a) 25°C, b 20°CTABLE 1. Empirical dependencies for rate <strong>of</strong> mould development during grain storageCereals Regression equationApplication rangeCorrelationcoefficient Rstorageair humiditystorage timetemperaturewheat y = 4.1863t s + 1.9104 0.988 99% 30°C 2 – 12 daysbarley y = 3.0661 t s – 12.3 0.989 99% 30°C 5 – 14 dayswheat y = 4.7229 t s – 9.5714 0.983 99% 25°C 3 – 12 daysbarley y = 2.1111 t s – 5.1111 0.985 99% 25°C 3 – 16 dayswheat y = 5.2615 t s – 25.344 0.947 99% 20°C 3 – 20 daysbarley y = 2.1656 t s – 10.163 0.978 99% 20°C 3 – 24 dayswheat y = 5.1521 t s – 19.727 0.970 94% 25°C 3 – 17 daysbarley y = 2.167 t s – 5.7895 0.981 94% 25°C 3 – 16 dayswheat y = 2.5737 t s – 21.263 0.980 94% 20°C 6 – 36 daysbarley y = 1.3187 t s – 10.802 0.973 94% 20°C 6 – 54 dayswhere: y – ratio <strong>of</strong> mould attacked grain in the sample [%], t s – storage time [days]The obtained high correlationcoefficients for regression equationsallow for their application for practicalpurposes.The results <strong>of</strong> germination energyand capacity enabled to evaluate theusability <strong>of</strong> wheat and barley grainas sowing material during storage athumidity 99% and temperature 30°C.Considering diagrams on Figure 3 andthe obtained equations (Tab. 2) onecan find that germination energy andcapacity decrease with time <strong>of</strong> storagein the climatic chamber. This is provedby nature <strong>of</strong> equations and negativevalue <strong>of</strong> correlation coefficient. After47 days <strong>of</strong> barley grain storage thegermination energy decreased to 67%,while germination capacity to 79%. Thesame figures for wheat grain amountedto 12% and 16%, respectively. Theobtained results were strongly influencedby mould development, enhanced byprevailing storage conditions, at whichthe grain were loosing its sowing value.In the investigated period the difference
Effect <strong>of</strong> storage conditions on biological value <strong>of</strong> wheat and barley grain 43a) b)Ek, Zk [%]100806040200ZkEk0 5 10 15 20 25 30 35 40 45 50storage time [days]Ek, Zk [%]1009080706050403020100EkZk0 5 10 15 20 25 30 35 40 45 50storage time [days]FIGURE 3. Changes in germination capacity and germination energy during storage: a) – wheat,b) – barleyTABLE 2. Regression dependencies <strong>of</strong> germination energy and capacity on storage time at temperature30°C and relative humidity 99%Cereal Parameter EquationCorrelationcoefficient RStorage timePszenica Germination energy E k = –1.794 t s + 89.59 –0.933 0–47 daysGermination capacity Z k = –1.84 t s + 94.03 –0.936 0–47 daysJęczmień Germination energy E k = –0.40 t s + 86.15 –0.912 0–48 daysGermination capacity Z k = –0.387 t s + 95.68 –0.910 0–48 daysbetween germination energy andgermination capacity did not exceed 5%for wheat and 10% for barley.Dependencies <strong>of</strong> germination capacityand germination energy during storageon storage time are described by regressionequations presented in Table 2.CONCLUSIONS• The considered storage conditions(temperature, air humidity and time<strong>of</strong> storage) significantly influencedegree <strong>of</strong> mould infection <strong>of</strong> wheatand barley grain. Under the samestorage conditions, the rate <strong>of</strong> moulddevelopment on wheat grain is biggerthan on barley grain.• The germination capacity and energydeteriorate with storage time; in entireinvestigated period the germinationenergy was lower on the average by10% for barley and by 4% for wheatthan their germination capacity.• The obtained empirical equationsallow for fairly accurate description<strong>of</strong> the mould development rate andchanges in grain germination capacitydepending on storage time.REFERENCESAL-YAHYA S.A. 1999: Deterioration rates <strong>of</strong>wheat as measured by CO2 production.Can.Agricult.Eng. Vol. 41 (3), 161–166.CHEN C., JAYAS D.S. 2000: Relatingequilibrium relative humidity and
44 Cz. Waszkiewicz, M. Sypułatemperature to seed longevity. Agricult.Eng. J. Vol. 9 (3-4), 129–138.JANOWICZ L. 2006: Wpływ zmian mikrobiologicznychna jakość ziarna zbóżw czasie przechowywania. Przegląd zbożowo-młynarski,4 s. 33.RYNIECKI A., 1998: Warunki bezpiecznegoprzechowywania ziarna Przegląd zbożowo-młynarski,10 s. 31–32.WASZKIEWICZ Cz., 1986: Analiza i dobórtechnologii konserwowania ziarna zbóżdla potrzeb gospodarstwa rolnego. Rozprawynaukowe i monografie. Wydawnictwo<strong>SGGW</strong>-AR, Warszawa.WILCKE W.F., GUPTA P., MERONUCKR.A., MOREY R.V. 2000: Effect <strong>of</strong>changing temperature on deterioration <strong>of</strong>shelled corn. Trans. ASAE, Vol. 43 (5),1195–1201.Streszczenie: Wpływ warunków przechowywaniana wartość biologiczną ziarna pszenicy i jęczmienia.Dokonano porównania tempa porażenia pleśniąziarniaków pszenicy i jęczmienia podczas ichprzechowywania w temperaturach 20, 25 i 30°Coraz przy wilgotności względnej powietrza 94i 99%. Stałe warunki przechowywania byłyutrzymywane przez umieszczenie próbek ziarnaw komorze klimatycznej. Metodą regresji liniowejwyznaczono równania opisujące tempo porażeniaziarniaków w funkcji czasu przechowywania dlaposzczególnych warunków przechowywania. Napodstawie przeprowadzonej analizy wynikówbadań wykazano, że warunki przechowywania(temperatura i wilgotność powietrza oraz czasprzechowywania) istotnie wpływają na stopieńporażenia pleśnią ziarna pszenicy i jęczmienia.Przy tych samych warunkach przechowywaniatempo rozwoju pleśni na ziarniakach pszenicy jestwiększe w porównaniu do jęczmienia.MS. received June 2008Authors’ address:Katedra Maszyn Rolniczych i LeśnychSzkoła Główna Gospodarstwa Wiejskiego02-787 Warszawa, ul. Nowoursynowska 164
<strong>Annals</strong> <strong>of</strong> <strong>Warsaw</strong> <strong>University</strong> <strong>of</strong> <strong>Life</strong> <strong>Sciences</strong> – <strong>SGGW</strong>Agriculture No 52 (Agricultural and Forest Engineering) 2008: 45–50(Ann. <strong>Warsaw</strong> Univ. <strong>of</strong> <strong>Life</strong> Sci. – <strong>SGGW</strong>, Agricult. 52, 2008)Investigations on drying <strong>of</strong> new pumpkin varietiesMARIUSZ SOJAK, SZYMON GŁOWACKIDepartment <strong>of</strong> Fundamental Engineering, <strong>Warsaw</strong> <strong>University</strong> <strong>of</strong> <strong>Life</strong> <strong>Sciences</strong> – <strong>SGGW</strong>, <strong>Warsaw</strong>,PolandAbstract: Investigations on drying <strong>of</strong> newpumpkin varieties. The paper presents preliminaryinvestigations and verification <strong>of</strong> models fordrying <strong>of</strong> new pumpkin varieties in the first dryingperiod, with consideration to shrinkage in volume,and in the second drying period. In calculationsthere were used results <strong>of</strong> measurements onkinetics <strong>of</strong> drying (in forced convection) <strong>of</strong>pumpkin particles (cross-cut perpendicularlyto fibres) in the shape <strong>of</strong> a plate <strong>of</strong> thickness5 and 10 mm, at drying medium temperature80°C, drying medium speed 1.2 m·s –1 . The results<strong>of</strong> measurements on changes in pumpkin particlevolume were also used in calculations. The dryingprocess was executed in a tunnel dryer.Key words: pumpkin, convectional drying, forcedconvection, model, shrinkage.NotationK – drying coefficient in the secondperiod, min –1 ,N – coefficient, dimensionless,a – coefficient, dimensionless,b – maximum value <strong>of</strong> shrinkagecoefficient, dimensionless,k 0 – constant drying rate, min –1 ,M s – dry mass <strong>of</strong> solid particle, %,u – moisture content <strong>of</strong> solid particle,kg·kg –1 ,u e – equilibrium moisture content <strong>of</strong>solid particle, kg·kg –1 ,u 0 – initial moisture content <strong>of</strong> driedparticle, kg·kg –1 ,u cr – critical water content, kg·kg –1 ,δ – relative error, %,∆ – error, dimensionless,τ – time <strong>of</strong> drying, min,τ cr – time <strong>of</strong> drying while water content,u = u cr , min.INTRODUCTIONIn recent years one can find a constantlyincreasing interest in the products made<strong>of</strong> pumpkin fruits, expressed by feed,pharmaceutical and food industries. Tomeet new requirements <strong>of</strong> consumers, inDepartment <strong>of</strong> Plant Genetics, Breedingand Biotechnology <strong>of</strong> WULS therewere created new pumpkin varieties<strong>of</strong> improved quality in terms <strong>of</strong>: taste,nutritional and technical value (s<strong>of</strong>texternal cover, improved colour <strong>of</strong>flesh and cover, reduced volume <strong>of</strong>seed pocket. Investigations were carriedout on drying <strong>of</strong> two edible pumpkinvarieties (Justynka and Amazonka) andone feeding variety (Ambar). In hithertoreferences, apart from the Authors’investigations, there is lack <strong>of</strong> data onpumpkin drying, particularly on drying<strong>of</strong> new varieties. More detailed learningand scientific explanation <strong>of</strong> the processis important with respect to both thecognitive and utilization aspects. Thedrying process coefficients determinedin this work can be used in optimization<strong>of</strong> convectional drying process and alsoin improvement <strong>of</strong> dryers’ design.
46 M. Sojak, Sz. GłowackiMODELLING OF VEGETABLECHIPS DRYINGProcess <strong>of</strong> convectional drying <strong>of</strong>very moist solid bodies occurs in twosignificantly different drying periods. Inthe first period the process is influencedby conditions <strong>of</strong> water particle transportfrom the surface <strong>of</strong> body subjected todrying through the boundary layer <strong>of</strong>gas; in conventional second period <strong>of</strong>drying, the process is influenced bythe conditions <strong>of</strong> internal diffusion <strong>of</strong>these particles to body surface. In fact,transition from the first to second periodproceeds constantly. This period is calleda transitory period and it is not welllearned theoretically, while only parts<strong>of</strong> its mathematical models are known(Jaros and Pabis 2006). The kineticmodel considering the effect <strong>of</strong> dryingshrinkage was checked in this work inthe range (u 0 , u cr ) (Pabis 1999):u() τ⎡N⎛ b= ub Nu k ⎞⎢1⎤⎜ τ⎟− ⎥0 1− 1− ⎢1−⎝ 0 ⎠bb0 1−⎥⎣⎦(1)This model was proved with maximallocal error not bigger than 11% in therange <strong>of</strong> water content from 7.5 to about2 kg·kg –1 and for coefficient b = 0.056,determined in drying process <strong>of</strong> anotherpumpkin variety (Sojak 2000).The exponent N value in equation(1) can be determined eg.: by trial-anderror method or it can be calculated(Pabis and Jaros 2002) basing on results<strong>of</strong> measurements on changes in shapeparameters (Sojak and Jaros 1999).The second model to be verified forthe range (u 0 , u cr ) is:u() τ = ue + ( ucr −ue) exp(− Kτ)(2)Equation (2) was proved withmaximal local error not bigger than 15%in the range <strong>of</strong> water content from about2 to about 0.02–0.16 kg·kg –1 .In respect to maintaining <strong>of</strong> processcontinuity in point u = u cr , drying speedsin the first and second periods must beequal, thus, (du/dτ ) I = (du/dτ ) II (Sojak2000).Then, coefficient <strong>of</strong> drying speed canbe calculated (Jaros and Pabis, 2006)from equation:K =k0ucr− ue( )⎛ Nb−−−1⎜Nu k ⎞1 1 cr ⎟⎝ 0 0 τ (3)⎠VERIFICATION OF MODELSFOR THE FIRST AND SECONDDRYING PERIODSFigure 1 presents results <strong>of</strong> threerepetitions <strong>of</strong> measurements on changesin water content in pumpkin slices <strong>of</strong>thickness 5 and 10 mm at drying mediumtemperature 80°C and drying mediumspeed 1.2 m·s –1 . Changes in water contentwere described with the mean functionsin the form <strong>of</strong> cubic polynomials selectedso, that relative error was lower then 1%;their graphical interpretation is presentedin Figure 1.Coefficient N in model (1) wasdetermined by subsequent approximationsso, that model relative error <strong>of</strong> watercontent was possibly lowest according tomethod given by Jaros and Pabis (2006).The value <strong>of</strong> k 0 coefficient <strong>of</strong> initialdrying speed was determined by linearregression method, basing on watercontent initial measurements.
Investigations on drying <strong>of</strong> new pumpkin varieties 4787u [kg . kg -1 ]65432J, 5 mmJ, 10 mmZ, 5 mmZ, 10 mmB, 5 mmB, 10 mm100 100 200 300 400τ [min]FIGURE 1. Graphical representation <strong>of</strong> formulae approximating results <strong>of</strong> water content measurements(u) in time (τ) for pumpkin chips o varieties Justyna (J), Amazonka (Z) and Ambar (B) <strong>of</strong> slice thickness5 and 10 mm, dried at temperature 80°C and drying medium speed 1.2 m·s –1The course <strong>of</strong> drying speed wasdetermined basing on measurements onwater content. Figure 2a presents dryingspeed <strong>of</strong> pumpkin chips <strong>of</strong> Justynkavariety in slices <strong>of</strong> thickness 10 mmdepending on drying duration, while inFigure 2b the drying speed is dependenton instant water content calculated frommeasurements.Analysis <strong>of</strong> drying speed <strong>of</strong>investigated samples points out(especially on diagrams <strong>of</strong> b type)that at water content <strong>of</strong> 2 kg·kg –1 themechanism <strong>of</strong> mass exchange is changedand also the drying speed decreasesrapidly. Therefore, it was assumed thatthe critical content is equal to or is closeto 2 kg·kg –1 .a) b)k, K [min -1 ]0,070,060,050,040,030,020,010,000 100 200 300 400τ [min]k, K [min -1 ]0,070,060,050,040,030,020,010,000 1 2 3 4 5 6 7 8 9u [ kg . kg -1 ]FIGURE 2. Diagrams <strong>of</strong> drying speed in I and II drying periods (thin line, k and thick line, K, respectively)for pumpkin chips <strong>of</strong> Justynka variety <strong>of</strong> thickness 10 mm, dried at temperature 80°C and dryingmedium speed 1.2 m·s –1
48 M. Sojak, Sz. GłowackiFigure 3 presents diagrams <strong>of</strong> localrelative and absolute errors determiningaccuracy <strong>of</strong> calculations on water content<strong>of</strong> models (1) and (2) compared to valuescalculated from measurements.is not acceptable, which is pointed outby absolute and relative error valuescalculated in relation to measurementresults. Error values <strong>of</strong> both modelsincrease along with an increase inδ [%]60504030201000 100 200 300 4000-0,3 0,0 0,3τ [min]Δ [−]FIGURE 3. Diagrams <strong>of</strong> local relative (δ) and absolute (∆) errors for water content calculations <strong>of</strong> modelI (thin line) and II (thick line) <strong>of</strong> drying period for pumpkin chips <strong>of</strong> Justynka variety for slice thickness5 mm, temperature 80°C, drying medium speed 1.2 m·s –1 and coefficients: N = 1.6, b = 0.056u [kg . kg -1 ]8642The value <strong>of</strong> relative error was takenas 0.3 kg·kg –1 , assuming that this valuedetermines the range <strong>of</strong> water content,where models (1) and (2) can be regardedas verified; this value should not beexceeded.The time τ cr after which the driedsamples achieve water content 2 kg·kg –1was determined basing on formulaeapproximating results <strong>of</strong> measurements.It was found that changes in dryingspeed can be described with a linearequation <strong>of</strong> large value <strong>of</strong> correlationcoefficient. It results in the value <strong>of</strong> Ncoefficient in model (1) equal to 2. Thevalues <strong>of</strong> this coefficient, for which themodel <strong>of</strong> I drying period is regarded asverified are presented in Table 1.The models <strong>of</strong> changes in watercontent (1) and (2) are highly dependenton coefficient N. If its value is taken as 3,the accuracy <strong>of</strong> drying process modelingcoefficient N values (Fig. 4).The carried out logical analysis <strong>of</strong>models (I) and (II) with considerationto equation (3) showed the sufficientaccuracy <strong>of</strong> modeling the drying processfor values <strong>of</strong> drying shrinkage values bincluded in interval [0,0; 0,1];it is provedby relative and absolute error valuesfor both models, calculated in relationto measurement results. However, thisaccuracy calculated for b values includedin interval (0,1; 1,0] can not be accepted,basing on the relative and absolute errorvalues (Fig. 5).In Table 1 there are presented values<strong>of</strong> particular drying parameters and modelcoefficients <strong>of</strong> drying periods I and II,for which these models were consideredas verified. Additionally, the percentcontent <strong>of</strong> dried matter was included forparticular varieties <strong>of</strong> pumpkin fruits.
Investigations on drying <strong>of</strong> new pumpkin varieties 49TABLE 1. Values <strong>of</strong> parameters <strong>of</strong> pumpkin chips drying for which models (1) and (2) were verifiedVarietyParametersJustynka Amazonka AmbarThickness [mm]5 10 5 10 5 10u 0 [kg⋅kg –1 ] 7.63 7.63 7.32 7.32 5.01 5.01τ cr [min] 113 177 125 207 75 147u cr [kg⋅kg –1 ] 1.8 2.1 2.0 1.8 2.0 2.0N 1.60 2.40 1.40 2.80 2.60 1.10k [min –1 ] 0.063 0.043 0.049 0.038 0.052 0.021b 0.056 0.056 0.056 0.056 0.056 0.056u e [kg⋅kg –1 ] 0.020 0.040 0.110 0.040 0.060 0.160K [min –1 ] 0.0222 0.0107 0.0192 0.0098 0.0161 0.0110M s [%] 11.59 11.59 12.02 12.02 16.65 16.65δ [%]N=1,6N=3,0N=5,060504030201000 100 200 300 400τ [min]u [ kg . kg -1 ]N=1,6N=3,0N=5,086420-0,6 -0,3 0,0 0,3 0,6Δ [-]FIGURE 4. Diagrams <strong>of</strong> local relative (δ) and absolute (∆) errors for water content calculations <strong>of</strong>model I (thin line) and II (thick line) <strong>of</strong> drying period for pumpkin chips <strong>of</strong> Justynka variety for slicethickness 5 mm, temperature 80°C, drying medium speed 1.2 m·s –1 and coefficients: N = 1.6, 3.0, 5.0;b = 0.056b=0,056b=0,1b=0,3b=0,056b=0,1b=0,3δ [%]60504030201000 100 200 300 400τ [min]u [kg . kg -1 ]86420-0,6 -0,3 0,0 0,3 0,6Δ [-]FIGURE 5. Diagrams <strong>of</strong> local relative (δ) and absolute (∆) errors for water content calculations <strong>of</strong> modelI (thin line) and II (thick line) <strong>of</strong> drying period for pumpkin chips <strong>of</strong> Justynka variety for slice thickness5 mm, temperature 80°C, drying medium speed 1.2 m·s –1 and coefficients: N = 1.6, b = 0.056, 0.1, 0.3
50 M. Sojak, Sz. GłowackiSUMMARYKinetic models <strong>of</strong> convectional drying<strong>of</strong> solid bodies considering the dryingshrinkage were proved empirically withresults <strong>of</strong> measurements on drying <strong>of</strong>pumpkin chips <strong>of</strong> varieties Amazonka,Ambar and Justyna in the tunnel dryer. Asthe logical analysis points out and carriedout investigations prove, the models aresensitive to changes in coefficients N andb values. For investigated varieties therewere obtained significantly differentvalues <strong>of</strong> coefficient N, while the samemaximal shrinkage value b (determinedin previous investigations for Auravariety) was taken. The coefficient bvalues can differ in various varieties,characterized by different content <strong>of</strong>dry matter. Therefore, it is advisable tocarry out further investigations in orderto determine the above coefficients foreach variety and to re-verify the models(1) and (2), as well as to determine otherparameters describing the drying process(eg. coefficient <strong>of</strong> water diffusion).REFERENCESSOJAK M., JAROS M. 1999: The verification<strong>of</strong> the model <strong>of</strong> the first drying period <strong>of</strong>pumpkin. International Conference <strong>of</strong>PhD Students. <strong>University</strong> <strong>of</strong> Miszkolc,Section proceeding agriculture. Hungary.pp. 155–161. ISBN: 963-661-375-3SOJAK M. 2000: Matematyczny model konwekcyjnegosuszenia dyni spożywczej.Rozprawa doktorska. <strong>SGGW</strong> Warszawa.PABIS S. 1999: Koncepcja teorii konwekcyjnegosuszenia warzyw. KonwekcyjneSuszenie Warzyw – Teoria i Praktyka,pod red. Stanisława Pabisa. PTIR Kraków1999, s. 9–31. ISBN: 83-905219-2-XPABIS S.; JAROS M. 2002: The first period<strong>of</strong> convection drying <strong>of</strong> vegetables andthe effect <strong>of</strong> shape-dependent shrinkage.Biosystems Engineering. 81(2), pp. 201––211. www.idealibrary.com. ISSN: 1537––5110.JAROS M., PABIS S. 2006: Theoreticalmodels for fluid bed drying <strong>of</strong> cutvegetables. Biosystems Engineering.93(1), pp. 45–55. www.sciencedirect.com. ISSN: 1537–5110.Streszczenie: Badania suszenia nowych odmiandyni. W pracy przedstawiono wstępne wynikibadań oraz weryfikację modeli pierwszegookresu suszenia z uwzględnieniem skurczuobjętościowego oraz drugiego okresu suszenianowych odmian dyni. Do obliczeń wykorzystanowyniki pomiarów kinetyki suszenia, w konwekcjiwymuszonej, cząstek dyni (krojonych prostopadledo włókien) w kształcie płyty o grubości 5 oraz 10mm, w temperaturze czynnika suszącego 80°C,dla prędkości czynnika suszącego 1,2 m·s –1 , orazpomiarów zmian objętości cząstek dyni. Processuszenia przeprowadzony został w suszarcetunelowej.MS. received June 2008Authors’ address:Mariusz Sojak, Szymon GłowackiWydział Inżynierii Produkcji <strong>SGGW</strong>,Zakład Podstaw Nauk Technicznych,ul. Nowoursynowska 164, 02-787 Warszawa,Poland.e-mail: mariusz_sojak@sggw.pl
<strong>Annals</strong> <strong>of</strong> <strong>Warsaw</strong> <strong>University</strong> <strong>of</strong> <strong>Life</strong> <strong>Sciences</strong> – <strong>SGGW</strong>Agriculture No 52 (Agricultural and Forest Engineering) 2008: 51–57(Ann. <strong>Warsaw</strong> Univ. <strong>of</strong> <strong>Life</strong> Sci. – <strong>SGGW</strong>, Agricult. 52, 2008)Analysis <strong>of</strong> optimal values <strong>of</strong> air stream supplied in the clustersMARIA MAJKOWSKA 1 , ADAM KUPCZYK 21 Department <strong>of</strong> Applied Mathematics, <strong>Warsaw</strong> <strong>University</strong> <strong>of</strong> <strong>Life</strong> <strong>Sciences</strong> – <strong>SGGW</strong>, <strong>Warsaw</strong>, Poland2 Department <strong>of</strong> Production Management and Engineering, <strong>Warsaw</strong> <strong>University</strong> <strong>of</strong> <strong>Life</strong> <strong>Sciences</strong> –<strong>SGGW</strong>, <strong>Warsaw</strong>, PolandAbstract: Analysis <strong>of</strong> optimal values <strong>of</strong> air streamsupplied in the clusters. A mathematical model forvacuum drop in the form <strong>of</strong> Bernoulli equationwith the assumed constant velocity <strong>of</strong> ascent <strong>of</strong> afree bubble was used in determination <strong>of</strong> optimalair streams to get the minimal vacuum drops.Analysis <strong>of</strong> these values allowed for determination<strong>of</strong> supplied air stream corresponding to a givenmilking speed, depending on tube diameter andthe height <strong>of</strong> liquid rise.Key words: mechanical milking machine, airstream, pressure changes, optimization.INTRODUCTIONIt was found in hitherto investigations(Majkowska 2007b) that the minimalvacuum drops (min ∆p) in a long milk tubeare realized at properly adjusted values<strong>of</strong> supplied air stream Q p (min∆p). Thisresult confirms the previous Nordergenhypothesis (1980). The cluster operatingin a given cow-shed serves the cows <strong>of</strong>different milking capacity Q m . Even ifthe animals are grouped according tomilking capacity, it differs between thecows within a given group.The problem arises, how to selectthe supplied air stream to achieve theleast drops, and what is the connectionbetween the stream Q p (min∆p) allowingfor minimal drops and design parameters<strong>of</strong> milking machine.AIM OF WORKThe work aims at determination <strong>of</strong>supplied air stream to get the leastvacuum drops, and at analysis <strong>of</strong> theeffect <strong>of</strong> long milk tube diameter andthe height <strong>of</strong> liquid rise on optimal airstream value Q p (min∆p).MATERIAL AND METHODSThe model presented by Kupczyk(1999) for vacuum drops in the cluster,described with Bernoulli equation for thelost height, is <strong>of</strong> the form:Δpkol = ( 1− α pdpm)ρmgH+l 2dpm u+ ( 1− αMpdpm)λρm+D 2u+ ( 1−αpdpm)ξρm M22where:α pdpm – volumetric coefficient <strong>of</strong> air inlong milk tube,α mdpm – volumetric coefficient <strong>of</strong> milk inlong milk tube,l dpm – length <strong>of</strong> milk tube [m],D – diameter <strong>of</strong> long milk tube [m],ζ – coefficient <strong>of</strong> local losses,λ – coefficient <strong>of</strong> local loss dependent onrelative tube roughness and Re number,
52 M. Majkowska, A. KupczykH – height <strong>of</strong> rise [m],ρ m , ρ p – density <strong>of</strong> milk and air [kg . m –3 ],g – acceleration <strong>of</strong> gravity [m . s –2 ],u M – reduced velocity <strong>of</strong> mixture [m . s –1 ].This equation was simplified bysubstitution <strong>of</strong> free rise velocity with aconstant one (Majkowska, 2007a). Thevacuum drop ∆p kol occurs in factors:Q Qu u u m p pM = m + p = + NAdpmAdpmpu pα pdpm =12 , uM+ v ∞pwith p= p kolr + Δ 2[kPa]where:Q m , Q p – stream <strong>of</strong> milk [kg . min –1 ] andair [m 3. h –1 ],u p , u m – reduced velocities <strong>of</strong> air andmilk [m . s –1 ],p N =100 [kPa].The Bernoulli equation was reduced toa fourth degree polynomial in relationto ∆p kol . The following task wasformulated:(let ∆p kol = x, J – optimization task)J = min x, where x is connected byQ pidentity:43wx4( Qp) x + wx3( Qp)x +2+ wx2( Qp) x + wx1( Qp)x++ ww( Qp)= 0The solution for this task is minimalvacuum drop and the corresponding airstream (Majkowska 2007b).EFFECT OF LIQUID RISEHEIGHT ON MINIMAL DROPVALUES AND CORRESPONDINGSUPPLIED AIR STREAMThe height <strong>of</strong> liquid rise is one <strong>of</strong>important factors influencing the vacuumdrops, also the minimal drops as well asthe supplied air stream value Q p (min∆p).Dependence <strong>of</strong> the air stream minimizingthe vacuum drop on milking rate Q pmin∆p(min∆p(Qm)). For a given height <strong>of</strong>liquid rise H, independently <strong>of</strong> the milktube diameter D, this dependence isnonlinear and convex, with extremumin the neighbourhood <strong>of</strong> a pointcharacteristic for height H (Fig. 1). Inthe can milking machine H = 0.4 m, themaximal air stream minimizing the dropsQ* pmin ∆p for each diameter correspondsto vacuum drop about 2 kPa. In milkingmachine with highly arranged milking tube,the maximal values Q* pmin ∆p correspondto vacuum drop about 10 kPa (Fig. 1).This result confirms observations <strong>of</strong>Kupczyk (1999).Considering hypothetical heights <strong>of</strong>liquid rise H in the range from 0.4 mto 1.9 m one can find that the vacuumdrops corresponding to Q* pmin ∆p (H i )values are set almost along a straight line<strong>of</strong> constant inclination angle coefficientindependent <strong>of</strong> diameter D (Fig. 2).Change in diameter does not influencethe linearity <strong>of</strong> rise <strong>of</strong> minimal drops,corresponding to maximal air streamsfor a given diameter, with an increase inheight.
Analysis <strong>of</strong> optimal values <strong>of</strong> air stream supplied in the clusters 5310.9D=0.02Q p min delta P [m 3 h –1 ]0.80.70.60.50.4D=0.020.30.2D=0.0130.1D=0.01300 5 10 15 20 25 30minimum delta P [kPa]FIGURE 1. Supplied air stream minimizing vacuum drops as a function <strong>of</strong> minimal drops for variousmilking rates (ranging from 0.5 to 12 kg min –1 ); Q pmin ∆p (min∆p(Q m )), while H = 0.4 m, H = 1.9 m110001000090008000minimum delta P [kPa]70006000500040003000200010000.4 0.6 0.8 1 1.2 1.4 1.6 1.8 2FIGURE 2. Minimal vacuum drops for Q* pmin ∆p (H i ) presented for diameter D ranging from 0.013 mto 0.016 mH [m]
54 M. Majkowska, A. KupczykEFFECT OF DIAMETER ONMINIMAL DROPS VALUESAND CORRESPONDING VALUESOF SUPPLIED AIR STREAMThe range <strong>of</strong> changes in minimal drops atdefined height H depending on diameterD dpm was analyzed. The bigger diameter,the lower scatter <strong>of</strong> minimal vacuumdrops. Therefore, at bigger diameter,independent <strong>of</strong> milking rate, one cana0.2determine the expected minimal vacuumdrop more precisely. Similarly, with anincrease in diameter the range <strong>of</strong> suppliedair, realizing the minimal drops (scatter∆Q p = Q* pmin ∆p – Q pmin ∆p ), decreases(Fig. 3).The range <strong>of</strong> supplied air streamminimizing the drops can be determinedfor each diameter and height <strong>of</strong> liquidrise at investigated milking rates (from0.5 to 12 kg min –1 ). Assuming a constantQ*p min P – Qp min P [m 3 h –1 ]0.180.160.140.120.10.080.06D=0.02D=0.0120.040.02b0.3505 10 15 20 25 30minimum delta P [kPa]Q*p min P – Qp min P [m 3 h –1 ]0.30.250.20.150.1D=0.0120.05D=0.0201 2 3 4 5 6 7 8minimum delta P [kPa]FIGURE 3. Difference between maximal supplied air stream among the drop minimizing streams andthe air stream minimizing vacuum drop for subsequent milking rates and diameters from 0.012 to 0.02m: (Q* pmin ∆p (min∆p(Q m )) – Q pmin ∆p (min∆p(Q m )) [m 3·h –1 ], for H = 1.9 m (Fig. 3a) and H = 0.4 m(Fig. 3b)
Analysis <strong>of</strong> optimal values <strong>of</strong> air stream supplied in the clusters 553530Qp=0.09Qp=0.19Qp=0.26D=0.01225deltaP20151050 2 4 6 8 10 12Qm1816Qp=0.43Qp=0.47Qp=0.53D=0.01614deltaP1210860 2 4 6 8 10 12QmFIGURE 4. Vacuum drops obtained by three selected values <strong>of</strong> supplied air stream as a function <strong>of</strong>milking rateair stream for each milking rate at thelevels <strong>of</strong> three selected values <strong>of</strong> therange <strong>of</strong> streams optimizing drops, onecan find that the vacuum drops differinconsiderably. The calculated vacuumdrops for the selected diameters at H == 1.9 m are presented in Figure 4a, b.A significant effect <strong>of</strong> the height<strong>of</strong> liquid rise on maximal air streamminimizing the vacuum drops can befound. This dependence is ascending,nonlinear and convex for each diameter<strong>of</strong> long milk tube (Fig. 5).CONCLUSIONS• The vacuum drop corresponding to agiven maximal air stream, suppliedfrom the air streams minimizingdrops, is constant for defined height
56 M. Majkowska, A. Kupczyk0.55D=0.0160.50.45D=0.015Qp minP0.40.350.3D=0.014D=0.0130.250.20.4 0.6 0.8 1 1.2 1.4 1.6 1.8 2HFIGURE 5. Air stream minimizing vacuum drops Q* pmin ∆p (H i ) for various diameters <strong>of</strong> long milktube<strong>of</strong> liquid rise and independent <strong>of</strong>diameter <strong>of</strong> long milk tube.• It changes linearly as a function <strong>of</strong> theheight <strong>of</strong> liquid rise for each diameter,with constant angle coefficient.• One can point out the range <strong>of</strong>supplied air stream to obtain theminimal air streams, if milkingmachine parameters H, D aredetermined. Within this range <strong>of</strong>supplied air stream the vacuum dropsdiffer inconsiderably.• An increase in diameter <strong>of</strong> long milktube causes a decrease in scatter <strong>of</strong>minimal vacuum drops and a decreasein the range <strong>of</strong> supplied air streamrealizing the minimal drops.• An increase in the height <strong>of</strong> liquid risecauses an increase in minimal vacuumdrops (almost linear) and an increasein supplied sir stream realizing theminimal drops, while an increase inmaximal stream values is nonlinear.REFERENCESKUPCZYK A. 1999: Doskonalenie warunkówdoju mechanicznego ze szczególnymuwzględnieniem podciśnieniaw aparacie udojowym. Rozprawa habilitacyjna,<strong>SGGW</strong> Warszawa.MAJKOWSKA M. 2007a: Spadki podciśnieniaw długim przewodzie mlecznymaparatu udojowego obliczane na podstawieuproszczonego równania Bernoulliego.Problemy Inżynierii Rolniczej 2(56).MAJKOWSKA M. 2007b: Minimalizacjaspadków podciśnienia w kolektorzeaparatu udojowego w oparciu o modelmatematyczny, Vol. 6/1 ARAE, OficynaWydawnicza DaborNORDERGEN S.A. 1980: Cyclic VacuumFluctuations In Milking Machines.Dissertation. Hohenheim.Streszczenie: Analiza optymalnych wartościstrumienia powietrza dopuszczanego w aparatachudojowych. Minimalne spadki podciśnieniaw długim przewodzie mlecznym wyznaczone napodstawie równania Bernoulliego na wysokośćstraconą, w którym przyjęto prędkość wznoszenia
Analysis <strong>of</strong> optimal values <strong>of</strong> air stream supplied in the clusters 57pęcherza jako stałą, określają wielkość strumieniapowietrza dopuszczanego. Dla różnych prędkościdoju przeanalizowane zostały wielkości strumieniapowietrza w funkcji wysokości podnoszeniacieczy, średnicy długiego przewodu mlecznego.Spadki podciśnienia różnią się nieznacznie, gdystrumień powietrza jest z zakresu wartości minimalizującychspadki.MS. received June 2008Authors’ addresses:Maria MajkowskaKatedra Zastosowań Matematyki <strong>SGGW</strong>ul. Nowoursynowska 16602-787 WarszawaAdam KupczykKatedra Organizacji i Inżynierii Produkcji <strong>SGGW</strong>w Warszawieul. Nowoursynowska 16602-787 Warszawa
<strong>Annals</strong> <strong>of</strong> <strong>Warsaw</strong> <strong>University</strong> <strong>of</strong> <strong>Life</strong> <strong>Sciences</strong> – <strong>SGGW</strong>Agriculture No 52 (Agricultural and Forest Engineering) 2008: 59–65(Ann. <strong>Warsaw</strong> Univ. <strong>of</strong> <strong>Life</strong> Sci. – <strong>SGGW</strong>, Agricult. 52, 2008)Optimization <strong>of</strong> selection <strong>of</strong> reconditioned parts in repair <strong>of</strong> injectionpumpMAREK KLIMKIEWICZDepartment <strong>of</strong> Production Management and Engineering, <strong>Warsaw</strong> <strong>University</strong> <strong>of</strong> <strong>Life</strong> <strong>Sciences</strong> – <strong>SGGW</strong>,<strong>Warsaw</strong>, PolandAbstract: Optimization <strong>of</strong> selection <strong>of</strong>reconditioned parts in repair <strong>of</strong> injection pump.The paper presents possibility <strong>of</strong> application <strong>of</strong>dynamic programming in optimization <strong>of</strong> selection<strong>of</strong> the new and reconditioned machine parts. Theminimization <strong>of</strong> spare part costs was carried outat assumed reliability <strong>of</strong> equipment. The methodwas presented on the example <strong>of</strong> injection pumprepair.Key words: reconditioning, optimization, injectionpumps.INTRODUCTIONIt is proved by many practical examplesand also by numerous research works,that application <strong>of</strong> reconditioned parts inequipment subjected to repair is pr<strong>of</strong>itable.However, an appropriate quality <strong>of</strong> repairmust be ensured. The reconditioned partsare used with respect to their lower priceand protection <strong>of</strong> environment in the pointrecycling by reconditioning (Bocheńskiand Klimkiewicz 2001a). Processes<strong>of</strong> spare part reconditioning occur instrict connection with the processes <strong>of</strong>repair and disposal <strong>of</strong> capital assets, aspresented in Figure 1 (Bućko and Guść1988). Confirmation <strong>of</strong> advisability <strong>of</strong>reconditioning development can be als<strong>of</strong>ound in highly developed countries. Itcan be assumed that reconditioning ispr<strong>of</strong>itable and technically justified as faras the following is concerned:– parts <strong>of</strong> older vehicles and out <strong>of</strong>production,– large and expensive elements, e.g.:bodies, heads, fuel systems,– parts <strong>of</strong> special vehicles (shortproduction series),New spare partsRepairReconditioningScrap materialReconditioningspare partsRunning down <strong>of</strong>capital assetsFIGURE 1. Place <strong>of</strong> reconditioning in circulation <strong>of</strong> spare parts (Bućko and Guść 1988)
60 M. Klimkiewicz– units and parts <strong>of</strong> low reconditioning developed for each problem. In optimalcosts – starters, generators, valves selection <strong>of</strong> new and reconditioned partsetc.Reconditioning requires lower energyand material inputs than productionfor the equipment being repaired one canadapt an algorithm applied in allocation<strong>of</strong> new parts reliability, presented byand they can be estimated as several Kapur and Lamberson (1980).percent in relation to a new product. Thereconditioning costs are influenced bytechnology, size <strong>of</strong> production, continuity<strong>of</strong> supply, and other factors. It is assumedthat total costs <strong>of</strong> reconditioning shouldnot exceed about 60% <strong>of</strong> the costs <strong>of</strong> aAlgorithm <strong>of</strong> optimizationIt was assumed that the needed value <strong>of</strong>reliability index (probability <strong>of</strong> properoperation) <strong>of</strong> the equipment is ỹ, andthat:new part fabrication. The equipment 0 < ỹ < 1being repaired, as a system, mustThe least values <strong>of</strong> reliability indicesfulfill the reliability requirements,for particular elements were designatedwhich depend on system structure andas xreliability <strong>of</strong> basic components. The i , and:reliability indices can be obtained in 0 < x i < 1exploitation or laboratory investigations. Further designations:With respect to short series <strong>of</strong> the parts y i – variable level <strong>of</strong> reliability indexbeing reconditioned and heterogeneity value for i-element, and:<strong>of</strong> population, the reliability indices x i ≤ y i < 1can <strong>of</strong>ten be evaluated on the basis <strong>of</strong> G i (x i ,y i ) – costs connected to applicationreconditioning technology used. Many <strong>of</strong> parts <strong>of</strong> reliability index value x i or y i ,reconditioning methods enable to give y i * – optimal level <strong>of</strong> reliability indexthe parts such properties, that their value for i-element at minimal costs.durability can be higher than that <strong>of</strong> the The optimization aims at determinationoriginal parts.<strong>of</strong> value z as a minimal cost function:OPTIMIZATION OF PARTSELECTION BY DYNAMICPROGRAMING METHODKnowing the reliability indices valuesone can select parts <strong>of</strong> various qualityto equipment being repaired with theuse <strong>of</strong> optimization methods, e.g. thedynamic programming method, using theBellman’s principle (1957). In dynamicprogramming method a general purposealgorithm for solution is not used. Adetailed proceeding method should benz = min ∑ Gi( xi, yi)i=1with limitations:n∏ yi≥ ỹ and 0 < x i ≤ y i ≤ 1, i = 1, ..., n.i=1The algorithm <strong>of</strong> dynamic programmingcan be presented in the form <strong>of</strong>graphical model (Fig. 2).Each i-element represents simultaneouslythe stage k <strong>of</strong> task solving, therefore,it was assumed that i = k. S k is a set
Optimization <strong>of</strong> selection <strong>of</strong> reconditioned parts in repair <strong>of</strong> injection pump 61x k y k 1Final stageD kInitial stageS n = 1k=1, ...nkS 0 = S k y k = S k-1 S k-1G k (x k , y k )FIGURE 2. Graphical model for solution <strong>of</strong> dynamic programming task (source: own elaboration basedon Kapur and Lamberson 1980)<strong>of</strong> possible reliability indices s k at stagek, and:1 = s n ≥ s n–1 ≥ , ..., s k ≥, ..., s 1 ≥ s 0 = ỹThe s k value determines reliabilityindex to be taken for a given element atk-stage <strong>of</strong> solution to ensure the requiredlevel <strong>of</strong> system reliability.A set D k <strong>of</strong> such possible decisions d kat stage k is determined to achieve:x k ≤ y k < 1 k = 1, ..., nTransformation function T k representsthe following conversion <strong>of</strong> final state atstage k into initial state:T k (s k ,d k ) = s k y k = s k–1k = 1, ..., n (2)while the pr<strong>of</strong>it function R k (functiondetermining the effect depending on initialstate at stage k and decision undertakenat this stage) will be expressed with thefollowing dependence:R k (s k ,d k ) = [G k (s k ,y k ) + f k–1 (s k–1 )],k =1, ..., n (3)where f k (s k ) – transition functiondetermining optimal effect obtainedfrom the initial stage to k-stage.The basic functional dependence inthis case has the form <strong>of</strong> the followingrecurring function:fk( sk) = min[ Gk( sk, yk) + fk−1( sk−1 )] ,ykk =1 , ..., n(4)while:ỹyk≥Sk⋅ yk−1where:f 0 (s 0 ) = 0, s n = 1 s k–1 = s k · y k(5)Verification calculationsThe injection pump <strong>of</strong> distributor DPAtype is a precise device consisted <strong>of</strong> over100 elements. This pump, as majority <strong>of</strong>mechanical systems, is characterized byin-line reliability structure, which can beschematically presented by the in-lineconnected blocks:1 2 nThe function <strong>of</strong> reliability structure<strong>of</strong> such system can be expressed asfollows:nSx ( 1, ..., xn)= ∏ xi(6)i=1
62 M. Klimkiewiczwhere: S(x l,…, x n ) – function <strong>of</strong> reliabilitystructure <strong>of</strong> system,x i – realization <strong>of</strong> vector coordinate <strong>of</strong>reliability state <strong>of</strong> logic value 0 or 1.Probability <strong>of</strong> proper operation <strong>of</strong> thesystem R s (t) under defined exploitationconditions can be calculated by expandingdetermination <strong>of</strong> the vector coordinates<strong>of</strong> reliability state <strong>of</strong> logic values 0 or 1into values <strong>of</strong> the range , with thefollowing dependence:nR(t)= s ∏ Ri () t(7)i=1where: R i (t) – probability <strong>of</strong> properoperation <strong>of</strong> element during time t underthese conditions.Intensity <strong>of</strong> pump damage is equalto the sum <strong>of</strong> intensity <strong>of</strong> damage <strong>of</strong>particular elements. Serious failures <strong>of</strong>the pump leading to substantial financialinputs result usually from damage<strong>of</strong> hydraulic head, body or cam ring;therefore, with consideration to purpose<strong>of</strong> calculations one can assume that theindex <strong>of</strong> dependence (7) will undertakethe form:Rs ()= t R1()⋅ t R2()⋅ t R3 () t (8)where: R 1 (t), R 2 (t), R 3 (t) – probability<strong>of</strong> proper operation <strong>of</strong> hydraulic head,cam ring and body <strong>of</strong> the pump in time t,respectively.Probability <strong>of</strong> proper operation <strong>of</strong>the pump elements will be evaluated forthe half-year period, which means theguarantee period given by majority <strong>of</strong>workshops repairing the fuel systems.Evaluation <strong>of</strong> indices for properoperation <strong>of</strong> elements was based onexploitation investigations carried outin service workshops for fuel equipment(Bocheński and Klimkiewicz 2001b c).To simplify designations and toensure their conformity with dynamicprogramming algorithm, these indiceswill be called below as reliability anddesignated with symbol y i . Reliabilityin selection <strong>of</strong> parts was evaluated withconsideration to damage occurred duringassembling and adjustments in serviceworkshops as well as during exploitation.The current market prices <strong>of</strong> spare partswere taken as the costs <strong>of</strong> elements. Thereliability indices and prices <strong>of</strong> parts arepresented in Table 1.The maximal values <strong>of</strong> reliability forthe three mentioned elements <strong>of</strong> pump(new parts) were evaluated as follows:hydraulic head R(t) = 0.99, cam ring R(t)= 0.999, body R(t) = 0.999. Therefore,TABLE 1. Values <strong>of</strong> reliability ndices and costs <strong>of</strong> New and reconditioned partsHydraulic head Cam ring Bodyy 1yG(reliability1 (S k ,y 1 )2yG(reliability 2 (S k ,y 2 )3G(reliability 3 (S k ,y 3 )cost [PLN]cost [PLN]cost [PLN]– R 1 (t))– R 2 (t))– R 3 (t))0.975 100 0.980 20 0.991 300.980 130 0.999 100* 0.999 100*0.988 1500.990 350** – New elements.
Optimization <strong>of</strong> selection <strong>of</strong> reconditioned parts in repair <strong>of</strong> injection pump 63the hydraulic head is a weak elementand it determines the reliability <strong>of</strong> entireequipment. As it is evident from theproduct low <strong>of</strong> reliability (equation 7),reliability <strong>of</strong> the entire system can notbe higher than reliability <strong>of</strong> the mostdeceptive element, therefore, it can notexceed the value R(t) = 0.99. It wasassumed in the model that reliability <strong>of</strong>the complete injection pump must behigher than R(t) = 0.96.Tables 2–4 present the values <strong>of</strong> allpossible reliability indices for variouselements, which ensure reliability <strong>of</strong> thesystem.This value is obtained for reliabilityy 3 * = R 3 (t) = 0.991; therefore, thereconditioned body <strong>of</strong> cost 30 PLN isselected (y i * – optimal level <strong>of</strong> reliabilityindex for i-element at minimal costs).Then, from Table 6 there is selected theelement <strong>of</strong> reliability y 2 * = R 2 (t) = 0.999for function f 2 (s 2 ) = 230. This is the camring <strong>of</strong> cost equal to 100 PLN. Finally,from Table 5 for the function f 1 (s 1 ) = 130there is selected the element <strong>of</strong> reliabilityy 1 * = R 1 (t) = 0.98. This is the hydraulichead <strong>of</strong> cost 130 PLN. The total cost <strong>of</strong>the parts will amount to 260 PLN.TABLE 2. Transformation at stage 3: there is determined system reliability, which can be taken at stage2: s 3 = 1, s 2 = s 3 · y 3y 3s 30.991 0.9991.000 0.991 0.999TABLE 3. Transformation at stage 2: s 1 = s 2 · y 2y 2s 20.980 0.9990.991 0.9712 0.9900.999 0.9790 0.998TABLE 4. Transformation at stage 1: s 0 = s 1 · y 1y 1s 10.975 0.980 0.988 0.9900.9712 – – – 0.96150.9790 – – 0.9673 0.96920.9900 – 0.9702 0.9781 0.98010.9980 0.9731 0.9780 0.9860 0.9880In Tables 5–7 the conversion functionswere determined. It is evident from Table7 that conversion function:f3( s3) = min[ G3( s3, y3) + f2( s2)]y3is equal to 260.Assuming various values <strong>of</strong> reliabilityfor the complete injection pump andperforming the simulation with the use<strong>of</strong> Excel program, there were obtainedthe total costs <strong>of</strong> elements ensuring therequired probability <strong>of</strong> proper operation<strong>of</strong> the pump (Tab. 8).
64 M. KlimkiewiczTABLE 5. Matrix <strong>of</strong> costs at stage 1: G 1 (s 1 ,y 1 ) and vector f 1 (s 1 )y 1s 10.9750 0.980 0.988 0.990 f 1 (s 1 )0.9712 – – 350 3500.9790 – – 150 350 1500.9900 – 130 150 350 1300.9980 100 130 150 350 100TABLE 6. Matrix <strong>of</strong> costs at stage 2: G 2 (s 2 ,y 2 ) and vector f 2 (s 2 ) = G 2 (s 2 ,y 2 ) + f 1 (s 1 )y 2s 20.9800 0.9990 f 2 (s 2 )0.9910 20+350 100 + 130 2300.9990 20+150 100 +100 170TABLE 7. Matrix <strong>of</strong> costs at stage 3: G 3 (s 3, y 3 ) and vector f 3 (s 3 ) = G 3 (s 3, y 3 ) + f 2 (s 2 )y 3s 30.991 0.999 f 3 (s 3 )1 30 +230 100 + 170 260TABLE 8. Results <strong>of</strong> simulation on total costs <strong>of</strong> assembled elements for different values <strong>of</strong> requiredsystem reliabilityRequired system reliability 0.988 0.985 0.98 0.975 0.97 0.96 0.95 < 0.95Calculated reliability 0.988 0.986 0.986 0.978 0.970 0.970 0.951 0.9469Total cost <strong>of</strong> elements 550 350 350 280 260 260 180 150SUMMARYApplication <strong>of</strong> dynamic programmingmethod allowed for objective selection<strong>of</strong> the new and reconditioned parts toensure proper reliability <strong>of</strong> the injectionpump. The model based on this methodcan be successfully used in selection <strong>of</strong>spare parts for other equipment. An advantage<strong>of</strong> dynamic programming is reduction<strong>of</strong> labour inputs <strong>of</strong> the solutions,when compared to other methods. Thedynamic programming releases fromcombinatorial investigating <strong>of</strong> all solutions,which must be applied in otheroptimization methods, since every stageis considered separately and an optimalsolution is selected at every stage.Simulation <strong>of</strong> total costs <strong>of</strong> assembledparts for different values <strong>of</strong> requiredreliability enables to select the desirablevariant <strong>of</strong> spare parts’ set depending oncustomer expectations.REFERENCESBELLMAN R. 1957: Dynamic Programming.Princeton <strong>University</strong> Press. 400.BOCHEŃSKI C., KLIMKIEWICZ M.2001a: Regeneracja części maszyn jakojeden ze sposobów recyklingu MateriałyKonferencyjne – I Międz. Konf. Nauk-
Optimization <strong>of</strong> selection <strong>of</strong> reconditioned parts in repair <strong>of</strong> injection pump 65-Tech. „Problemy Recyklingu. Rogów.p. 55–63.BOCHEŃSKI C., (Kier. projektu bad.)KLIMKIEWICZ M. 2001b: Badaniawpływu właściwości fizykochemicznychpaliwa do silników wysokoprężnych nacharakterystykę wtrysku i trwałości elementówukładu paliwowego konwencjonalnegoi Common Rail. Projekt bad.KBN nr 9T12D00716. Maszynopis cz. II,WIP, Warszawa. p. 128.BOCHEŃSKI C., KLIMKIEWICZ M.2001c: Problemy smarowania i zużyciapomp wtryskowych w aspekcie stosowanychpaliw. Motoryzacja i EnergetykaRolnictwa. II Międz. Konf. Nauk. Tech.„MOTROL 2001”. Tom 4. p. 13–19.BUĆKO J., GUŚĆ A. 1988: Rachunek ekonomicznejefektywności regeneracjiczęści wymiennych. Krajowa Konf. n.t.:Regeneracja Części Maszyn. Łódź 1988.s. 1–14.KAPUR K., LAMBERSON L. 1980:Nadeżnost i projektirowanie sistem. Mir,Moskwa. ss. 604Streszczenie: Optymalizacja doboru regenerowanychczęści do naprawy pompy wtryskowej.Modelowanie doboru regenerowanych części donaprawianej pompy wtryskowej przeprowadzono,stosując programowanie dynamiczne. Za pomocątej metody można w obiektywny sposób dobraćczęści nowe i regenerowane, aby zapewnićodpowiednią niezawodność pompy wtryskowej.Metodę zaprezentowano na przykładzie naprawypompy wtryskowej.MS. received June 2008Author’s address:Katedra Organizacji i Inżynierii Produkcji<strong>SGGW</strong>02-787 Warszawa, ul. Nowoursynowska 166
<strong>Annals</strong> <strong>of</strong> <strong>Warsaw</strong> <strong>University</strong> <strong>of</strong> <strong>Life</strong> <strong>Sciences</strong> – <strong>SGGW</strong>Agriculture No 52 (Agricultural and Forest Engineering) 2008: 67–71(Ann. <strong>Warsaw</strong> Univ. <strong>of</strong> <strong>Life</strong> Sci. – <strong>SGGW</strong>, Agricult. 52, 2008)Properties and structure <strong>of</strong> spheroidal chilled cast iron weldedby frictionRADOSŁAW WINICZENKODepartment <strong>of</strong> Fundamental Engineering, <strong>Warsaw</strong> <strong>University</strong> <strong>of</strong> <strong>Life</strong> <strong>Sciences</strong> – <strong>SGGW</strong>, <strong>Warsaw</strong>,PolandAbstract: Properties and structure <strong>of</strong> spheroidalchilled cast iron welded by friction. Investigationswere carried out on friction welding <strong>of</strong> spheroidalcast iron “modified” from the front. Theinvestigations aimed at “decreasing” <strong>of</strong> free statecarbon content in welding zone. The sampleswere welded by friction and subjected to strengthtest, hardness test and structural test with theuse <strong>of</strong> scanning electron microscope (SEM). Anincrease in friction time improved the strength <strong>of</strong>connections, however, the temperature achievedin a central part <strong>of</strong> connection was insufficient tobreak up the cementite into equivalent phases.Key words: spheroidal cast iron, friction welding,strength <strong>of</strong> connection.INTRODUCTIONFriction welding is a method <strong>of</strong> welding,which has been recently used to connectgrey cast iron with both the flakegraphite and the spheroidal graphite(Dette and Hirsch 1990; Shinoda, Endoand Kato 1999). The hitherto trialsaimed from one side at simplification <strong>of</strong>construction <strong>of</strong> casts and the resultingdecrease in quantity <strong>of</strong> scrap, from theother side at obtaining a high mechanicalstrength during exploitation <strong>of</strong> a givenelement. The classical examples <strong>of</strong> suchapplications are joints <strong>of</strong> articulatedtelescopic shafts transferring power fromtractor to agricultural machines, suctionand exhaust valves <strong>of</strong> internal combustionengines, hydraulic cylinders, pistonrods, parts <strong>of</strong> gears, driving shafts andturbine shafts (Brochure ManufacturingTechnology, INC (MTI), 1999).Many authors have used the spacersmade <strong>of</strong> low-carbon steel in order toconnect the spheroidal cast iron with theuse <strong>of</strong> friction heat (Kaczorowski andWiniczenko 1999; Winiczenko 2003).Regardless <strong>of</strong> type <strong>of</strong> material, thesetechnologies complicate the weldingprocess, increase its time and maketechnology more expensive. Therefore,author <strong>of</strong> this work proposes anothermethod, so called “chilling” <strong>of</strong> cast iron,in order to “decrease” free state carboncontent in welding zone.MATERIAL AND METHODSThere was investigated the spheroidalcast iron <strong>of</strong> 400 – 15 type <strong>of</strong> the followingchemical composition: C – 3.78%, Si– 2.60%, Mn – 0.15%, P – 0.05 %, S– 0.01%, Cr – 0.03%, Ni – 0.02%, Si– 2.60%, Cu – 0.05%, Mg – 0.036%.The iron castings were fabricated inFounding Department <strong>of</strong> MechanicalPlant PZL-Wola by the followingmethod: the inductive crucible furnace<strong>of</strong> capacity 3 t, special low-manganesecrude iron 30% + process scrap 15% andthe rest – steel scrap, spheroidizing attemperature 1530°C, spheroidizer type
68 R. Winiczenko611A <strong>of</strong> granulation 1÷10, modificationat temperature 1450°C with the use <strong>of</strong>modifier ZL80ZN(0.4/2) <strong>of</strong> PECHINEYmake, put to the bottom <strong>of</strong> ladle with theuse <strong>of</strong> a sinking device. Then, the samples<strong>of</strong> properly shaped fronts was welded ina friction welder ZT-14 at <strong>University</strong><strong>of</strong> Technology and <strong>Life</strong> <strong>Sciences</strong> inBydgoszcz.RESULTS AND THEIR ANALYSISTo simplify the friction welding processthere was attempted a direct welding,in which surfaces <strong>of</strong> samples beingconnected were chilled in order toremove the free state carbon, namely inthe form <strong>of</strong> graphite. This operation isrelatively simple technologically, sinceit consists in placing the chill leadingto a local solidification <strong>of</strong> cast iron in ametastable system.As a result, a series <strong>of</strong> spheroidalcast iron samples were obtained,chilled at distance from 3 to 4 mm. Itwas expected that lack <strong>of</strong> releasing <strong>of</strong>free state carbon will remove a basicobstacle, namely the graphite layer beingdeposited on the connection surface. Itwas also considered that depending ontemperature and time <strong>of</strong> its maintainingon the interface, the cementite couldbreak up into austenite and carbon “instatu nascendi”, which could be releasedin the form <strong>of</strong> ultra-dispersive emissions<strong>of</strong> incandescence carbon during longperiods <strong>of</strong> temperature maintained aftercompletion <strong>of</strong> welding.Strength test resultsThe initial trials did not yield the expectedresults, since welding time was too short.Warming up <strong>of</strong> very hard chilled layer toappropriate temperature turned out to beimpossible with application <strong>of</strong> parametersgiving good results during welding withthe use <strong>of</strong> a spacer. With respect to limitedparameters <strong>of</strong> the welder, an increase induration <strong>of</strong> friction process was the onlyway for obtaining proper temperature inthe plane <strong>of</strong> connection. This improved250Tensile strength Rm [ MPa]2001501005000 20 40 60 80 100 120 140Time <strong>of</strong> friction welding t [s]FIGURE 1. Results <strong>of</strong> tensile strength <strong>of</strong> cast iron chilled samples (I stage <strong>of</strong> welding)
Properties and structure <strong>of</strong> spheroidal chilled cast iron welded by friction 69the strength <strong>of</strong> connections, presentedin Figure 2, although the strength <strong>of</strong>connection was not fully satisfactory.higher than that measured at distance <strong>of</strong>2.5 mm from the surface <strong>of</strong> cylindricalsample. This suggests that temperature250Tensile strength Rm [ MPa]2001501005000 20 40 60 80 100 120 140Time <strong>of</strong> friction welding t [s]FIGURE 2. Results <strong>of</strong> tensile strength <strong>of</strong> cast iron chilled samples (II stage <strong>of</strong> welding)Micro hardness testConsidering the course <strong>of</strong> chilled samplewelding one should referred to the results<strong>of</strong> hardness tests (Fig. 3). It is evidentthat hardness in the zone <strong>of</strong> interface,measured in asis <strong>of</strong> sample is considerablyachieved in central axis <strong>of</strong> connectionwas insufficient to cause breaking up<strong>of</strong> cementite ledeburite into equivalentphases (Fig. 4b). This process occurredin zones situated at bigger distance fromthe sample axis, but was not completelyMicro hardness HV15004504003503002502001501005000 1 2 3 4 5 6 7 8 9Distance from interface [mm]FIGURE 3. Results <strong>of</strong> micro hardness <strong>of</strong> spheroidal cast iron (chilled) welded by friction2,5 mm from edge<strong>of</strong> specimenon axis <strong>of</strong> specimen
70 R. WiniczenkoabFe 3 CFIGURE 4. Secondary cracks in envelope structure zone <strong>of</strong> chilled cast iron: a – magnification × 2000,b – microstructure <strong>of</strong> chilled cast iron welded by friction, with visible Fe 3 C <strong>of</strong> various morphology,magnification × 250sufficient (Fig. 3), since the hard centralpart <strong>of</strong> sample made impossible suchswelling <strong>of</strong> the sample, that a permanentconnection between external fragmentsthe sample could be created. It should benoted that the welding time can not betoo long, since it could result in excessiveprocess <strong>of</strong> breaking up <strong>of</strong> cementite intoaustenite and carbon “in statu nascendi”already during friction. If it occurred,the created carbon would be depositedon surface <strong>of</strong> interface and annihilatethe previous action, aimed at its removalduring welding.It should be noted that in that casethe hardness <strong>of</strong> cast iron in the axis <strong>of</strong>sample and close to plane <strong>of</strong> connectionis distinctly higher than hardness atdistance 2.5 mm. It could be caused bythe fact that in the axis <strong>of</strong> sample thetemperature was too low for breakingup the cementite Fe 3 C in the chilledlayer into more stabile phases. However,higher peripheral speed in zones situatedat distance 2.5 mm from the surface <strong>of</strong>sample enabled to release the frictionheat, sufficient to create in relativelyshort time in the chilled layer theprocesses analogical to those occurringduring production <strong>of</strong> pearlitic malleablecast iron.Observations and microstructurestudiesObservations on connections welded byfriction and chilled from the front pointout at cleavable nature <strong>of</strong> fractures,where initiation <strong>of</strong> cracks occur onthe boundaries <strong>of</strong> former austenitegrains (Fig. 4a). As it was evident fromstereoscope tests, in this case the break<strong>of</strong> sample occurred along the grains <strong>of</strong>cementite Fe 3 C, which did not break upentirely and occurred on the weldingline.The advantageous trend observedin Fig. 2 points out the direction <strong>of</strong>further investigations, although attemptstowards connecting <strong>of</strong> decarburizedcast iron seem more perspective, atleast theoretically. In this way, it wouldbe possible to create a specific ferritic
Properties and structure <strong>of</strong> spheroidal chilled cast iron welded by friction 71spacer, perfectly connected with nativematerial; this spaces should ensure betterconditions, or at least the same as duringfriction welding with the use <strong>of</strong> Armcoiron or low-carbon constructional steel.CONCLUSIONSBasing on carried out investigationsthere were formulated the followingconclusions:• The spheroidal cast iron can bedirectly welded by friction, withoutapplication <strong>of</strong> special heat treatmentsprior to welding.• The strength <strong>of</strong> connection increaseswith an increase in welding time.• The investigations on direct connecting<strong>of</strong> ferritic cast iron “chilled” fromthe front. The possibility <strong>of</strong> optimization<strong>of</strong> welding parameters (rotationalspeed n or friction force Pt) shouldbring the rational advantages.• “Decarburize” spheroidal cast ironin the welding zone. One can expect,that the produced surface layer willbe ferritic, which means that carboncontent in this zone will be equal toalmost zero, while the hardness <strong>of</strong>this layer will be small.REFERENCES“Friction welding”. 1999. Brochure-ManufacturingTechnology.INC(MTI).DETTE M., HIRSCH J. 1990. Reibschweissenvon Konstruieren aus Kugelgraphitgussmit Stahlteilen. Schweissen undSchneiden, 42, Vol. 11.KACZOROWSKI M., WINICZENKO R.1999. Procesy towarzyszące zgrzewaniutarciowemu żeliwa sferoidalnego ze stalą1H18N9T, II Międzynarodowa Konf.nt.: Nauka dla Przemysłu Odlewniczego,Kraków.SHINODA T., ENDO S., KATO Y. 1999.Friction welding <strong>of</strong> cast iron and stainlesssteels. Welding International, Vol. 13, No2, p. 89–95.WINICZENKO R. 2003. Łączenie żeliwasferoidalnego za pomocą zgrzewaniatarciowego. Inżynieria Rolnicza 11(53),237–243.Streszczenie: Właściwości i struktura zabielonegożeliwa sferoidalnego zgrzanego tarciowo. W pracyprzeprowadzono badania nad zgrzewaniem tarciowymżeliwa sferoidalnego „modyfikowanego” odczoła. Celem badań było „zmniejszenie” zawartościwęgla w stanie wolnym w strefie zgrzewania.Próbki zostały zgrzane tarciowo, a następnie poddanebadaniom wytrzymałościowym, twardościi strukturalnym z wykorzystaniem skaningowegomikroskopu elektronowego (SEM). Zwiększenieczasu tarcia korzystnie wpłynęło na wytrzymałośćpołączeń, aczkolwiek temperatura osiągniętaw centralnej części złącza była niewystarczającado rozpadu cementytu na fazy równowagowe.MS. received August 2008Author’s address:Radosław WiniczenkoKatedra Podstaw Inżynierii, Wydział InżynieriiProdukcji, <strong>SGGW</strong> ,ul. Nowoursynowska 166, 02-787 Warszawaemail: rwinicze@poczta.onet.pl
<strong>Annals</strong> <strong>of</strong> <strong>Warsaw</strong> <strong>University</strong> <strong>of</strong> <strong>Life</strong> <strong>Sciences</strong> – <strong>SGGW</strong>Agriculture No 52 (Agricultural and Forest Engineering) 2008: 73–79(Ann. <strong>Warsaw</strong> Univ. <strong>of</strong> <strong>Life</strong> Sci. – <strong>SGGW</strong>, Agricult. 52, 2008)Hyperspectral imaging for chilling injury detection in Red DeliciousapplesPart 1: Establishment <strong>of</strong> a hyperspectral imaging systemGAMAL ELMASRY 1 , NING WANG 2 , CLEMENT VIGNEAULT 31 Agricultural Engineering Department, Faculty <strong>of</strong> Agriculture, Suez Canal <strong>University</strong>, Ismailia, Egypt2 Department <strong>of</strong> Biosystems and Agricultural Engineering, Stillwater, Oklahoma, USA3 Horticulture Research and Development Centre, Agriculture and Agri-Food Canada, Quebec, CanadaAbstract: Hyperspectral imaging for chillinginjury detection in Red Delicious apples. Part 1:Establishment <strong>of</strong> a hyperspectral imaging system.A hyperspectral imaging system was establishedto acquire and preprocess apple images, as wellas to extract apple spectral properties. The fruitcolor was measured for both the external peel andthe internal flesh. The difference between the fleshresponses <strong>of</strong> both classes was clear from theirspectral responses, especially in the visible range,owing to the browning effect <strong>of</strong> chilling injurydevelopment. However, there was no significantdifference between normal and injured fruits interms <strong>of</strong> all color parameters (R, G, B, L*, a*, andb*).Key words: Hyperspectral imaging, artificialneural network (ANN), apple, optimal wavelength,firmness, chilling injury.INTRODUCTIONApple susceptibility to defects isaffected by the nature <strong>of</strong> the applevariety, the growing conditions, thecultural methods, and the harvesting,postharvest, handling and storageconditions. External defects are usuallyeasy to detect visually, especially whenthey present some contrast with normaltissues. Chilling injury is a physiologicaldamage to fruit cell membranes thatmay occur at any time owing to harmfulenvironmental conditions duringthe growing season, transportation,distribution or storage, at the retail store,or even in a home refrigerator. Themembrane damage is <strong>of</strong>ten followedby a cascade <strong>of</strong> secondary effects, suchas an increase in ethylene production,an increase in respiration, a decreasein photosynthesis, and an alteration <strong>of</strong>cellular structure causing the fruits tobe more susceptible to diseases. Earlydetection and diagnosis <strong>of</strong> chilling injuryis rather difficult, as the injured produce<strong>of</strong>ten looks sound as long as it remainsin low temperatures. Symptoms becomeevident when the produce is placed inwarmer temperatures. Symptoms mayappear almost immediately, or theymay take several days to develop (Skog1998).Increased demands for objectivity,consistency and efficiency in defectdetection techniques have necessitatedthe introduction <strong>of</strong> computer-basedtechniques that can be reasonablesubstitutes for human inspection. Theideal method for detecting injured fruitsshould be rapid, precise, reliable and nondestructive.The hyperspectral imagingtechnique integrates spectroscopy anddigital imaging techniques to providespectral and spatial information
74 G. Elmasry, N. Wang, C. Vigneaultsimultaneously for the surface <strong>of</strong> intereston a target object. A hyperspectral imageconsists <strong>of</strong> a series <strong>of</strong> sub-images, eachone representing the intensity distributionat a certain spectral band. This techniquehas been implemented in severalapplications, such as the inspection <strong>of</strong>poultry carcasses (Chao et al. 2001; Parket al. 2004), defect detection and qualitydetermination in fruits and vegetables(Li et al. 2002; Cheng et al. 2004; Liu etal. 2006), and the estimation <strong>of</strong> physical,chemical and mechanical properties invarious commodities (Park et al. 2003;Lu 2004; Nagata et al. 2005).The ultimate objective <strong>of</strong> thisresearch was to establish sufficientlyrobust models for the detection <strong>of</strong>chilling injury in apple using the tools<strong>of</strong> hyperspectral imaging and ANN. Thespecific objectives for this paper wereto: a) establish a hyperspectral imagingplatform for apple chilling injury; (b) todevelop strategies on image acquisitionand preprocessing; (c) to explore spectralsignatures for normal and chillinginjuredapples; and (d) to evaluate color<strong>of</strong> apple samples.for another 24 hours to allow injurydevelopment. The other 32 fruits werestored at room temperature (20 ±1°C)and used as control (normal) samples.The external surface <strong>of</strong> the injured fruitslooked normal visually in terms <strong>of</strong> colorand texture.Hyperspectral imaging systemHyperspectral images <strong>of</strong> the apples(normal and injured) were acquiredusing a lab-scale hyperspectral imagingsystem (Fig. 1) that consisted <strong>of</strong> acharge-coupled device (CCD) camera(PCO-1600, PCO Imaging, Germany)connected to a spectrograph (ImSpectorV10E, Optikon Co., Canada) coupledwith a standard C-mount zoom lens. Thesensitivity <strong>of</strong> this optic assembly waswithin the spectral range <strong>of</strong> 400 to 1000nm. The camera faced downward at adistance <strong>of</strong> 400 mm from the target. Thesample was illuminated through a cubictent made <strong>of</strong> white nylon fabric to provideuniform lighting conditions. The lightsource consisted <strong>of</strong> two 50 W halogenlamps mounted at a 45° angle from thehorizontal line, fixed at 500 mm aboveMATERIALS AND METHODSApple samplesApple fruits <strong>of</strong> the Red Delicious varietywere purchased from local retail stores. Atotal <strong>of</strong> 64 fruits free from any abnormalfeatures such as defects, bruises, diseasesand contamination were selected.Chilling injury was stimulated in 32fruits by keeping them in a cold storageat –1°C for 24 hours. The injured fruitswere removed from the cold storageand kept at room temperature (20 ±1°C)FIGURE 1. The hyperspectral imaging system:a) a CCD camera, b) a spectrograph with a standardC-mount zoom lens, c) an illumination unit,d) a light tent and e) a PC supported with the imageacquisition s<strong>of</strong>tware
Hyperspectral imaging for chilling injury detection... 75the sample and spaced 900 mm apart ontwo opposite sides <strong>of</strong> the sample. Thesample position corresponded with thecenter <strong>of</strong> the field <strong>of</strong> view <strong>of</strong> the camera.The spectral images were collected ina dark room where only the halogen lightsource was used. The exposure time wasadjusted to 200 ms throughout the test.Each spectral image collected was storedas a three-dimensional image (x, y, λ).The spatial components (x, y) included400 × 400 pixels, and the spectralcomponent (λ) included 826 bands within400 to 1000 nm. The hyperspectralimaging system was controlled by a laptopPentium M computer (processor speed:2.0 GHz; RAM: 2.0 GB) preloaded andconfigured with the Hypervisual ImageAnalyzer® s<strong>of</strong>tware program (ProVisionTechnologies, Stennis Space Center, Mo.,USA). All the spectral images acquiredwere processed and analyzed using theEnvironment for Visualizing Imagess<strong>of</strong>tware program (ENVI 4.2, ResearchSystems Inc., Boulder, Co., USA).The hyperspectral images werecalibrated with a white reference and adark reference. The dark reference wasused to remove the dark current effect <strong>of</strong>the CCD detectors, which are thermallysensitive. The calibrated image (R) wasthen defined using Equation (1):R R o −=D ×100 (1)W − Dwhere Ro is the acquired hyperspectralimage, D is the dark image (with 0%reflectance) collected by turning <strong>of</strong>f thelight source by means <strong>of</strong> completelyclosing the lens <strong>of</strong> the camera, and W isthe white reference image taken from astandard white reference board (Teflonwhite board with 99% reflectance). Thecalibrated images were used to extractinformation about the spectral properties<strong>of</strong> normal and injured fruits with aview to optimizing the identification <strong>of</strong>chilling injury, the selection <strong>of</strong> effectivewavelengths, the prediction <strong>of</strong> firmness,and classification.Extraction <strong>of</strong> fruit spectral propertiesThe spectral characteristics <strong>of</strong> an appledescribe its response to incident radiation.When an apple is subjected to visible andinfrared radiation, 80% <strong>of</strong> the radiationis reflected from the external surface <strong>of</strong>the fruit, and 20% penetrates inside theapple; <strong>of</strong> that, 1% is re-emitted. Thereflected and re-emitted radiation can bemeasured and recorded as an absorption/reflectance spectrum (Bochereau et al.1992). This spectrum is relevant to thechemical composition <strong>of</strong> the apple, andspectra collected from apples at differentquality levels can therefore be quitedifferent.The first step in detecting chillinginjury is to extract the spectral signaturesrepresenting chilling-injured fruits andthose representing normal fruits. Thedetailed steps in extracting the spectralsignature are illustrated in Figure 2. Theimage at 550 nm with the best contrastbetween the apple and background wasselected from the spectral space andsegmented to act as a mask to excludebackground pixels. The white pixels inthe mask were used as an area <strong>of</strong> interest(AOI) to extract the spectral data fromthe calibrated hyperspectral image. Themean reflectance spectrum from theAOI <strong>of</strong> each hyperspectral image wascalculated by averaging the spectralvalue <strong>of</strong> all pixels in the AOI. In total,
76 G. Elmasry, N. Wang, C. VigneaultFIGURE 2. Extraction <strong>of</strong> the fruit spectral signature: a) selecting 550 nm image, b) binarization (definingthe AOI), c) applying the mask, d) calculating the fruit spectral signature using only those at thewhite pixels in the mask64 average spectra (400–1000 nm)representing the 64 tested fruits werecalculated and stored for selection <strong>of</strong>the wavelength and development <strong>of</strong> theANN model.Fruit color measurementTo demonstrate the visual changes thatoccurred during the chilling injurydevelopment process, fruit color wasmeasured for both the external peel andthe internal flesh. The color image wasconstructed for each fruit by combiningthe red (650 nm), green (500 nm) andblue (450 nm) band images from thecalibrated hyperspectral data space t<strong>of</strong>orm an RGB (red-green-blue) image. Allthe RGB images were transformed intothe L*a*b* format, where L* stands forcolor lightness (0 indicates black and 100indicates white), a* defines the positionbetween green and red (0 indicates greenand 255 indicates red), and b* indicatesthe position between blue and yellow (0indicates blue and 255 indicates yellow).The RGB values were transformed intoa* and b* color components in order toproduce a better identification <strong>of</strong> colorchanges according to Vízhányó andFelföldi (2000). The color conversionprocess was conducted by means <strong>of</strong>a program written using MATLAB 7(Release 14, The MathWorks Inc., Mass.,USA).RESULTS AND DISCUSSIONSSpectral characteristicsFigure 3a shows the average spectralsignature <strong>of</strong> both normal and injuredfruits obtained from the apple surfaces.There were no significant differencesbetween the normal and the injuredfruits in the visible range (400–700nm), indicating that it was impossible todetect injured fruits using the traditionalmachine vision systems that utilizegray-scale or color cameras. However,the distinction between normal andinjured fruits was obvious in the nearinfraredregion (700–1000 nm) owingto chemical changes that occur duringchilling injury development. The internalspectral responses <strong>of</strong> the fruit flesh
Hyperspectral imaging for chilling injury detection... 77that were obtained after removal <strong>of</strong> thepeel are also illustrated (Fig. 3b). Thedifference between the flesh responses<strong>of</strong> both classes was clear, especially inthe visible range, owing to the browningeffect <strong>of</strong> chilling injury development.both normal and injured fruits, becausethere were no significant differencesbetween the two classes for all colorparameters (R, G, B, L*, a*, and b*).The results presented in Table 1 are inagreement with the spectral signaturesaRelative reflectance, %100806040200NormalInjured400 500 600 700 800 900 1000Wavelength, nmRelative reflectance, %100806040200NormalInjured400 500 600 700 800 900 1000Wavelength, nmFIGURE 3. Spectral characteristics <strong>of</strong> normal and injured apples for a) the external surface and b) theinternal fleshbColor differencesThe color differences between normaland injured fruits for the external surfaceas well as for the internal flesh are shownin Table 1. The external surface (fruitpeel) exhibited the same appearance for<strong>of</strong> the fruits in the visible range shownin Figure 6a. However, there was asignificant difference between the flesh<strong>of</strong> the normal fruits and the flesh <strong>of</strong> theinjured fruits in all color parameters.If parameter a* is considered to be anTABLE 1. Means and standard deviations (SD) <strong>of</strong> color characteristics and <strong>of</strong> normal and chilling--injured fruits for surface and fleshExternal surfaceInternal fleshNormalMean ± SDInjuredMean ± SDNormalMean ± SDInjuredMean ± SDR 1 0.626 ± 0.045 a 0.616 ± 0.037 a 0.814 ± 0.021 a 0.735 ± 0.050 bG 1 0.187 ± 0.024 a 0.198 ± 0.019 a 0.557 ± 0.023 a 0.395 ± 0.065 bB 1 0.187 ± 0.022 a 0.186 ± 0.020 a 0.218 ± 0.026 a 0.118 ± 0.035 bL* 51.740 ± 8.57 a 52.460 ± 8.09 a 164.88 ± 4.50 a 132.75 ± 14.61 bA* 156.86 ± 6.61 a 155.93 ± 5.54 a 148.13 ± 2.98 a 159.76 ± 5.19 bB* 144.64 ± 4.82 a 144.77 ± 4.40 a 182.21 ± 1.43 a 180.13 ± 3.12 bValues with same superscript letters within each row are not significantly different, α = 0.05.RrR G B g GR G B b B= ; = ; =+ + + + R + G + B
78 G. Elmasry, N. Wang, C. Vigneaultindicator <strong>of</strong> browning (0 indicates greenwhile 255 indicates red), the effect <strong>of</strong>the chilling injury in terms <strong>of</strong> fleshbrowning can be evaluated. The a* value<strong>of</strong> normal flesh was 148.13 ± 2.98, avalue that significantly differed from that<strong>of</strong> the injured flesh (159.76 ± 5.19). Thehigher a* value <strong>of</strong> injured fruits indicatesbrowning <strong>of</strong> the flesh compared withthe flesh <strong>of</strong> the normal fruits. Based onthe spectral and color characteristics <strong>of</strong>normal and injured fruits, it could beinferred that distinguishing injured fruitsfrom sound ones by means <strong>of</strong> visualmethods is rather difficult.CONCLUSIONSA hyperspectral imaging system witha spectral range <strong>of</strong> 400–1000 nm wasestablished for the detection <strong>of</strong> chillinginjury in Red Delicious apple. Theapple images were preprocessed, andthe spectral data was extracted. Thedifference between the flesh responses<strong>of</strong> both classes was clear, especially inthe visible range, owing to the browningeffect <strong>of</strong> chilling injury development.There was no significant differencebetween normal and injured fruits interms <strong>of</strong> all color parameters (R, G, B,L*, a*, and b*).REFERENCESBOCHEREAU L., BOURGINE P.,PALAGOS B. 1992: A method forprediction by combining data analysisand neural networks: Applicationto prediction <strong>of</strong> apple quality usingnear infra-red spectra. AgriculturalEngineering Research. 51(2), 207–216.CHAO K., CHEN Y.R., HRUSCHKA W.R.,PARK B. 2001: Chicken heart diseasecharacterization by multi-spectralimaging. Transactions <strong>of</strong> ASAE. 17(1),99–106.CHENG X., CHEN Y.R., TAO Y., WANGC.Y., KIM M.S., LEFCOURT A.M.2004: A novel integrated PCA and FLDmethod on hyperspectral image featureextraction for cucumber chilling damageinspection. Transactions <strong>of</strong> ASAE. 47(4),1313−1320.LI Q., WANG M., GU W. 2002: Computervision based system for apple surfacedefect detection. Computers andElectronics in Agriculture. 36(2002),215–223.LIU Y., CHEN Y.R., WANG C.Y., CHAND.E., KIM M.S. 2006: Development <strong>of</strong>hyperspectral imaging technique for thedetection <strong>of</strong> chilling injury in cucumbers;spectral and image analysis. AppliedEngineering in Agriculture. 22(1),101–111.LU R. 2004: Multispectral imaging forpredicting firmness and soluble solidscontent <strong>of</strong> apple fruit. Postharvest Biologyand Technology. 31(1), 147–157.NAGATA M., TALLADA J.G., KOBAYASHIT., TOYODA H. 2005: NIR hyperspectralimaging for measurement <strong>of</strong> internalquality in strawberries. ASAE Paper No.053131, ASAE Meeting, Tampa, Fla.,USA.PARK B., ABBOTT J.A., LEE K.J., CHOIC.H., CHOI K.H. 2003: Near-infrareddiffuse reflectance for quantitative andqualitative measurement <strong>of</strong> solublesolids and firmness <strong>of</strong> Delicious and Galaapples. Transactions <strong>of</strong> ASAE. 46(6),1721–1731.PARK B., WINDham W.R., LawrenceK.C., Smith D.P. 2004: Hyperspectralimage classification for fecal and ingestaidentification by spectral angle mapper.ASAE Paper No. 043032, ASAE/CSAEMeeting, Ottawa, Ont., Canada.SKOG L.J. 1998: Chilling Injury <strong>of</strong>Horticultural Crops. Ministry <strong>of</strong>
Hyperspectral imaging for chilling injury detection... 79Agriculture, Food and Rural Affairs,Report No. 98-021, Ontario, Canada.VÍZHÁNYÓ T., FELFÖLDI J. 2000:Enhancing colour differences in images<strong>of</strong> diseased mushrooms. Computersand Electronics in Agriculture. 26(2),187–198.Streszczenie: Nadwidmowy system obrazu dlawykrywania uszkodzeń podczas wychładzaniaw jabłkach red delicious. Część 1: Założenianadwidmowego systemu obrazu. Opracowanonadwidmowy system obrazu w celu uzyskaniai wstępnej obróbki obrazów jabłek oraz określeniaich właściwości widmowych. Kolor owocówmierzono w skórce zewnętrznej, jak i w wewnętrznymmiąższu. Różnice pomiędzy reakcjąmiąższu obydwu klas określono na podstawie ichreakcji widmowych, szczególnie w zakresie widzialnym,dzięki efektowi brązowienia w wynikuuszkodzeń podczas schładzania. Nie stwierdzonojednak istotnych różnic pomiędzy zdrowymii uszkodzonymi owocami w zakresie parametrówbarwy (R, G, B, L*, a* i b*).MS. received June 2008Authors’ addresses:Gamal ElMasryAgricultural Engineering DepartmentFaculty <strong>of</strong> AgricultureSuez Canal <strong>University</strong>,P.O. Box. 41522, Ismailia, Egypte-mail: gmisry@yahoo.comNing WangDepartment <strong>of</strong> Bioresource EngineeringMcGill <strong>University</strong>21,111 Lakeshore RoadSainte-Anne-deBellevueQuebec H9X 3V9, CanadaDepartment <strong>of</strong> Biosystems and AgriculturalEngineeringStillwater, Oklahoma, 74078 USAe-mail: ning.wang@okstate.eduClément VigneaultHorticulture Research and Development CentreAgriculture and AgriFood Canada430 Gouin BoulevardSaint-Jean-sur-RichelieuQuebec J3B 3E6, Canadae-mail: vigneaultc@agr.gc.ca
<strong>Annals</strong> <strong>of</strong> <strong>Warsaw</strong> <strong>University</strong> <strong>of</strong> <strong>Life</strong> <strong>Sciences</strong> – <strong>SGGW</strong>Agriculture No 52 (Agricultural and Forest Engineering) 2008: 81–88(Ann. <strong>Warsaw</strong> Univ. <strong>of</strong> <strong>Life</strong> Sci. – <strong>SGGW</strong>, Agricult. 52, 2008)Hyperspectral imaging for chilling injury detection in Red DeliciousapplesPart 2: Selection <strong>of</strong> optimal wavelengths for chilling injury detectionGAMAL ELMASRY 1 , NING WANG 2 , CLEMENT VIGNEAULT 31 Agricultural Engineering Department, Faculty <strong>of</strong> Agriculture, Suez Canal <strong>University</strong>, Ismailia, Egypt2 Department <strong>of</strong> Biosystems and Agricultural Engineering, Stillwater, Oklahoma, USA3 Horticulture Research and Development Centre, Agriculture and Agri-Food Canada, Quebec, CanadaAbstract: Hyperspectral imaging for chillinginjury detection in Red Delicious apples. Part2: Selection <strong>of</strong> optimal wavelengths for chillinginjury detection. Hyperspectral imaging (400––1000 nm) and artificial neural network techniqueswere investigated for the detection <strong>of</strong> chillinginjury in Red Delicious apples. Feed-forwardback-propagation ANN models were developedto select the optimal wavelength(s), classify theapples and detect firmness changes due to chillinginjury. The five optimal wavelengths selectedby ANN were 717, 751, 875, 960 and 980 nm.With the spectral and spatial responses at theselected five optimal wavelengths, an averageclassification accuracy <strong>of</strong> 98.44% was achievedfor distinguishing between normal and injuredfruits. The correlation coefficients betweenmeasured and predicted firmness values were0.93, 0.91 and 0.92 for the training, testing andvalidation sets, respectively.Key words: hyperspectral imaging, artificial neuralnetwork (ANN), apple, optimal wavelength,firmness, chilling injury.INTRODUCTIONChilling injury is a physiologicaldamage to fruit cell membranes thatmay occur at any time owing to harmfulenvironmental conditions duringthe growing season, transportation,distribution or storage, at the retail store,or even in a home refrigerator. However,early detection and diagnosis <strong>of</strong> chillinginjury is rather difficult, as the injuredproduce <strong>of</strong>ten looks sound as long as itremains in low temperatures. Increaseddemands for objectivity, consistency andefficiency in defect detection techniqueshave necessitated the introduction <strong>of</strong>computer-based techniques that canbe reasonable substitutes for humaninspection. The hyperspectral imagingtechnique integrates spectroscopy anddigital imaging techniques to providespectral and spatial informationsimultaneously for the surface <strong>of</strong> intereston a target object. This technique hasbeen implemented in defect detectionand quality determination in fruits andvegetables (Kim et al. 2002; Polderet al. 2002), and the estimation <strong>of</strong>physical, chemical and mechanicalproperties in various commodities (Lu2004). Artificial neural network (ANN)models are developed to simulate theorganizational principles <strong>of</strong> the humanbrain and nervous system. An ANNconsists <strong>of</strong> a large number <strong>of</strong> computingelements (called nodes) that are linkedtogether. The overall performance <strong>of</strong> anANN is determined by the structure andthe strength <strong>of</strong> the connections (Bronset al. 1993). ANNs have an advantage
82 G. Elmasry, N. Wang, C. Vigneaultin solving problems in which someinputs and corresponding output valuesare known but the relationship betweenthe inputs and outputs is not wellunderstood or is difficult to translateinto a mathematical function. Despitemathematical differences, ANNs haveproven to be stronger than statisticalclassifiers in the identification andclassification <strong>of</strong> agricultural produce(Jayas 2000), where non-coherenceor non-linearity <strong>of</strong>ten exists. Kavdýrand Guyer (2004) developed a backpropagationneural network (BPNN)with the texture features extracted fromspatial distribution <strong>of</strong> color/gray levelsto detect defects (leaf roller, bitter pit,russet, puncture and bruises) in Empireand Golden Delicious apples.The ultimate objective <strong>of</strong> this studywas to establish sufficiently robust modelsfor the detection <strong>of</strong> chilling injury in appleusing the tools <strong>of</strong> hyperspectral imagingand ANN. The specific objectives were:a) to establish an ANN model for theselection <strong>of</strong> the optimal wavelength(s)for identifying normal apples againstinjured apples; c) to develop ANNs formonitoring firmness changes in applesbased on spectral images at the selectedoptimal wavelength(s); and d) to developANNs for fruit classification accordingto firmness levels.MATERIALS AND METHODSApple imagesApple images were collected throughthe procedures described in ElMasry,et al. 2007a. Images from all 64 fruits(normal and injured) were used to trainand test an ANN for the selection <strong>of</strong> theoptimal wavelength(s). To increase therobustness <strong>of</strong> the ANN models, another20 Red Delicious apples were purchasedin order to validate the ANN models andalgorithms that were developed. In 10<strong>of</strong> those apples, chilling injuries werestimulated using the previously describedprocedures. The other 10 fruits were keptat room temperature and used as normalfruits.Firmness measurementAfter spectral image acquisition, thefirmness <strong>of</strong> each fruit was measured withan Instron Universal Testing Machine(Model 4502, Series IX Automated MaterialsTesting System, Instron Corporation,Mass., USA) using an 11 mm diameterplunger according to the standardmethod (ASAE, 1994). After removal <strong>of</strong>the fruit peel, the plunger was pressedinto the fruit flesh to a depth <strong>of</strong> 9 mmat a speed <strong>of</strong> 50 mm/min. The maximumforce extracted from the force-deformationcurve was used to indicate the fruitfirmness. The firmness test was conductedat two opposite positions on the equator<strong>of</strong> the fruit surface and subsequentlyaveraged. The average maximum forcewas used as the firmness index <strong>of</strong> thefruit.Data volume reduction and optimalwavelength selectionThe major disadvantage <strong>of</strong> thehyperspectral imaging technique is thathandling the huge amount <strong>of</strong> data extractedfrom hyperspectral images requires extratime and resources. It is imperative thatefficient manipulation procedures beused to reduce data dimensionality to itslowest level without losing functionality.In this study, instead <strong>of</strong> the entire image
Hyperspectral imaging for chilling injury detection... 83volume (400 × 400 × 826) being used,a reduced data cube with dimensions <strong>of</strong>400 × 400 × n, where n is the number<strong>of</strong> selected optimal wavelengths, wasformed. The success <strong>of</strong> a classificationalgorithm based on the reduced data cubedepends on the quality <strong>of</strong> the selection<strong>of</strong> the optimal wavelengths at whichthe spectral signatures can best describeeach class. Although several wavelengthselection techniques have been derivedby researchers (e.g. Liu et al. 2003; Mehlet al. 2004; Chong and Jun 2005), thechoice <strong>of</strong> a particular method dependson the nature <strong>of</strong> the problem, the size <strong>of</strong>the data set, ease <strong>of</strong> implementation andeconomic feasibility. In this study, anANN was used for data volume reductionand wavelength selection on the basis<strong>of</strong> the fact that the network can changeand adjust its knowledge by adjustingits weights according to the presentedsamples <strong>of</strong> data.ANN Model 1 for selection<strong>of</strong> wavelength(s)A multilayer BPNN, ANN Model 1, wasdeveloped to differentiate injured applesfrom normal ones. Back-propagationis the canonical feed-forward networkin which an error signal is fed backthrough the network, altering weights asit goes; back-propagation is therefore anumerically intensive technique.Weights between the simpleprocessing units <strong>of</strong> nodes were adjustedby iterating input patterns throughoutthe network until the error between thenetwork output and the targeted outputwas minimized. ANN Model 1 consisted<strong>of</strong> three layers: an input layer, an outputlayer and a hidden layer. The input layerhad 826 nodes representing the spectralresponses <strong>of</strong> a fruit at each <strong>of</strong> the 826wavelengths. Owing to the large volume<strong>of</strong> data, only one hidden layer with fivenodes was used. The number <strong>of</strong> nodeson the output layer was determinedpredominantly by the number <strong>of</strong> classesunder investigation. Thus, two nodeswere used: normal fruits (coded as 1) andinjured fruits (coded as 0). A sigmoidfunction was used as a transfer functionbetween the input and hidden layers,and a linear transfer function was usedbetween the hidden and output layers. Thenetwork was trained for at least 20.000epochs or until the error measurementapproached 0.01%. Among the 64 testedfruits, 42 fruits (both normal and injured)were randomly chosen as a training set totrain the ANN model. The other 22 fruits(both normal and injured) were usedas a testing set to test the model. Thisprocedure was run three times on thesame 64 fruits; each time, 42 differentfruits were randomly selected for training,and the rest were used for testing. Theoutcomes <strong>of</strong> the three replications wereaveraged to calculate the importance <strong>of</strong>each variable.The importance <strong>of</strong> each variable(wavelength) for the ANN model wasevaluated using an index calculated byEquation (1):n n H ⎡⎛p ⎞ ⎤⎢⎜I pI ⎟pO ⎥∑ /⎢ ∑j jk jj ⎜⎝k ⎟ ⎥= 1⎠M =⎣⎢= 1 ,⎦⎥n p ⎛ n n H ⎡⎛p ⎞ ⎤ ⎞⎜ ⎢⎜I p/ I ⎟ij , piO ⎥ ⎟∑∑ ⎢ ∑i jk , j , k j= = ⎜⎝= ⎟ ⎥1⎜1⎝ ⎣⎢1⎠ ⎦⎥⎟⎠(1)where M is the importance measure forthe input variable, np is the number <strong>of</strong>
84 G. Elmasry, N. Wang, C. Vigneaultinput variables (826), nH is the number<strong>of</strong> hidden layer nodes (5 nodes), 219 I pjis the absolute value <strong>of</strong> the hidden layerweight corresponding to the pth inputvariable and the jth hidden layer, and Ois the absolute value <strong>of</strong> the output layerweight corresponding to the jth hiddenlayer.Each input variable had five weightvalues corresponding to the five nodesin the hidden layer <strong>of</strong> the ANN. Theindex M value was calculated for eachinput node and then normalized in the0 to 1 range. The higher the M value,the more important the node (variable/wavelength) for the classification <strong>of</strong>injured and normal fruits.ANN Model 2 for firmness predictionBased on the number <strong>of</strong> wavelengthsselected by ANN Model 1, a new feedforwardBPNN, ANN Model 2, wasestablished to predict the firmness <strong>of</strong>the fruits. The input layer consisted <strong>of</strong>the reflectance features at the selectedoptimal wavelengths. The hidden layercontained three nodes. The output layercontained only one node to representthe fruit firmness value. Sigmoid andlinear functions were used as transferfunctions, and over-fitting was avoidedby using Bayesian regularizationtraining algorithm. The model wastrained using 42 randomly selected fruitsand tested with the remaining 22 fruits.The maximum number <strong>of</strong> iterations intraining was set to 5.000.ANN Model 3 for classification <strong>of</strong>applesANN Model 3 was a revised version <strong>of</strong>ANN Model 2. The spectral responses atthe five optimal wavelengths were usedas input nodes. The output layer wasmodified to have two nodes: normal andinjured classes. The network was trainedusing 42 randomly selected fruits andtested with the remaining 22 fruits, witheach group containing both normal andinjured fruits. The maximum number <strong>of</strong>iterations in training was set to 5.000.The detailed procedures for detectingchilling injury and firmness changes inapple fruits are illustrated in Figure 1.Test for robustness <strong>of</strong> the ANNmodelsThe capability <strong>of</strong> the three ANNmodels for optimal wavelength selection,firmness prediction and classificationwas validated with a group <strong>of</strong> 20fruits purchased at a later stage in theexperiment and called the validationset. Chilling injury was stimulated in 10fruits using the same method describedpreviously. The same procedures wereused for hyperspectral image acquisition,image preprocessing and firmnessmeasurement. Model robustness wasevaluated by comparing the correlationcoefficients between the predicted andthe actual firmness and among theclassification accuracies obtained fromthe training, testing and validation sets.RESULTS AND DISCUSSIONSOptimal wavelength selectionANN Model 1 used the entire spectralrange (826 wavelengths) in the range<strong>of</strong> 400 to 1000 nm to generate greatperformance for detecting chilling injuryeffect, with 100% classification successfor both the training and the testingsamples. Figure 2 presents the results
Hyperspectral imaging for chilling injury detection... 85FIGURE 1. Flowchart <strong>of</strong> the key steps involved in chilling injury detection algorithmobtained, along with the highest Mvalues. The wavelengths correspondingto the highest M values, 717, 751, 875,960 and 980 nm, were chosen as theoptimal wavelengths.Firmness predictionFigure 3a shows the performance <strong>of</strong>ANN Model 2 in firmness prediction forthe training (42 fruits) and the testing (22fruits) sets. The correlation coefficientFIGURE 2. The importance measure (M) values used to select the optimal wavelengths
86 G. Elmasry, N. Wang, C. Vigneaultbetween measured and predicted firmnessvalues was 0.93 and 0.91 for the trainingand testing sets, respectively. The rootmean square error (RMSE) was 8.26and 9.4 N for the training and testingsets, respectively. Because <strong>of</strong> the highcorrelation coefficient <strong>of</strong> ANN Model 2for firmness prediction, this model canbe applied to the detection <strong>of</strong> firmnesschange due to chilling injury effect. Table2 shows the confusion matrix for theclassification <strong>of</strong> the 64 fruits (training +testing) into normal and injured classes.A high classification accuracy <strong>of</strong> 98.44%was obtained with ANN Model 3.Model robustnessFigure 3b shows the fruit firmnesspredicted by ANN Model 2 for thevalidation set. The correlation coefficientbetween the actual and predictedfirmness for the validation set was 0.92with an RMSE value <strong>of</strong> 10.09 N. Forclassification, ANN Model 3 achieved100% success for categorization <strong>of</strong> thevalidation set into the two classes (normaland injured). Both results are therefore inagreement with the training and testingsets, indicating the robustness <strong>of</strong> themodels for classification and firmnessaprediction <strong>of</strong> normal and injured RedDelicious apple fruits.CONCLUSIONSA hyperspectral imaging system witha spectral range <strong>of</strong> 400–1000 nm wasestablished for the detection <strong>of</strong> chillinginjury in Red Delicious apple. The appleimages were preprocessed, and thespectral data was extracted. There wasno significant difference between normaland injured fruits in terms <strong>of</strong> all colorparameters (R, G, B, L*, a*, and b*).Artificial neural network (ANN) modelswere developed for optimal wavelengthselection, fruit classification and firmnessprediction. Five optimal wavelengths(717, 751, 875, 960 and 980 nm) wereselected based on the maximum weightassigned to the input nodes in ANN Model1. The ANN models were trained, testedand validated with different fruit sets toevaluate the robustness <strong>of</strong> the models.With the selected optimal wavelengthsinstead <strong>of</strong> the whole spectral range (826wavelengths), the correlation coefficientsbetween the actual and predicted firmnessobtained using ANN Model 2 were 0.93,bFIGURE 3. Apple firmness prediction by neural network for: a) the training and testing sets and b) thevalidation set
Hyperspectral imaging for chilling injury detection... 87TABLE 2. Confusion matrix for fruit classification using ANN Model 3From/to Normal Injured Total % correctNormal 32 0 32 100Injured 1 31 32 96.88Total 33 31 64 98.440.91 and 0.92 for the training, testingand validation sets, respectively. ANNModel 3 achieved an accuracy <strong>of</strong> 98.44%and 100% in distinguishing normal frominjured fruits for the training + testing setand the validation set, respectively.In summary, the experimental resultsdemonstrate that the spectral imagingsystem associated with ANN cansuccessfully distinguish between chillinginjuredfruits and normal fruits, as well asdetect firmness changes. Considering theimportance <strong>of</strong> the data volume reductionobtained, spectral imaging systems usingthe selected wavelengths open a newavenue for more optimistic applicationsin commercial implementations fordetecting various quality disorders indifferent types <strong>of</strong> produce.REFERENCESASAE, 1994: Compression test <strong>of</strong> foodmaterials <strong>of</strong> convex shape. ASAEStandards. ASAE, St. Joseph, Mich.,USA. ASAE S368.2. p. 472–475.BRONS A., RABATEL G., ROS F., SÉVILAF., TOUZET C. 1993: Plant gradingby vision using neural networks andstatistics. Computers and Electronics inAgriculture. 9(1), 25–39.CHONG L.G., JUN C.H. 2005: Performance<strong>of</strong> some variable selection methodswhen multicollinearity is present.Chemometrics and Intelligent LaboratorySystems. 78(1), 103–112.HAHN F., LOPEZ I., HERNANDEZ G.2004: Spectral detection and neuralnetwork discrimination <strong>of</strong> Rhizopusstolonifer spores on red tomatoes.Biosystems Engineering. 89(1), 93–99.JAYAS D.S., PALIWAL J., VISEN N.S.2000: Multi-layer neural networks forimage analysis <strong>of</strong> agricultural products.Agricultural Engineering Research.77(2), 119–128.KAVDÝR Ý., GUYER D.E., 2004:Comparison <strong>of</strong> artificial neural networksand statistical classifiers in apple sortingusing textural features. BiosystemsEngineering. 89(3), 331–344.KIM J., MOWAT A., POOLE P., KASABOVN. 2000: Linear and non-linear patternrecognition models for classification <strong>of</strong>fruit from visible–near infrared spectra.Chemometrics and Intelligent LaboratorySystems. 51, 201–216.LIU Y., WINDHAM W.R., LAWRENCEK.C., PARK B. 2003: Simple algorithmsfor the classification <strong>of</strong> visible/nearinfraredand hyperspectral imagingspectra <strong>of</strong> chicken skins, feces, andfecal contaminated skins. AppliedSpectroscopy. 57(12), 1609–1612.LU R. 2004: Multispectral imaging forpredicting firmness and soluble solidscontent <strong>of</strong> apple fruit. Postharvest Biologyand Technology. 31(1), 147–157.MEHL P.M., CHEN Y.R., KIM M.S., CHAND.E. 2004: Development <strong>of</strong> hyperspectralimaging technique for the detection <strong>of</strong>apple surface defects and contaminations.Journal <strong>of</strong> Food Engineering. 61(1),67–81.NAGATA M., TALLADA J.G., KOBA-YASHI T., TOYODA H. 2005: NIR hyperspectralimaging for measurement <strong>of</strong>internal quality in strawberries. ASAE Pa-
88 G. Elmasry, N. Wang, C. Vigneaultper No. 053131, ASAE Meeting, Tampa,Fla., USA.POLDER G., VAN DER HEIJDENG.W.A.M. YOUNG, I.T. 2002: Spectralimage analysis for measuring ripeness <strong>of</strong>tomatoes. Transactions <strong>of</strong> ASAE. 45(4),1155–1161.Streszczenie: Nadwidmowy system obrazu dlawykrywania uszkodzeń podczas wychładzaniaw jabłkach Red Delicious. Część 2: Wybór optymalnychdługości fal dla wykrywania uszkodzeńpodczas wychładzania. Przeprowadzono badanianadwidmowych obrazów (400–1000 nm) i techniksztucznej sieci neuronowej przy wykrywaniuuszkodzeń jabłek odmiany Red Delicious w wynikuwychładzania. Opracowano modele ANNze sprzężeniem do przodu i wsteczną propagacjąw celu wybrania optymalnej długości fali (fal),klasyfikacji jabłek i określenia zmian jędrnościw wyniku uszkodzeń podczas wychładzania. Zapomocą modeli ANN wybrano 5 optymalnychdługości fal: 717, 751, 875, 960 i 980 nm. Na podstawiewidmowych i przestrzennych reakcji przywybranych pięciu optymalnych długościach fal,podczas odróżniania zdrowych i uszkodzonychowoców uzyskano średnią dokładność klasyfikacjiwynoszącą 98,44%. Wartości współczynnikówkorelacji pomiędzy zmierzoną i prognozowanąjędrnością dla poszczególnych zestawów: uczenia,testowania i atestacji wynosiły odpowiednio:0,93; 0,91; i 0,92.MS. received June 2008Authors’ addresses:Gamal ElMasryAgricultural Engineering DepartmentFaculty <strong>of</strong> AgricultureSuez Canal <strong>University</strong>,P.O. Box. 41522, Ismailia, Egypte-mail: gmisry@yahoo.comNing WangDepartment <strong>of</strong> Bioresource EngineeringMcGill <strong>University</strong>21,111 Lakeshore RoadSainte-Anne-deBellevueQuebec H9X 3V9, CanadaDepartment <strong>of</strong> Biosystems and AgriculturalEngineeringStillwater, Oklahoma, 74078 USAe-mail: ning.wang@okstate.eduClément VigneaultHorticulture Research and Development CentreAgriculture and AgriFood Canada430 Gouin BoulevardSaint-Jean-sur-RichelieuQuebec J3B 3E6, Canadae-mail: vigneaultc@agr.gc.ca
<strong>Annals</strong> <strong>of</strong> <strong>Warsaw</strong> <strong>University</strong> <strong>of</strong> <strong>Life</strong> <strong>Sciences</strong> – <strong>SGGW</strong>Agriculture No 52 (Agricultural and Forest Engineering) 2008: 89–93(Ann. <strong>Warsaw</strong> Univ. <strong>of</strong> <strong>Life</strong> Sci. – <strong>SGGW</strong>, Agricult. 52, 2008)Experimental verifying <strong>of</strong> mathematic model for biomasscombustionMARTIN POLÁK 1) , PAVEL NEUBERGER 1) , JIŘÍ SOUČEK 2)1 Department <strong>of</strong> Mechanics and Engineering, Technical Faculty, Czech <strong>University</strong> <strong>of</strong> <strong>Life</strong> Science inPrague, Czech Republic2 Research Institute <strong>of</strong> Agricultural Engineering, Prague, Czech RepublicAbstract: Experimental verifying <strong>of</strong> mathematicmodel for biomass combustion. Among allalternative energy sources Czech Republic hasthe biggest potential in biomass. If we want useit effectively it is need to fulfil all requirements<strong>of</strong> this fuel. Created model describes combustionprocess from the point <strong>of</strong> view <strong>of</strong> imperfectburning and it is based on elementary analyse <strong>of</strong>fuel. This model was compared with results fromexperimental combustion. Difference betweenmodel and reality is in the maximum 5%, whilethis is valid for samples with worse burningstability. On the opposite, samples with goodstability show smaller deviation, ranging 1–2 %.Key words: biomass, combustion, emission,calculation model.INTRODUCTIONSignificant marker for evaluation andoptimisation <strong>of</strong> biomass combustion isan amount and composition <strong>of</strong> flue gases.It depends partly on burner constructionand partly on fuel composition. Burningprocess calculation models stemmingfrom fuel elementary analysis areimportant for solving many problemsin burner designing and controllingcombustion process. It is possible tocreate calculation model by two ways:1) with help <strong>of</strong> stechiometric equationsand dates from elementaryanalysis,2) with help <strong>of</strong> approximate equationsbased on fuel heat value.In case <strong>of</strong> heterogenous fuelscombustion only the first mentionedpossibility could be taken into account.Outcomes <strong>of</strong> this model are total airamount, generated flue gases amountand its composition for 1 kg <strong>of</strong> burnedfuel. Model takes into account perfectand imperfect burning.Calculation modelAn essence <strong>of</strong> the model is to describecombustion process <strong>of</strong> any solidfuel based on its elementary analysisconsidering perfect and imperfectburning. It is possible to compare datesfrom model with dates from experimentto see how the model reflects the reality.Some substantial equations are infollowing.Flue gas composition for perfectburning is:22.27V CO2 = ⋅ C+ 0. 003⋅V vv min ⋅ m12.01λ[m 3·kg –1 ] (1)21.89VSO 2= ⋅S[m 3·kg –1 ] (2)32.06
90 M. Polák, P. Neuberger, J. Souček44.81 22.41VHO2= ⋅ H + ⋅ W +403 . 18.02+ ( 104−1)⋅V vs ⋅ m. min λ [m 3·kg –1 ] (3)22.40V N2= ⋅ N + 0 7805⋅V vs ⋅ m28.01[m 3·kg –1 ] (4)VO= O2 2 min ⋅ λ m [m3·kg –1 ] (5)where V v min is minimal volume <strong>of</strong> air,λ m is coefficient <strong>of</strong> excess <strong>of</strong> air.In the case <strong>of</strong> imperfect burning part<strong>of</strong> carbon burns to CO and part remainsunburned. The part, which is burnt toCO:Va = CO 12.01⋅ ⋅C110 ⋅6 22.37[–] (6)VO2 skO 2 sk = ⋅100[%]Vsv skVHOH2O 2 sksk = ⋅100 [%]Vsv skMATERIAL AND METHODSMeasuring <strong>of</strong> burning characteristics<strong>of</strong> given samples were done during theexperiment. Concentration <strong>of</strong> each fuelgases component was monitored by gasanalyzer TESTO 350XL (Fig. 1) withranges: CO (0–400 000) ppm; NO x(0–3000) ppm; NO 2 (0–500) ppm;O 2 (0–25)%;CO 2 (0 – 50)% (direct measurement)Obtained values are defined as medianfrom measured data during continualmeasurement <strong>of</strong> stabile state burner.. min λ FIGURE 1. Analyzer TESTO 350XLwhere V CO is CO concentration in fluegases [mg·m –3 ].The part, which is unburnt:ΔVbv min= ⋅C−a881 . 2[–] (7)Then, the real concentrations <strong>of</strong>particular emission are:VCO2 skCO 2 sk = ⋅ 100 [%] (8)Vsv skVN2 skN 2 sk = ⋅100[%]Vsv skVSO2 skSO 2 sk = ⋅100[%]Vsv sk
Experimental verifying <strong>of</strong> mathematic model for biomass combustion 91Experimental combustionAn experimental combustion wasdone with boiler VERNER A25 (Fig.2). VERNER A25 is heat water boilerfor pellets which are supplied withscrew conveyer through back side <strong>of</strong>combustion chamber. Plate bottom <strong>of</strong>chamber is equipped with saw-like gratebar which removes ash in defined cycles.Side and upper walls are covered withceramic slabs. Air is forced by fan underthe grate as a primary and through sidewalls as secondary.experiment. Concentration <strong>of</strong> CO 2 influe gasses was used as a comparisonvalue. This component is in majority <strong>of</strong>emission measurement being calculatedafterwards and thus its real amountusually stays a secret. Analyzer TESTO350XL that we used is equipped withsensor for direct measuring <strong>of</strong> CO 2 andtherefore this value could be used in thecomparison.Comparison <strong>of</strong> separate values, e.g.<strong>of</strong> model and reality is apparent fromFigure 3.FIGURE 2. Hot water boiler VERNER A25Tested fuelPellets and chopped straw from mixture<strong>of</strong> permanent grass hay and other fuelswere used as trial fuel. List <strong>of</strong> fuelsamples and its basic characteristics isenclosed in Table 1.DISCUSSION AND CONCLUSIONThe results <strong>of</strong> calculation model werecompared to data obtained duringObtained and calculated values differin the maximum by 5%, while this isvalid for samples with worse burningstability. On the opposite, samples withgood stability show smaller deviation,ranging 1–2%. Calculation model withsuch a deviation is thus well suitable forapproximate burning calculation. But forexact determination <strong>of</strong> separate items ifwould be probably necessary to adjustthe calculation – apparently with regardto unburned fuel part.
92 M. Polák, P. Neuberger, J. SoučekTABLE 1. Fuel sample and its elementar analysisFuel samplehay + 10% coal,pellets 15 mmhay + bark (1:3),choppedhay + populus (1:1) ++ 20% coal,pellets 15 mmhay + populus (1:3),choppedhay + sorrel (1:3),choppedWaterVolatilecombustibleNon-volatilecombustibleAsh[%] [%] [%] [%]Total fuel heat[MJ//kg]Heating value[MJ//kg]C H N S O Cl[%] [%] [%] [%] [%] [%]8.7 66.8 18.5 5.9 17.7 16.1 44.3 6.4 1.1 0.1 33.1 0.38.3 68.3 19.6 3.8 17.5 16.1 43.5 5.4 0.4 0.1 38.6 0.19.4 65.9 18.4 6.3 18.3 16.8 47.4 5.8 0.9 0.2 29.9 0.26.5 74.0 15.1 4.3 18.0 16.6 46.1 5.8 0.7 0.1 36.5 0.17.3 69.8 17.5 5.4 16.9 15.4 43.6 6.1 0.6 0.1 36.7 0.1hay + 10%coal, pellets15 mmhay + bark(1:3) –choppedFIGURE 3. Comparison <strong>of</strong> model and realityhay +populus(1:1) + 20%coal, pellets15 mmhay +populus(1:3) –choppedhay + sorrel(1:3) –chopped
Experimental verifying <strong>of</strong> mathematic model for biomass combustion 93This article was created within thescope <strong>of</strong> project <strong>of</strong> National Agency<strong>of</strong> Agriculture Research No QF4079:“Logistic <strong>of</strong> bioenergy material”REFERENCESPASTOREK Z.; KÁRA, J.; JEVIČ P. 2004:Biomasa – obnovitelný zdroj energie.FCC PUBLIC Prague, Prague, 288.JEVIČ P.; ŠEDIVÁ Z.; SLADKÝ V. 1998:Emise při energetickém využití biomasy,Energie l/98, Prague.POLÁK M. 2005: Biomass for heatproduction. Ph.D. thesis, CUA Prague,113 p.POLÁK M.: Fytomass as a fuel for smallscale boilers. In: Naukovyj visnik NAU73/2004. Kyiiv 2004, p. 246–252.POLÁK M. 2004: The practical experiencewith fytomass combustion in small scaleboilers. In: Collection <strong>of</strong> abstracts <strong>of</strong>International conference – Science andresearch – Tools <strong>of</strong> global developmentstrategy, CUA in Prague, p. 38.Streszczenie: Doświadczalna weryfi kacja modelumatematycznego spalania biomasy. RepublikaCzeska posiada ze wszystkich źródeł alternatywnychnajwiększy potencjał w biomasie. Jeśli tenpotencjał chcemy efektywnie wykorzystywać, tonależy spełnić wszystkie wymogi, które to źródłoposiada. Opracowany model opisuje processpalania na podstawie analizy elementarnej paliwaprzy czym jest zakładane niedoskonałe czylirealne spalanie. Wyniki z modelu są następnieporównywane z wynikami spalania eksperymentalnego.Różnica między modelem i rzeczywistościąwynosi najwyżej 5%, przy czym ta wartośćodpowiada paliwu z niższą stabilnością spalania.W stosunku do paliwa z dobrą stabilnością spalaniaróżnica nie przekracza 1–2%.MS. received December 2007Authors’ addresses:Ing. Martin Polák, Ph.D.Technical FacultyCzech <strong>University</strong> <strong>of</strong> <strong>Life</strong> ScienceKamýcká 129Prague 6 – Suchdol 165 21Czech Republice-mail: karel@tf.czu.czJiří SoučekResearch Institute <strong>of</strong> Agricultural EngineeringDrnovská 507Praha 6 - 161 01e-mail: jiri.soucek@vuzt.cz
<strong>Annals</strong> <strong>of</strong> <strong>Warsaw</strong> <strong>University</strong> <strong>of</strong> <strong>Life</strong> <strong>Sciences</strong> – <strong>SGGW</strong>Agriculture No 52 (Agricultural and Forest Engineering) 2008: 95–101(Ann. <strong>Warsaw</strong> Univ. <strong>of</strong> <strong>Life</strong> Sci. – <strong>SGGW</strong>, Agricult. 52, 2008)Results <strong>of</strong> verification <strong>of</strong> the slaughter waste anaerobic fermentationprocess1 JAROSLAV KÁRA, ZDENĚK PASTOREK 1 , RADOMÍR ADAMOVSKÝ 21 Research Institute <strong>of</strong> Agricultural Engineering, Prague, Czech Republic2 Faculty <strong>of</strong> Engineering, Czech <strong>University</strong> <strong>of</strong> <strong>Life</strong> <strong>Sciences</strong>, Prague, Czech RepublicAbstract: Results <strong>of</strong> verifi cation <strong>of</strong> the slaughterwaste anaerobic fermentation process. The articledeals with the analysis <strong>of</strong> results <strong>of</strong> verification<strong>of</strong> a one-stage anaerobic digestion at mesophileand thermophile conditions in two series differingin retention time (26 and 37 days). Substratesconsisting <strong>of</strong> various proportions <strong>of</strong> poultrycrushed bones, pork ligaments, and slurry <strong>of</strong> beefcattleand pigs (1:1) were used. Stabilized nondrainedremainder <strong>of</strong> an anaerobic digestion wasused as inoculum. Results <strong>of</strong> verification showedeffectiveness <strong>of</strong> slaughter waste processingin biogas stations. However, slaughter wasteprocessing requires installation <strong>of</strong> equipment fora thermal modification <strong>of</strong> the feed-in substrate(warming up to 70°C for the duration <strong>of</strong> 1 hour).Key words: anaerobic fermentation, slaughterwaste, bio-degradable waste, biogas, biogasstations; retention.INTRODUCTIONThe basic <strong>of</strong> biogas production inagriculture is processing <strong>of</strong> wasteagricultural products (mainly livestockexcrements but also phytomass), othersector <strong>of</strong> biogas production is biologicallydegradable municipal waste andbiologically degradable industrial waste,particularly from food industry plants.Currently the attention is concentratedon the slaughterhouse waste processing.Processing <strong>of</strong> that waste in agriculturalbiogas plants could significantly improvetheir economy.In the past years, animal by-productsas well as slaughterhouse waste andwastewater have not been taken as wasteanymore. We have realized that is afeedstock to be treated in order to getits energy potential. With a rising threat<strong>of</strong> diseases such as bovine spongiformencephalopathy (BSE) in cattle, tighterlegislation and an effort to use non-wastetechnologies with an effective energygain there has also been raising demandon deeper research activities regarding tothis problems.Anaerobic digestion has become anestablished and proven technology asa means <strong>of</strong> managing solid as well asliquid organic waste.In this chapter, there are quotedsome results <strong>of</strong> research experimentsand information regarding to anaerobicdigestion <strong>of</strong> ABP:• The effect <strong>of</strong> hydraulic retentiontime (HRT) and loading on anaerobicdigestion <strong>of</strong> poultry slaughterwastes was studied by Salminen andRintala (2002). The experiment wascarried out in semi-continuously fedlaboratory-scale digesters at 31 o C.The effect on process performancewas highly significant: Anaerobicdigestion appeared feasible with aloading up to 0.8 kg volatile solids(VS)/m 3·d and an HRT <strong>of</strong> 50–100
96 J. Kára, Z. Pastorek, R. Adamovskýdays. The specific methane yieldwas high, from 0.52 to 0.55 m 3 //kg VS added . On the other hand, at ahigher loading, in the range from 1.0to 2.1 kg VS/ m 3·d, and as shorterHRT, in the range from 25 to 13 days,the process appeared inhibited and/or overloaded, as indicated by theaccumulation <strong>of</strong> volatile fatty acids(VFA) and long-chain fatty acids(LCFA) and the decline in the methaneyield. However, the inhibition wasreversible. The nitrogen in the feed,ca. 7.8% <strong>of</strong> the total solids (TS), wasorganic nitrogen with little ammoniapresent, whereas in the digestedmaterial ammonias accounted for 52––67% (up to 3.8 g/l) <strong>of</strong> total nitrogen.The TS and VS removals amountedto 76% and 64%, respectively.• A new generation mathematicalmodel called modelwas modified in order to describe asystem dynamics <strong>of</strong> slaughter wastedegradation (Vavilin 2003). Salminenet al. (2000) used this modifiedversion for studying <strong>of</strong> anaerobicbatch degradation <strong>of</strong> solid poultryslaughterhouse wastes.• Broughten et al. (1998) studiedanaerobic digestion <strong>of</strong> sheep tallow.The experiment was carried out inbatch reactors operating at mesophilic(35ºC) and thermophilic (50ºC)temperatures with sheep tallow atlevels up to 59% <strong>of</strong> the volatilesolids. Tallow was rapidly fermentedto LCFA and VFA at 35ºC, but wasrefractory at 50ºC. Oleic acid wasfermented to palmitic, stearic andacetic acid. Methanogenesis wasdelayed by characteristic adaptationperiods before LCFA and VFAwere completely degraded. Thisdemonstrated that wastes withhigh lipid contents are amenable tostabilization by mesophilic batchdigestion.• Dohányos et al. (2003) are studyingtwo methods <strong>of</strong> meat and bonemeal (MBM) treatment – pyrolysisand anaerobic digestion and theircombination, eventually. Thepreliminary experiments <strong>of</strong> anaerobicdigestion were carried out withclassically produced MBM at 140ºCand MBM pyrolysed at 200ºCand 285ºC. The biogas yield wasdetermined by batch experimentswith digested sludge as inoculum.The results showed very goodbiodegradability <strong>of</strong> MBM and MBMpyrolysed at 200ºC, biogas productionreached 0.37 l and 0.452 N·m 3 /kg <strong>of</strong>TS, respectively.• Raizada et al. (2003) observed performances<strong>of</strong> fixed and fluidized bedreactors used for the degradation <strong>of</strong>organic waste (rumen content) by atwo-stage anaerobic digestion processat different loading rates (2–12kg COD m –3·d–1 ) under mesophiliccondition. The performance <strong>of</strong> thefixed bed reactor was better in comparisonto the fluidized bed reactorand as no propionic acid accumulationwas observed in contrast to thefluidized bed reactor.• Farinet and Forest (2003) mentionbrief descriptions <strong>of</strong> two slaughterhousetreatment plants based on anaerobicdigestion in Africa. One is locatedin Senegal, the other in Egypt.Both have equipment for digestatecomposting. The authors suppose arising further development <strong>of</strong> this
Results <strong>of</strong> verifi cation <strong>of</strong> the slaughter waste anaerobic fermentation process 97combined treatment <strong>of</strong> slaughterhousewaste in Africa, mainly because<strong>of</strong> the high levels <strong>of</strong> energy price andcompost demand.• Ashare et al. (1983, in Straka et al.2003) studied available values <strong>of</strong>BOD <strong>of</strong> various types <strong>of</strong> waste frommeat processing industry. They foundout that available BOD <strong>of</strong> this wastehave a great potential e.g. for cattle– blood has 2.3 kg BOD/t LWK (liveweight killed), intestinal contenthas 2.5 kg BOD/t LWK; for poultry– 15.3 kg BOD/ t LWK. The specificmethane production gained fromthis waste is very high due to a highcontent <strong>of</strong> fat.MATERIALS AND METHODThe tests were carried out on the singlestageanaerobic digestion principle using5% dry-matter charges under mesophilicand thermophilic conditions in two seriesdiffering in retention times (experiments1 and 2 respectively).The following materials were thesubject <strong>of</strong> verification:••••poultry bone pulp (39.8% drymatter),pork sinews (15.2% dry matter),cattle and pig slurry mixed in aproportion 1:1,stabilized non-dehydrated residueafter anaerobic digestion, used asinoculum.The poultry pulp and pork sinews werecut up to particles <strong>of</strong> 12 mm. The slurryand digestate were mixed in a proportion1:1 in both the charges for the smallreactors (0.002 m 3 ) and the large reactors(0.1 m 3 ). The results <strong>of</strong> verification in thesmall reactors are quoted in this paper.The substrate proportions for each batchare shown in Table 1; Table 2 shows thematerial compositions <strong>of</strong> the batches.The retention times, or times <strong>of</strong> presence<strong>of</strong> each batch in the reactor, were 26 daysand 37 days during Experiments 1 and 2respectively.The biogas production in the smallreactors was measured using a gasmeter constructed at the AgriculturalTechnology Research Institute inPrague.Samples <strong>of</strong> the stabilized residue weretested for the presence <strong>of</strong> bacteria <strong>of</strong>TABLE 1. Substrate proportions in batches, for small reactorsReactorProportion[% mass]Poultry bone pulp[% mass]Pork sinews[% mass]1a 100 0 02a 90 10 03a 80 20 04a 70 30 05a 60 40 06a 90 0 107a 80 0 208a 70 0 309a 60 0 40
98 J. Kára, Z. Pastorek, R. AdamovskýTABLE 2. Material composition <strong>of</strong> charges in small rectors in both experimentsReactorProportions Poultry bone pulp Pork sinewsWater[g][g][g][g]1a 1250.0 0.0 0.0 750.02a 803.6 89.3 0.0 1107.13a 555.6 138.8 0.0 1305.64a 397.7 170.5 0.0 1431.85a 288.5 192.3 0.0 1519.26a 1034.5 0.0 114.9 850.67a 851.1 0.0 212.7 936.28a 693.1 0.0 297.1 1009.89a 555.6 0.0 370.3 1074.1the Salmonella and Enterobacteriaceaegenera in microbiological analyses atthe Microbiology Laboratory <strong>of</strong> theNational Medical Institute in Prague. Themicrobiologic methods applied complywith the requirements <strong>of</strong> EC Regulation1774/2002 (Salminen, Rintala, Lokshina,Vavilin 2000).RESULTS AND DISCUSSIONThis paper only presents in detailthe results <strong>of</strong> observations <strong>of</strong> biogasproduction. The biogas production wasmeasured daily; nevertheless, cumulativeproduction related to 1 kg <strong>of</strong> dry matteris quoted for the sake <strong>of</strong> clarity. Themeasurement results are for the smallreactors, verifying the concentrations <strong>of</strong>the additives, the poultry bone pulp, andthe pork sinews.The tested samples contained poultrybone pulp in concentrations <strong>of</strong> 10%,20%, 30%, and 40%, and pork sinews inidentical concentrations. Figures 1 to 4show the results <strong>of</strong> experiments for bonepulp and pork sinews in the mesophilicrange. The experimental developmentswere very similar to each other, butdiffered in certain details. The sampleswere processed in single-stage reactorsunder mesophilic and thermophilicconditions (the developments underthermophilic conditions are not quotedhere as they were very similar, only theretention times were reduced).The composition <strong>of</strong> samplescontaining the bone pulp seems optimal interms <strong>of</strong> biogas production and methanecontent. The highest cumulative biogasproduction rate was achieved in thesample containing 40% <strong>of</strong> poultry bonepulp (381.5 litres per kg <strong>of</strong> dry matter,and 561.0 litres per kg <strong>of</strong> dry matter,respectively) after 26 days.The samples containing 10% and 20%<strong>of</strong> pork sinews showed a satisfactoryproduction <strong>of</strong> both biogas and methane.The best result was achieved with thesample containing 10% <strong>of</strong> pork sinews(460.5 liters per kg <strong>of</strong> dry matter,and 641.4 liters per kg <strong>of</strong> dry matter,respectively) after 26-day retention.The samples containing 30% and 40%<strong>of</strong> pork sinews were characterized bylow biogas production rates and highmethane contents (70–80%). These
Results <strong>of</strong> verifi cation <strong>of</strong> the slaughter waste anaerobic fermentation process 99450400Biogas production l.kg -1 <strong>of</strong> d.m.3503002502001501005001 2 3 4 5 6 7 8 9 10 11 12 13 14 15 16 17 18 19 20 21 22 23 24 25 26Content <strong>of</strong> poultry crushed bones:days0% crushed bones 10% crushed bones 20% crushed bones30% crushed bones 40% crushed bonesFIGURE 1. Cumulative biogas production, poultry bone pulp, Experiment 1 (Biogas production [litresper kg <strong>of</strong> dry matter])600500Biogas production l.kg -1 <strong>of</strong> d.m.40030020010001 3 5 7 9 11 13 15 17 19 21 23 25 27 29 31 33 35 37Content <strong>of</strong> poultry crushed bones:days0% crushed bones 10% crushed bones 20% crushed bones30% crushed bones 40% crushed bonesFIGURE 2. Cumulative biogas production, poultry bone pulp, Experiment 2
100 J. Kára, Z. Pastorek, R. AdamovskýBiogas production l.kg -1 <strong>of</strong> d.m.4003503002502001501005001 2 3 4 5 6 7 8 9 10 11 12 13 14 15 16 17 18 19 20 21 22 23 24 25 26daysContent <strong>of</strong> pork sinews:0% 10% sinews 20% sinews 30% sinews 40% sinewsFIGURE 3. Cumulative biogas production, pork sinews, Experiment 1600Biogas production l.kg -1 <strong>of</strong> d.m.50040030020010001 3 5 7 9 11 13 15 17 19 21 23 25 27 29 31 33 35 37daysContent <strong>of</strong> pork sinews:0% sinews 10% sinews 20% sinews 30% sinews 40% sinewsFIGURE 4. Cumulative biogas production, pork sinews, Experiment 2samples posed considerable difficultiesin terms <strong>of</strong> frothing. The large reactorsvalidated the results in the small reactors,only the frothing <strong>of</strong> the samples was notas marked, and the maximum biogasproduction occurred ten days earlier inthe thermophilic process (Vavilin 2003).The stabilized residue after anaerobicdigestion was analyzed chemically andmicrobiologically, and its suitability forsoil application was ascertained.It can be stated that poultry bone pulpand pork sinews are suitable materialsfor anaerobic digestion provided thatthe appropriate mass proportions in thefermented mixture are maintained.
Results <strong>of</strong> verifi cation <strong>of</strong> the slaughter waste anaerobic fermentation process 101CONCLUSIONSIt is effective to use slaughterhousewaste in order to increase the efficiency<strong>of</strong> biogas stations. Stabilized residueafter anaerobic digestion was analyzedchemically and microbiologically, andits suitability for soil application wasascertained. However, processing <strong>of</strong>slaughterhouse waste in a biogas stationrequires the installation <strong>of</strong> a unit forthermal treatment <strong>of</strong> the input substrate,i.e., heating the material to 70°C for onehour.This paper has been developed as aresult <strong>of</strong> execution <strong>of</strong> Czech Ministry<strong>of</strong> Agriculture projects nos. QG 50039:‘Processing confiscated and other wasteusing the biogas process’, and QD3160: ‘Research into new technologicalprocedures for improved efficiency <strong>of</strong>agricultural and food processing wasteutilization’.REFERENCESBROUGHTEN M.J., THIELE H.J., BIRCHJ.E., COHEN A. 1998: Anaerobic batchdigestion <strong>of</strong> sheep tallow. Water Research,Vol. 32, No 5: 1423–1428.DOHÁNYOS M., ZÁBRANSKÁ J.,STRAKA F. 2003: Possibilities <strong>of</strong> safetreatment and utilization <strong>of</strong> veterinarysanitation waste. [In:] IWA – WorkshopAnaerobic digestion <strong>of</strong> slaughterhousewastes. Proceedings, NarbonneFARINET J.L., FOREST F. 2003: Agroenergeticvalorization <strong>of</strong> slaughterhousewastes in Africa. [In:] IWA – WorkshopAnaerobic digestion <strong>of</strong> slaughterhousewastes. Proceedings, Narbonne.SALMINEN E.A., RINTALA J.A. 2002:Semi-continous anaerobic digestion <strong>of</strong>solid poultry slaughterhouse waste: effect<strong>of</strong> hydraulic retention time and loading.Water Research, Vol. 36: 3175–3182.SALMINEN E.A., RINTALA J.A., LOK-SHINA L.Y., VAVILIN V.A. 2000:Anaerobic batch degradation <strong>of</strong> solidpoultry slaughterhouse waste. WaterScience and Technology, Vol. 41, No3: 33–41.STRAKA F., DOHÁNYOS M., ZÁBRAN-SKÁ J., DĚDEK J., MALIJEVSKÝ A.,NOVÁK J., ODLŘICH J. 2003: Bioplyn.GAS s.r.o., Říčany.VAVILIN V.A. 2003: Modelling <strong>of</strong> AnaerobicDegradation <strong>of</strong> Slaughterhouse Waste.[In:] IWA – Workshop Anaerobicdigestion <strong>of</strong> slaughterhouse wastes.Proceedings, Narbonne.Streszczenie: Wyniki sprawdzania procesu fermentacjianaerobowej odpadów ubojowych. Artykułzajmuje się analizą wyników sprawdzaniajednostopniowego rozpuszczania anaerobowegow warunkach ze średnimi wymaganiami odnośniewilgotności i warunkach ciepłolubnych w dwuseriach, odróżniających się okresem retencyjnym(26 i 37 dni). Zostały sprawdzone substraty, składającesię z różnych stosunków drobiowej, rozmiażdżonejmasy kostnej, ścięgien wieprzowych,gnojówki bydła wołowego i prosiąt (1:1). Stabilizowana,nieodwodniona reszta po rozpuszczeniuanaerobowym została wykorzystana jako inoculum.Wyniki sprawdzania wskazały na efektywnośćprzerabiania odpadów ubojowych w stacjachbiogazowych. Przerabianie odpadów ubojowychwymaga jednakże instalowania urządzeń do przeróbkicieplnej substratu wejściowego (podgrzaniedo 70°C przez 1 godzinę).MS. received December 2007Authors’ address:Ing. Jaroslav Kára, CSc.Česká zemědělská univerzita v Praze, TechnickáfakultaKamýcká 129, 165 21 Praha 6 – SuchdolCzech Republice-mail: jaroslav.kara@vuzt.cz
<strong>Annals</strong> <strong>of</strong> <strong>Warsaw</strong> <strong>University</strong> <strong>of</strong> <strong>Life</strong> <strong>Sciences</strong> – <strong>SGGW</strong>Agriculture No 52 (Agricultural and Forest Engineering) 2008: 103–106(Ann. <strong>Warsaw</strong> Univ. <strong>of</strong> <strong>Life</strong> Sci. – <strong>SGGW</strong>, Agricult. 52, 2008)New fermentation source in the technology <strong>of</strong> fermentednon-alcoholic beveragesELENA TSED, ZOYA BASILENKO, LIDIA KOROLEVA, ELENA LEBEDOK,IRINA IVANOVAThe Mogilev State <strong>University</strong> <strong>of</strong> Foodstuffs, Mogilev, BelarusAbstract: New fermentation source in thetechnology <strong>of</strong> fermented non-alcoholic beverages.Decoding and identification <strong>of</strong> microbecomposition <strong>of</strong> trivially called rice fungus as anew fermentation source have been studied. It hasbeen found out that Orуzamyces indici РГЦ isan associative consortium <strong>of</strong> microorganisms <strong>of</strong>various groups: Zygosaccharomyces fermentatiNaganishi, Pichia membranaefaciens Hansen,Lactobacillus paracasei subsp. рaracasei,Leuconostoc mesenteroides subsp. dextranicum,Acetobacter aceti, and it is potentially ableto bring about the fermentation processes.Technology <strong>of</strong> new fermented non-alcoholicbeverage “Klukovka” <strong>of</strong> higher biological valuehas been developed.Key words: Oryzamyces indici РГЦ , rice fungus,fermented non – alcoholic drink “Klukovka”,cranberry, microbe composition, organolepticcharacteristics, biochemical characteristics.INTRODUCTIONDevelopment <strong>of</strong> new non-alcoholic beveragesenriched with biologically activeingredients and possessing purposefullygiven properties is one <strong>of</strong> the current prioritytrends in non-alcoholic beverageproduction.Up-to-date market <strong>of</strong> the Republic<strong>of</strong> Belarus is characterized by a widevariety <strong>of</strong> non-alcoholic beverages. Unfortunately,they are mainly producedwith the use <strong>of</strong> synthetic or identical tonatural food additives – the flavouring,colouring, sweetening and conservingagents. Such beverages have simplifiedtechnology <strong>of</strong> production, longer shelfbut their biological and food value isvery dubious.At present there is much information,that a number <strong>of</strong> food additives thatare most widely used in non-alcoholicindustry (benzoic acid and its salts,citric acid, cyclamic acid and its salts)are regarded as cancerogenic substancesinfluencing a human body. They seriouslythreaten the consumer’s health [1].That is why drinking beveragescontaining harmful substances for a longperiod <strong>of</strong> time affects negatively a humanbody, and specially children, who are themain consumers <strong>of</strong> such products.In this connection, the researchworks aimed at development <strong>of</strong> naturalnon-alcoholic beverages containing noartificial food additives and enrichedwith biologically active substances <strong>of</strong>endogenous origin are very perspectiveand actual.In this case the fermented nonalcoholicbeverages <strong>of</strong> plant originand enriched with microbiologicalbiocomplex metabolites are speciallyimportant. This is caused by the fact thatquite a number <strong>of</strong> biologically activesubstances (vitamins, amino acids,organic acids, minerals) necessary for
104 E. Tsed et al.normal functioning <strong>of</strong> a human bodyare produced during the fermentationprocess; finally, it gives the higherbiological value, the treatment and theprophylactic value to the fermentedbeverages.Studies on development <strong>of</strong> new technologies<strong>of</strong> non-traditional fermentationalcohol – free beverages that possessthe treatment and prophylactic propertiesare carried out at the Mogilev State<strong>University</strong> <strong>of</strong> Foodstuffs. Therefore, theOrуzamyces indici РГЦ polyculture <strong>of</strong>microorganisms, trivially called rice fungus(Indian sea rise, Japanese rise) havebeen investigated for several years.Thus, the purpose <strong>of</strong> this investigationwas to study a new non-traditionalfermentation source and possibility <strong>of</strong>using it as a fermenting agent in theproduction <strong>of</strong> non-alcoholic fermentationbeverages.RESULTSIn appearance the rice fungus lookslike transparent jelly-like granules<strong>of</strong> various size; it resembles the ricegrains in the shape and is consideredto be a natural symbiotic polyculture <strong>of</strong>microorganisms that was formed in thecourse <strong>of</strong> evolution. The rice fungus isa widely cultivated home-made product,however, scientific investigations onthe composition and properties <strong>of</strong> thisbioculture are not available.It is only known that a home-madeinfusion on the basis <strong>of</strong> rise funguspossesses both the pleasant organolepticproperties and a whole range <strong>of</strong>treatment and prophylactic ones. Itaids in normalization <strong>of</strong> metabolicdisturbances and reduction <strong>of</strong> bloodsugar content, enhances the performanceefficiency, normalizes acidity <strong>of</strong> a gastricjuice, relieves insomnia, muscle-skeletaldiseases, rheum arthritis, stomatitis,pyelonephritis; it also possesses theantiviral, canceridical and immunestimulatingeffects [2].Microbe composition <strong>of</strong> polycultureOrуzamyces indici РГЦ has been identified;it has been found that the risefungus is an associative consortium <strong>of</strong>microorganisms belonging to varioustaxonomy groups: yeast (Zygosaccharomycesfermentati Naganishi, Pichiamembranaefaciens Hansen), lactic acidbacteria (Lactobacillus paracasei subsp.рaracasei, Leuconostoc mesenteroidessubsp. dextranicum), acetic acid bacteria(Acetobacter aceti). While examiningphysiological characteristics it has beenfound that microorganisms <strong>of</strong> symbioticassociation <strong>of</strong> polyculture Orуzamycesindici РГЦ utilize a significant amount<strong>of</strong> carbohydrates forming the plant substrates.Physiological, biochemical, andtechnological properties <strong>of</strong> this bioculturehave been studied. Metabolic properties<strong>of</strong> rice fungus have been determined.This information makes it possible tocontrol substrata fermentation processeseffectively and to obtain the product<strong>of</strong> properties given purposefully. Thebioculture <strong>of</strong> rice fungus Orуzamycesindici РГЦ has been found to be a veryprospective fermentation source inthe production <strong>of</strong> the fermented nonalcoholicbeverages [3].It has also been found that during itsvital activity the rice fungus produces awide range <strong>of</strong> substances, many <strong>of</strong> thempossessing a high biological activity
New fermentation source in the technology <strong>of</strong> fermented non-alcoholic beverages 105and being essential components formaintaining metabolism in human body.Thus, synthesis <strong>of</strong> free amino acid duringvital activity <strong>of</strong> rice fungus has beenstudied.We identified that when cultivated,the rice fungus synthesized almostall known amino acids, including 8essential ones, such as threonine, valine,methionine, leucine, lysine. Moreover,2 amino acids essential for children –arginine and histidine were determined.It is important because children areamong main consumers <strong>of</strong> non-alcoholicbeverages.Taking into account the wholecomplex <strong>of</strong> experimental data, the newproduction technology for the fermentednon-alcoholic beverage “Klukovka”,made <strong>of</strong> non-traditional fermentationsource Orуzamyces indici РГЦ withaddition <strong>of</strong> cranberry juice has beendeveloped and patented (Tab. 1).Biochemical analyses <strong>of</strong> the newbeverage showed that non-alcoholicfermentation beverage produced frompolyculture <strong>of</strong> rise fungus Orуzamycesindici РГЦ as a fermented agent andadditionally enriched with cranberry juicepossessed pleasant organoleptic propertiesand considerable biological value.This was attributed to the content<strong>of</strong> the whole range <strong>of</strong> such biologicallyactive compounds as amino acids,vitamin P, vitamin C, folic acid, reducingsubstances, etc. in beverage. They takepart in metabolism processes <strong>of</strong> humanbody (Tab. 2).In particular, reducing substances takepart in energy cell metabolism, aminonitrogen – in the synthesis <strong>of</strong> proteins<strong>of</strong> cell structure; vitamin C promotes theTABLE 1. Organoleptic characteristics <strong>of</strong> non-alcoholic drink “Klukovka”IndexAppearanceColorTasteAromaDescriptionOpaque liquid with no foreign bodies peculiar to the product. A little naturalsediment may be presentRoseSour and sweetCranberry aromaTABLE 2. Biochemical characteristics <strong>of</strong> non-alcoholic drink “Klukovka”IndexValueReducing sugars content [g/100 ml] <strong>of</strong> non-alcoholic beverage 1.8Amino acid composition [mg/100 ml],including:HistidineArginineProlineMethionineCystineLysine231.6658.8 ±11.836.8 ±7.469.3 ±13.917.4 ±3.579.0 ±15.812.2 ±2.4Vitamin P content [%] 0.98Vitamin C content [mg %] 11.00Folic acid content [m·kg/100 ml] <strong>of</strong> non-alcoholic beverage 0.15
106 E. Tsed et al.carbohydrate – protein metabolism, aidsin clotting <strong>of</strong> the blood, intensifies tissueregenerations and synthesis <strong>of</strong> steroidhormones – collagen and procollagen. Itpromotes easier iron adsorption, enhancesbody’s adaptation ability and resistance toinfection; vitamin P decreases capillarypermeability, maintains blood vesselsand makes biological effect <strong>of</strong> vitamin Cmore efficient.The folic acid takes part in regulation<strong>of</strong> cell fission process and proteinmetabolism, stimulates the immunesystem, regulates fat metabolism in live.A deficiency <strong>of</strong> folic acid mainly affectsthe hemopoietic anemia, resulting inbleeding gums, various hemorrhagesetc. The lack <strong>of</strong> folic acid is one <strong>of</strong> mostcommon deficiencies among modernpeople.Moreover, the fact that citric acid andpreservatives are not used in the recipe<strong>of</strong> non-alcoholic beverage allows toincrease not only economic efficiencydue to food product price reduction, but,first <strong>of</strong> all, to get social effects aimed atbringing the human body into a healthystate due to consumption <strong>of</strong> naturalfood products containing no exogenouschemical ingredients.Thus, production and popularization<strong>of</strong> naturally fermented non-alcoholicbeverage will permit to diversify the foodproducts with an appeal to the consumerswho take care <strong>of</strong> their health.REFERENCESCHEPURNOY I.P. 2005: Identificatsia yfalsificatsia prodovolstvennyh tovarov,M., Izdatelsko – torgovaya korporatsia“Dashkov y K o ”, 460.POLEVAYA M.A. 2005: Indiyskiy ris– tselebniy ris. Zhdorovje serdtsa ysosudov, vosstanovlenie posle infarcta,SPb. ID “Ves”, 128.TSED E.A., PRIBYLSKIY V.L.,YAKIREVICH L.M., RIDEVSKAYAL.I., KAMINSKAYA N.A. 2001: Risoviygrib-osnova bezhalcoholnyh napitkov,Pivo y Napitky, 5, 38.Streszczenie: Nowe źródło fermentacji w technologiisfermentowanego napoju bezalkoholowego.Przeprowadzono badania dekodowania i identyfikacjiskładu mikroorganizmów w grzybku ryżowymjako nowego źródła fermentacji. Stwierdzono,że Orуzamyces indici РГЦ stanowi kompleksmikroorganizmów należących do różnych grup:Zygosaccharomyces fermentati Naganishi, Pichiamembranaefaciens Hansen, Lactobacillus paracaseisubsp. рaracasei, Leuconostoc mesenteroidessubsp. dextranicum, Acetobacter aceti. Może onwywołać proces fermentacji. Opracowano technologięnowego sfermentowanego napoju bezalkoholowego“Klukovka” o wyższej wartościbiologicznej.MS. received June 2008Authors’ address:Irina IvanovaDepartment <strong>of</strong> the Automation <strong>of</strong> TechnologicalProcesses and Productione-mail: mti@mogile.byMogilev State <strong>University</strong> <strong>of</strong> Foodstuff3 Schmidt Avc.Mogilev 212027Belarys
<strong>Annals</strong> <strong>of</strong> <strong>Warsaw</strong> <strong>University</strong> <strong>of</strong> <strong>Life</strong> <strong>Sciences</strong> – <strong>SGGW</strong>Agriculture No 52 (Agricultural and Forest Engineering) 2008: 107–114(Ann. <strong>Warsaw</strong> Univ. <strong>of</strong> <strong>Life</strong> Sci. – <strong>SGGW</strong>, Agricult. 52, 2008)Agricultural business extension aided by the Case-Based ReasoningmethodTADEUSZ WAŚCIŃSKI 1 , ANNA MICHALCZYK 21 Department <strong>of</strong> Production Management and Engineering, <strong>Warsaw</strong> <strong>University</strong> <strong>of</strong> <strong>Life</strong> <strong>Sciences</strong> –<strong>SGGW</strong>, <strong>Warsaw</strong>, Poland2 Faculty <strong>of</strong> Management, <strong>University</strong> <strong>of</strong> <strong>Warsaw</strong>, <strong>Warsaw</strong>, PolandAbstract: Agricultural business extension aidedby the Case-Based Reasoning method. The paperaims at presentation <strong>of</strong> a concept <strong>of</strong> computerizedinformation system, aiding the managementwith knowledge and experience for agriculturalconsulting purposes. The Case-Based Reasoningmethod is presented as a basis for informationsystem development. Additionally, application<strong>of</strong> uncertain and approximate knowledge wasassumed.Key words: agricultural extension, knowledgemanagement, information system, artificialintelligence, Case-Based Reasoning, approximateknowledge.INTRODUCTIONAchieving a success in contemporaryagribusiness calls for knowledge,initiative, flexibility and innovation,thus, there occurs a wider demand foragricultural extension on the increasedeffectiveness and competitiveness<strong>of</strong> farms. Therefore, agriculturalextension aims at helping the farmers inundertaking correct decisions, especiallydifficult under conditions <strong>of</strong> uncertainty,when every advice can be burden withpossible errors resulting in economiclosses. The risk <strong>of</strong> errors increases if anadvisor have no appropriate knowledgeor experience in considered scope; underthis situation the agricultural extensionunit can provide the best advice byintroducing solutions from the field<strong>of</strong> knowledge management, includinginformation systems supporting decisionmaking under conditions <strong>of</strong> uncertainty.It can result in improvement <strong>of</strong> decisionmaking process, shortening <strong>of</strong> timeneeded for solving the critical problems,increasing productivity and reducingcosts [2, 12, 13, 17]. Taking the aboveinto consideration one can formulate thefollowing research thesis: Knowledgeand experience properly utilized inagricultural consulting minimizes therisk <strong>of</strong> economic failure connected withthe given advice. Verification <strong>of</strong> thisresearch thesis was attempted by creation<strong>of</strong> the information system as a toolsupporting management with knowledgeand experience <strong>of</strong> agricultural advisorin decision making process based onthe Case-Based Reasoning methodwith consideration to uncertain andapproximate knowledge.MANAGEMENT OFKNOWLEDGE AND EXPERIENCEKnowledge management is an effectiveprocess <strong>of</strong> learning connected withsearching, utilization and dissemination
108 T. Waściński, A. Michalczyk<strong>of</strong> knowledge (open and hidden one),with the use <strong>of</strong> appropriate technologiesand cultural environment in orderto increase intellectual capital andorganization efficiency [12]. Experienceis a knowledge from the past, created byproblems and their solutions, thus, as aspecific form <strong>of</strong> knowledge it is subjectedto management and can be supportedby technological factor. ExperienceManagement as a sub discipline <strong>of</strong>knowledge management belongs to thegroup <strong>of</strong> subjects investigated at presentin the world [7, 10, 11], especially inthe field <strong>of</strong> informatics and intelligentsystems, however, not separatedfrom organization and managementsciences. It deals with processes whichcontrol creation, storing, utilization andreuse <strong>of</strong> both the human and machineexperiences.In agricultural extension units theknowledge is a product. The adviceseekingfarmer expects to get advicebased not only on current knowledge,but also on the branch experience, whilethe advice-based decisions will sooneror later yield advantageous economicresults. It is expected that the advisor willuse his own open knowledge acquiredduring service and also his experienceand the connected hidden knowledge,while solving the current problems hewill remember his past experiences andthe solutions proposed in the similarsituation. If they were successful, hewould try to act similarly, if not hewould avoid them trying to proposeother solutions using his experience.The presented mechanism <strong>of</strong> experienceutilization corresponds to inference byanalogy and is based on rememberingthe past cases understood as a pair:problem – applied solution and skilfuldetermination <strong>of</strong> similarity betweenproblems.The experience exists in everyextension unit as a knowledge acquiredduring carried out activity, appliedand practically utilized. Many cases(advices) are similar to each other, thus,the previous experiences would facilitatetheir solving. Lack <strong>of</strong> experience <strong>of</strong> a newemployee can cause the financial lossesfrom wrong advice, while codification <strong>of</strong>experience and automatic mechanismsforcing its use will not only save timeneeded to solve the future problem, butalso will stabilize the unit’s operationafter quitting jobs by the experiencedadvisors. It will additionally facilitateacquiring, processing and sharing thehidden knowledge and also increasingknowledge <strong>of</strong> employees, their efficiencyand operational effectiveness [17].Management <strong>of</strong> data, information andknowledge, including management <strong>of</strong>experience in contemporary enterprisewill be practically very difficult or evenimpossible without information support.The most useful are data base systemsoriented on aiding the user in realization<strong>of</strong> decision making processes, createdwith the use <strong>of</strong> artificial intelligencemethods [12, 16]. Artificial intelligencetechniques enable to imitate the humanthinking process, aiming at solving thecurrent problem on the basis <strong>of</strong> collectedknowledge and experience. As it isevident from literature review [15], theartificial intelligence knowledge-basedsystems, especially expert systems,positively influence productivity andstaff efficiency, optimize the results <strong>of</strong>
Agricultural business extension aided by the Case-Based Reasoning method 109undertaken decisions, increase rate <strong>of</strong>work by an increase in speed <strong>of</strong> decisionmaking, and increase the experiencevolume. A decrease in efforts <strong>of</strong> problemsolving was found also, both in terms<strong>of</strong> costs and time [17]. The most usefultechnique in experience management,which imitates the mechanism forexperience utilization (thinking byanalogy) is the Case-Based Reasoningmethod (CBR) [7, 10, 11, 16].CASE-BASED REASONINGCase-Based Reasoning is an artificialintelligence method <strong>of</strong> the field <strong>of</strong>solving problems, learning and alsothe technique supporting knowledgemanagement, particularly experiencemanagement [1, 8, 9]. This method isbased on observing the expert’s thinking,reaching to the past memory for thesolutions <strong>of</strong> known problems (cases)and using these patterns during solvingcurrent problems. The case is a pair:problem and its solution, while the casebase collects experience in the form <strong>of</strong>cases, without specifying the rules takenas basis for decision making. This featuredistinguishes the system with base casefrom expert system, where knowledgeis expressed with the use <strong>of</strong> rules. Theessence <strong>of</strong> CBR is: solving the currentproblem by acceptance <strong>of</strong> solutions usedin the past [1, 8, 9], thus, it assumes thatsimilar problems have similar solutions.Imitating the human thinking, CBR ispresented as a cycle consisted <strong>of</strong> thefollowing phases (stages):• Searching (retrieving) in the casebase for the case(s) most similar toconsidered one;• Utilization (reusing) <strong>of</strong> this casesolution in solving the currentproblem;• Evaluation <strong>of</strong> usability (revising) <strong>of</strong>old solution(s) in order to match itto considered problem or adaptation(modification) <strong>of</strong> solutions;• Memorizing (retaining) <strong>of</strong> consideredproblem with applied solution as anew case (experience) for furtherutilization during solving newproblems in future.CBR is used in solving <strong>of</strong> manyproblems as: diagnostics, classification,interpretation, planning, designing,teaching, etc. It is assumed that CBRbasedsystem are used in the fieldscharacterized by: regularity, repeatability,similarity <strong>of</strong> phenomena, continuity <strong>of</strong>reality subjected to modeling. The CBRmethod and its application is investigatedat present by many researchers, seekingvarious solutions for its development [7,10, 11]. The authors think that agriculturalextension is such an area.CONCEPT OF INFORMATIONSYSTEM – RESULTS OFINVESTIGATIONSDevelopment <strong>of</strong> information systemwith CBR method application shouldinclude: case definition, selection <strong>of</strong>case representation, determination <strong>of</strong>the way for probability measurement,selection <strong>of</strong> technique for seeking out thesimilar cases and method for adaptation<strong>of</strong> solutions. To investigate CBRapplication in supporting management <strong>of</strong>knowledge and experience <strong>of</strong> employees<strong>of</strong> agricultural extension units, the
110 T. Waściński, A. Michalczykfollowing assumptions were made basingon references:Assumption 1. The authors intendto achieve the model <strong>of</strong> system in thegeneral form, thus, they passed overthe problem <strong>of</strong> case definition. The caserepresentation based on feature vector[3] was assumed in the form <strong>of</strong> structureObject-Attribute-Value. Therefore, thecase base was defined as follows:CB=< U, A, D >(1)where: U is a finite set <strong>of</strong> cases, A is anon-empty, finite set <strong>of</strong> attributes describingthe problem, D is a non-empty,finite set <strong>of</strong> attributes describing theproblem solution; for each attribute a∈A,a: U→U a , where U a is a set <strong>of</strong> values <strong>of</strong>problem description attribute a; for eachd∈D, d: U→U d , where U d is a set <strong>of</strong> values<strong>of</strong> decision attribute d.Assumption 2. Seeking out the similarcases according to nearest-neighbourretrieval method [8, 9] by browsing thebase, case after case, in order to find themost similar case.Assumption 3. Measuring similaritybetween cases is based on the concept:similarity <strong>of</strong> cases results from similaritywithin their features, propertiesdescribing the problem. Measurement <strong>of</strong>similarity was based on local similarityaccording to formula [8, 9]:∑wsim ac acsim c c a A a a ( ( ), ( '))(, ') = ∈∑ wa∈Aa(2)where A is a set <strong>of</strong> features, attributesdescribing the problem, sim a :U a xU→[0.1] is a local measure determined forattribute a∈A, U a is a set <strong>of</strong> values takenfor each a∈A, w a ≥0 is significance <strong>of</strong>attribute a∈A.It should be noted that in equation(2), the measures <strong>of</strong> local similarity sim adepend on type <strong>of</strong> values assumed withinthe feature. It is assumed additionallythat the measure <strong>of</strong> case similarity is arefl exive function (each case is similar toitself) and a symmetrical function (if casec is similar to case c’, then c’ is similarto case c), while attribute’s significanceenables to determine the effect <strong>of</strong> featureon similarity <strong>of</strong> cases. It is assumedthat local similarities and significance<strong>of</strong> attributes are known and must begiven by the system’s user or calculatedwith the use <strong>of</strong> machine learningtechniques. Analysis <strong>of</strong> referencesenables to conclude that by this methodone can compare similarity <strong>of</strong> cases <strong>of</strong>heterogeneous, mixed features, bothquantitative and qualitative, with the use<strong>of</strong> real, unprocessed data.Assumption 4. Interactive adaptation<strong>of</strong> solutions with participation <strong>of</strong> system’suser [8, 9].RESULTS OF INITIALINVESTIGATIONSThe authors’ investigations carried outtowards development <strong>of</strong> an informationsystem based on CBR at undertakenassumptions point out at some problemsin determination <strong>of</strong> local similarity bythe system’s users (equation 2), whocan much easier determine the fact <strong>of</strong>similarity between values <strong>of</strong> a givenattribute than its accurate values or thefunction (measure) taken in calculations.
Agricultural business extension aided by the Case-Based Reasoning method 111This is because a man in his everydaylife rather estimates than counts, usingan approximate knowledge (in this paperit was assumed after (4) that approximateknowledge is based on approximate databurden with error).The obtained results and conclusionspoint out at the need <strong>of</strong> supplementingthe classical measurements <strong>of</strong> similaritywith measures including uncertainand approximate knowledge. As it isevident from references [4, 5], solving<strong>of</strong> this problem can be attempted byassuming that the cases are elements<strong>of</strong> tolerance spaces, which – as specifictype <strong>of</strong> approximation spaces – allow forconvenient comparison between variousobjects’ similarities and for application<strong>of</strong> approximate knowledge.The tolerance space (TS) [4] is thetuple 1 TS ≤ U, sim, p >, where U is anon-empty set <strong>of</strong> objects, sim:UxU→[0.1] is a measure <strong>of</strong> tolerance, p is athreshold value and p∈[0.1]. Similaritymeasure is a tolerance measure if it isa reflexive and symmetrical function,thus, for each u,u ∈ U there are fulfilledconditions sim(u,u) = 1 and sim(u,u’) =sim(u’,u).The set <strong>of</strong> similar objects notdiscriminated with object u∈U, forwhich there exists:Iu ( ) = { u' ∈U; simuu ( , ') ≥ p}(3)is an environment (neighbourhood) <strong>of</strong>this object.1 Tuple – “rearranged, finite set <strong>of</strong> elements” or“rearranged set <strong>of</strong> n-elements”, sources: http://pl.wikipedia.org.wiki/Krotka <strong>of</strong> 23.03.2008, MarciniakM., Szaniawski J.: Słownik angielsko-polskidla informatyków. WNT, Warszawa 1990, p. 243.A very important feature <strong>of</strong> tolerancespace is the fact that similarity <strong>of</strong>complex structures is based on similarity<strong>of</strong> simple, elementary set <strong>of</strong> values. Itmeans that tolerance spaces determinedon elementary sets induce the tolerancespace for complex structures usedfor their development. This feature isvery important since in CBR methodin classical approach the similarity <strong>of</strong>cases results from similarity <strong>of</strong> theirproblems, and this results from similarity<strong>of</strong> comparable features describing theproblem.In carried out investigations it wasassumed that besides the case base thereis also known additionally the similarity<strong>of</strong> features <strong>of</strong> investigated problem,expressed with tolerance spaces. Then,this similarity is transferred on problemsimilarity, thus, on case similarity. Thisassumption is also taken in the systemmodel, which can be presented asfollows.Assumptions for the system.There is the base <strong>of</strong> cases CB definedaccording to equation (1) and there isalso additional knowledge on similaritywithin the problem features, expressedwith tolerance spaces TS a ≤ U a ,sim a ,p a >for each a∈A, then this similarity istransferred on similarity <strong>of</strong> cases , thus,tolerance spaces TS a determine thetolerance space above the base <strong>of</strong> casesTS CB ≤ U,sim,p>.Introduction <strong>of</strong> above assumptionto the system allows for application <strong>of</strong>object environments (equation 3), inorder to determine similarity betweencases, which can be described withequation (4):
112 T. Waściński, A. Michalczyk∑wS ac acsim c c a A a a ( ( ), ( '))(, ') = ∈(4)∑ wa∈Aawhere⎧1Sa( x, y)= ⎨⎩0dla y ∈ Ia( x)dla y ∉ Ia( x)where w a is attribute’s significance,while function S a , which determinebelonging to environments I a <strong>of</strong> attributea∈A (equation 3) allows for application<strong>of</strong> “being not discriminated” within agiven feature.It should be noted that a classicalmeasure <strong>of</strong> similarity for CBR accordingto equation (2) is a measure <strong>of</strong> toleranceand can be used in TS. Definitions <strong>of</strong>tolerance measures together with theirclassification and characteristic can befound in references [4, 14].Cycle <strong>of</strong> inference CBR TS . Undertakenassumption that CB cases are elements<strong>of</strong> the tolerance space affects notonly the measurement <strong>of</strong> similarity, butalso the cycle <strong>of</strong> inference, which wasproved in carried out experiments. Thefour-phase cycle CBR TS was obtained,with its first phase retrieving TS expandedin relation to a classical phase by possibility<strong>of</strong> searching for the cases not discriminatedwith the case being considered (itsenvironment). It enables to find quicklyexistence <strong>of</strong> precedent, in the context <strong>of</strong>cases collected in the base. In order tosearch for the new problem, an algorithm<strong>of</strong> environment retrieving is proposed forbrowsing the base, case after case, to findall cases not discriminated with the casebeing considered (for which equation 3is valid). It was assumed that the remainingCBR TS phases are compatible withphases 2, 3 and 4 <strong>of</strong> classical CBR.Model <strong>of</strong> the system. Theabove assumptions and carried outinvestigations and conclusions enableto define the information system, aidingthe management with knowledge andexperience for agricultural consultingsystem =< CB,{ TSa : a ∈ A}, TSCB, CBRTS,I >purposes, according to equation (5):(5)where CB, TS a , TS CB form the knowledgebase and are conform with undertakenassumptions <strong>of</strong> the system, while cycle<strong>of</strong> inference CBR TS is mechanism <strong>of</strong>interference and I is interface <strong>of</strong> theuser.The carried out computer experimentsproved usability <strong>of</strong> the proposedmodel <strong>of</strong> the system as a tool aidingthe management with knowledge andexperience <strong>of</strong> employees <strong>of</strong> the consultingunit. This procedure aimed at provingthat contemporary techniques and tools<strong>of</strong> s<strong>of</strong>tware engineering can fulfill therequirements <strong>of</strong> system realizationaccording to a given concept.With respect to undertaken scope<strong>of</strong> work the model was presented ina basic version and is open to furtherdevelopment. The authors think thatintroduction <strong>of</strong> tolerance space to CBR isan initial point to further considerations,e.g. to application <strong>of</strong> approximate settheory, and contributes to development<strong>of</strong> this method. This problems will besubjected to further investigations.
Agricultural business extension aided by the Case-Based Reasoning method 113REFERENCESAAMODT A., PLAZA P. 1994: Case-Based Reasoning: Foundational Issues,Methodological Variation and SystemApproaches, Artificial IntelligenceCommunications, 7(1), http://www.iiia.csic.es/People/enric/AICom.html,(7.01.2008).ADAMOWICZ M. 2006: Wiedza i jej wpływna tworzenie wartości i zarządzanie organizacją.Adamowicz M. (red.): Zarządzaniewiedzą w agrobiznesie w warunkachpolskiego członkostwa w Unii Europejskiej,Prace Naukowe KPAiM <strong>SGGW</strong> nr35, Wyd. <strong>SGGW</strong> http://kpaim.sggw.waw.pl/page.php?113, (10.03.2008)BERGMANN R., KOLODNER J., PLAZAE.: Representation in case-based reasoning,The Knowledge EngineeringReview, Vol. 00:0, 1–4, Cambridge <strong>University</strong>Press, UK, 2005. http://www.iiia.csic.es/People/enric/papers/Representation_in_CBR.pdf,(7.01.2008).DOHERTY P., ŁUKASZEWICZ W.,SZAŁAS A. 2003: Tolerance Spacesand Approximative RepresentationalStructures, Proceedings <strong>of</strong> the 26thGerman Conference on ArtificialIntelligence KI’2003, LNAI 2821,Springer-Verlag.DOHERTY P., ŁUKASZEWICZ W.,SKOWRON A., SZALAS A. 2006:Knowledge Representation Techniques.A Rough Set Approach. Studies inFuzziness and S<strong>of</strong>t Computing, vol. 202,Springer Verlag.EIRMA (European Industrial ResearchManagement Association): TheManagement <strong>of</strong> Corporate Knowledge,Summary <strong>of</strong> EIRMA Working Group 54Report, Paris (France), 1999. http://www.eirma.org, (29.11.2006).http: GWEM2005 (Third German Workshopon Experience Management), 2005. http://wm2005.iese.fraunh<strong>of</strong>er.de/workshop6-en.html, (7.01.2008).http: Case-Based Reasoning: A Review,1994. http://www.ai-cbr.org/classroom/cbr-review.html, (7.01.2008).http: Case-Based Reasoning. http://www.aaai.org/AITopics/html/casebased.html,(7.01.2008).http: FGWM2007 (Workshop Knowledgeand Experience Management).http://lwa07.informatik.uni-halle.de/fgwm07/fgwm07_en.htm, (7.01.2008).http: 2006 International Workshop onExperience Management and Engineering(EME’2006) In conjunction withKES2006. http://www.uow.edu.au/~zsun/KES-EME-2006-CFP.htm, (7.01.2008).JASHAPARA A. 2006: Zarządzanie wiedzą,PWE, Warszawa.KISIELNICKI J. 2003: Informatyka narzędziemzarządzania wiedzą. - KisielnickiJ. (red.): Informatyka narzędziem zarządzaniaw XXI wieku, PJWSTK, Warszawa.MICHALCZYK A. 2006: Miary podobieństwaw hierarchicznym grupowaniu elementówprzestrzeni tolerancji. KisielnickiJ. (red.): Informatyka w globalnymświecie, PJWSTK, Warszawa.MULAWKA J. 1996: Systemy ekspertowe,WNT, Warszawa.SUN Z., FINNIE G.; Experience Managementin Knowledge Management, 2005.http://ro.uow.edu.au/commpapers/33/,(7.01.2008).WAŚCIŃSKI T., MICHALCZYK A. 2007:Metoda Case-Based Reasoning, Ekonomikai Organizacja Przedsiębiorstwa, nr 8.Streszczenie: Doradztwo biznesu rolniczegowspierane metodą Case-Based Reasoning. Jestpróbą udowodniena tezy, iż właściwie wykorzystanawiedza i doświadczenie w konsultingurolniczym minimalizuje ryzyko niepowodzeniaekonomicznego związanego z udzielaną poradą.Próbą weryfikacji tak postawionej tezy badawczejjest propozycja stworzenia systemu informatycznegojako narzędzia wspomagającego zarządzaniewiedzą i doświadczeniem doradcy rolniczego
114 T. Waściński, A. Michalczykw procesie decyzyjnym – opartego na metodzieCase Based Reasoning z uwzględnieniem możliwościposługiwania się wiedzą niepewną i przybliżoną.W artykule omówiono zagadnienia z obszaruzarządzania wiedzą i doświadczeniem orazprzedstawiono metodę Case-Based Reasoning(CBR) jako podstawę budowy systemu informatycznego.Zaprezentowano koncepcję systemuinformatycznego opartego na metodzie CBR i założeniu,że przypadki (cases) są elementami przestrzenitolerancji co daję możliwość posługiwaniasię wiedzą niepewną i przybliżoną.Authors’ addresses:Tadeusz WaścińskiKatedra Organizacji i Zarządzania Produkcją,Wydział Inżynierii Produkcji <strong>SGGW</strong>ul. Nowoursynowska 16402-787 WarszawaAnna MichalczykKatedra InformatykiWydział Informatyki i EkonomiiWyższa Szkoła Informatyki i Ekonomii TWPul. Barczewskiego 1110-061 OlsztynMS. received June 2008