- Page 1:
World Meteorological OrganizationWW
- Page 5 and 6:
ForewordWeather disasters often ari
- Page 7 and 8:
CONFERENCE SCHEDULEThird WMO Intern
- Page 9 and 10:
Conference program for the third WM
- Page 11 and 12:
Conference program:A. High impact p
- Page 13:
B3. 13:45-15:40 Session Chair: Rich
- Page 17 and 18:
P. 19:15-20:30 19-20 Oct. 2010 Post
- Page 19 and 20:
H. Conference summaryConvener: Chun
- Page 21 and 22: Session AHigh impact Precipitation
- Page 23 and 24: 1. IntroductionSynoptic and Mesosca
- Page 25 and 26: and PS each accounting for about 20
- Page 27 and 28: ain-producing storms (Schumacher an
- Page 29 and 30: Houze, R. A., Jr., S. A. Rutledge,
- Page 31 and 32: Convection over the Taunus Mountain
- Page 33 and 34: in the southeast of the investigate
- Page 35 and 36: Spatial and Temporal Variations of
- Page 37 and 38: were normalized to sum 1 to give th
- Page 39 and 40: during the continuous one day (Rx1d
- Page 41 and 42: The Weather Research and Forecastin
- Page 43 and 44: Convective rainfall in wet runs is
- Page 45 and 46: On the Study of Tropical Cyclone Ra
- Page 47 and 48: Fig.2 Severe tropical storm Bilis (
- Page 49 and 50: Numerical simulation (Zhu H.Y, et a
- Page 51 and 52: Influence of Typhoon Songda (2004)
- Page 53 and 54: southeastern part of typhoon circul
- Page 55 and 56: the thermal structure is asymmetric
- Page 57 and 58: The estimation of TC quantitative p
- Page 59 and 60: from 0000 UTC on 8 August 2009 to 0
- Page 61 and 62: and 1.23:1 in 24h, indicates that t
- Page 63 and 64: in the latter 24-h, on average, the
- Page 65 and 66: 4. Sensitivity experiment results1)
- Page 67 and 68: ReferencesChen, L., and Y. Ding, 19
- Page 69 and 70: of the documented intensity and tra
- Page 71: Figure 1b shows the distribution of
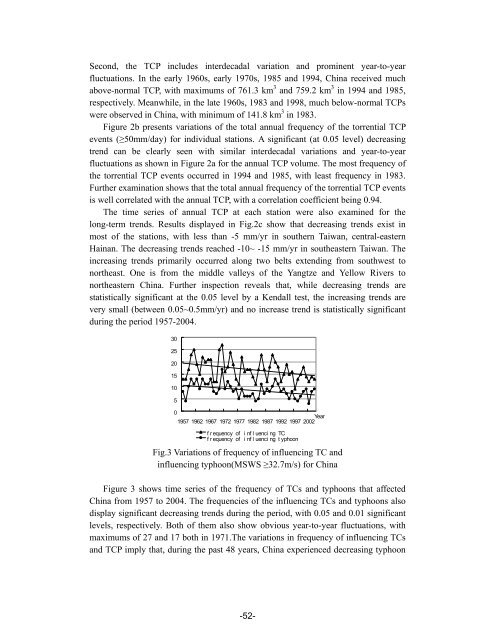
- Page 75 and 76: torrential rain days in 2009. The d
- Page 77 and 78: over China mainland for the 32 typh
- Page 79 and 80: Advances in Understanding the “Pe
- Page 81 and 82: 3. Contributions of the east-west o
- Page 83 and 84: Fig. 3. Hovmoller diagram of the ra
- Page 85 and 86: convective band over the Taiwan Str
- Page 87 and 88: The mechanism analysis of cloud and
- Page 89 and 90: The simulations were performed with
- Page 91 and 92: different sub-regions to interpret
- Page 93 and 94: An Idealized Numerical Study on the
- Page 95 and 96: The Effect of ENSO on the Summer Mo
- Page 97 and 98: Session BQuantitative Precipitation
- Page 99 and 100: Observations of Precipitation Proce
- Page 101 and 102: elevation angle. It grows and then
- Page 103 and 104: Figure 8: Outflow (above) and inflo
- Page 105 and 106: Figure 10: Model forecasts of vario
- Page 107 and 108: ReferencesPaul Joe, Chris Doyle, Al
- Page 109 and 110: produce the ‘predicted’ analysi
- Page 111 and 112: asis. First, co-located daily CMORP
- Page 113 and 114: used in this paper were obtained fr
- Page 115 and 116: with thresholds of 0.1mm (including
- Page 117 and 118: The Megha-Tropiques accumulated rai
- Page 119 and 120: Figure 1 shows the flow chart of th
- Page 121 and 122: Over the Ouémé site, the evolutio
- Page 123 and 124:
Starting from June 15 , 2 001, t he
- Page 125 and 126:
5. Year and Season-wise Comparison
- Page 127 and 128:
QPE and QPF of Japan Meteorological
- Page 129 and 130:
By multiply ing calibrated echo int
- Page 131 and 132:
4.3 ACCURACY OF VSRFCritical Succes
- Page 133 and 134:
Verification of Tropical Cyclones-R
- Page 135 and 136:
To co mpare t he ab ilities of 3B 4
- Page 137 and 138:
AllcasesLandfallTCsTable 3. TS, ETS
- Page 139 and 140:
The representation of the rain gaug
- Page 141 and 142:
3 Results16Percentage(%)14121086200
- Page 143 and 144:
403530Related Error(%)25201510504 C
- Page 145 and 146:
Recent Progresseson TC Precipitatio
- Page 147 and 148:
fields, particularly taking account
- Page 149 and 150:
form. The initial conditions of ens
- Page 151 and 152:
Comparative Study on QPE Methods of
- Page 153 and 154:
B3.2possible rain states that could
- Page 155 and 156:
B3.4Figure 2: Spatial temporal samp
- Page 157 and 158:
A Radar-based Technique for the Ide
- Page 159 and 160:
et al. (2007), the HEM obtained exa
- Page 161 and 162:
these calibration algorithms.7. Con
- Page 163 and 164:
CINRAD Warning Indexof Local Extrem
- Page 165 and 166:
Research of Rainfall Estimation usi
- Page 167 and 168:
Figure 1 has shown the relationship
- Page 169 and 170:
4. Summary and discussion(1) T he T
- Page 171 and 172:
Session CHydrologic prediction and
- Page 173 and 174:
Hydrological Perspective on QPE/QPF
- Page 175 and 176:
the river system in the basin. The
- Page 177 and 178:
(2) As input of the hydrological di
- Page 179 and 180:
satellite estimates) and the foreca
- Page 181 and 182:
NWP models’ Application in Flood
- Page 183 and 184:
Deltares’ Flood Early Warning Sys
- Page 185 and 186:
A further challenge for hydrologic
- Page 187 and 188:
2.2 Test areaHuaihe Basin locates i
- Page 189 and 190:
Fig. 4 The same as Fig.3, but at Wa
- Page 191 and 192:
Third WMO International Conference
- Page 193 and 194:
There is a unimodal pattern in the
- Page 195 and 196:
Number of days with 1mm and above95
- Page 197 and 198:
homogeneous (Fig. 1). Thi s area is
- Page 199 and 200:
a, without precipitation in future
- Page 201 and 202:
Session DVerification of Precipitat
- Page 203 and 204:
Intercomparison of verification met
- Page 205 and 206:
intensity f or pr e- and pos t-defo
- Page 207 and 208:
Figure 1: From Gilleland et al. (20
- Page 209 and 210:
New Model Evaluation Tools (MET) So
- Page 211 and 212:
During the HWT project, precipitati
- Page 213 and 214:
Figure 4: Example showing atmospher
- Page 215 and 216:
Performance Evaluation of the AREM
- Page 217 and 218:
0-24h and 24-48h, the improved mode
- Page 219 and 220:
Fig.4 24h accumulative precipitatio
- Page 221 and 222:
simple upscaling technique whereby
- Page 223 and 224:
(panel c) and 20mm/24h (panel d) fo
- Page 225 and 226:
A new field verification score base
- Page 227 and 228:
still overlapping the observed feat
- Page 229 and 230:
Case Description of forecast featur
- Page 231 and 232:
Quantitative Precipitation Forecast
- Page 233 and 234:
GFS60 and NAM60 at the lowest thres
- Page 235 and 236:
difference between the two models i
- Page 237 and 238:
Scale-related Issues involving veri
- Page 239 and 240:
of scores for the GFS at heavier ra
- Page 241 and 242:
Fig. 4. Comparison of probability o
- Page 243 and 244:
From these equations one can see th
- Page 245 and 246:
Figure 2. Verification scores as a
- Page 247 and 248:
Session EData assimilation for prec
- Page 249 and 250:
Progress in data assimilation for N
- Page 251 and 252:
Here, k is the number of ensemble m
- Page 253 and 254:
0200pressure (hPa)400600800spread a
- Page 255 and 256:
Impacts of multiple radar data assi
- Page 257 and 258:
High Resolution Radar Accumulation
- Page 259 and 260:
3. MethodThe non-hydrostatic versio
- Page 261 and 262:
Figure 5: Accumulation in the Waipa
- Page 263 and 264:
J(X ) Jb Jo Jc1 T 1T X X ) B ( X
- Page 265 and 266:
prediction, and so forth, to observ
- Page 267 and 268:
experiment, velocity assimilated ex
- Page 269 and 270:
Cycle Forecasting System in China.
- Page 271 and 272:
successfully forecast by AREM-RUC a
- Page 273 and 274:
Session FPrecipitation variability
- Page 275 and 276:
FRepresentation of Monsoon Systems
- Page 277 and 278:
4 ResultsFigure 2: Monsoon mean pre
- Page 279 and 280:
explained by higher sea surface tem
- Page 281 and 282:
Variability of Rainfall, Increasing
- Page 283 and 284:
(a)(b)Figure 1 : (a) Change of Temp
- Page 285 and 286:
According the analy sis of rainfall
- Page 287 and 288:
the rainfall v ariability will high
- Page 289 and 290:
Regional Impact of Climate Change i
- Page 291 and 292:
Figure 2. Map of the classified wea
- Page 293 and 294:
Table 3. The num ber of weather st
- Page 295 and 296:
such a mo del. Second, we ha ve o b
- Page 297 and 298:
Joint fuzzy an alysis o f SST , SAT
- Page 299 and 300:
Variability of Equatorial East Afri
- Page 301 and 302:
(d)2.5 4.0 5.5(c)-10 0 10(b)-10 0 5
- Page 303 and 304:
Figure 4: (a) The first spatial mod
- Page 305 and 306:
Session GQuantitative Precipitation
- Page 307 and 308:
Ongoing developments on Limited Are
- Page 309 and 310:
een done but much i s s till needed
- Page 311 and 312:
Hacker, J., S.-Y. Ha, C. Sn yder, J
- Page 313 and 314:
the initial field as possible based
- Page 315 and 316:
One advantage of ensemble forecasti
- Page 317 and 318:
southern hemisphere through the equ
- Page 319 and 320:
model results predict rate moves in
- Page 321 and 322:
Term growth forecast s, th e error
- Page 323 and 324:
ponent of the Brier score is reduce
- Page 325 and 326:
in the combined field (Fig.3c). For
- Page 327 and 328:
Probabilistic QPF from a realtime m
- Page 329 and 330:
to help assessing impacts from diff
- Page 331 and 332:
abFigure 3.ETS scores of the 3-h ac
- Page 333 and 334:
Flow chart of multi-model rainfall
- Page 335 and 336:
GermanJapan NCEP Ens Forecaster(a)E
- Page 337 and 338:
methodology. However, the operation
- Page 339 and 340:
Research and Operation on Quantitat
- Page 341 and 342:
A numerical study of aerosol effect
- Page 343 and 344:
maximum cloud water mixing ratio in
- Page 345 and 346:
an increase in concentration of clo
- Page 347 and 348:
perturbations. Blending combines th
- Page 349 and 350:
Figure 2. Comparison of CRPSSof 12h
- Page 351 and 352:
Global QPF and QPE: Where do we hav
- Page 353 and 354:
countries, the 1 o 1 o GPCC rainfa
- Page 355 and 356:
determine the origin of these diffe
- Page 357 and 358:
Fig. 2: The global distribution of
- Page 359 and 360:
Fig. 4: Scatter plots showing the c
- Page 361 and 362:
Multiscale Spectral Structures of T
- Page 363 and 364:
mountain ridges and are anticipated
- Page 365 and 366:
triggered convection conditions pre
- Page 367 and 368:
Rainfall forecasts from the Met Off
- Page 369 and 370:
Figure 2: (a) Domain-averaged rainf
- Page 371 and 372:
4. Summary and discussionWe have de
- Page 373 and 374:
G3itself it is incapable of providi
- Page 375 and 376:
G3Precipitation for February 2nd, 2
- Page 377 and 378:
Can Multi-model ensemble forecasts
- Page 379 and 380:
amounts over thresholds, 1, 3, 5, 1
- Page 381 and 382:
In addition to combination of all t
- Page 383 and 384:
-Carry out the verification for oth
- Page 385 and 386:
How sensitive are probabilistic pre
- Page 387 and 388:
CMORPH (Climate Prediction Center M
- Page 389 and 390:
Among the alternatives that have be
- Page 391 and 392:
Based on the daily mean temperature
- Page 393 and 394:
the individual models and the EMN t
- Page 395 and 396:
The Development of Ensemble Predict
- Page 397 and 398:
70(a)70(b)60AREM-SY AREM-CTL AREM-E
- Page 399 and 400:
Poster Presentations-379-
- Page 401 and 402:
Coupling Ensemble weather predictio
- Page 403 and 404:
sub-catchments to be used as inputs
- Page 405 and 406:
This work was supported by the Rese
- Page 407 and 408:
3. DataFor the investigation the we
- Page 409 and 410:
Flash flood forecasting by coupling
- Page 411 and 412:
gauges. Fig. 1 shows the event accu
- Page 413 and 414:
The floods were sim ulated with bot
- Page 415 and 416:
Comparison of calibration technique
- Page 417 and 418:
10.10.010.00110.10.010.0010 0.2 0.4
- Page 419 and 420:
24-h rainfall forecast. Nevertheles
- Page 421 and 422:
ANALYSIS FOR TURBULENCE AND WIND GU
- Page 423 and 424:
Research and Application of Typhoon
- Page 425 and 426:
[3] TIAN H, MA K Y,LIN Z S. Analysi
- Page 427 and 428:
What’s more, th e tw o curves als
- Page 429 and 430:
precipitation in southern areas of
- Page 431 and 432:
Chen Huai, Wang Yongbo, Shi N eng,
- Page 433 and 434:
An hourly updated convection-allowi
- Page 435 and 436:
GFS dataset or any other reason, th
- Page 437 and 438:
Downscaling precipitation for weath
- Page 439 and 440:
abFig.2. The 24h accumulated precip
- Page 441 and 442:
A Kalman Filter based QPF calibrati
- Page 443 and 444:
Scale Parameter10090807060504030rai
- Page 445 and 446:
It is clear that the values of scal
- Page 447 and 448:
THE IMPACT OF NORTH PACIFIC SUBTROP
- Page 449 and 450:
negative in the northern hemisphere
- Page 451 and 452:
Establishment and Verification of M
- Page 453 and 454:
Multi-model Ensemble QPF for Southe
- Page 455 and 456:
(4)andcan be estimated for all mode
- Page 457 and 458:
Table 4 The number of observations
- Page 459 and 460:
gauge coverage is definitely not sa
- Page 461 and 462:
It would be an attractive result if
- Page 463 and 464:
Analysis on a permanent elongate co
- Page 465 and 466:
PECS grow. The evolution of meso-sc
- Page 467 and 468:
3 rd Conference on QPE /QPF an
- Page 469 and 470:
3 rd Conference on QPE /QPF an
- Page 471 and 472:
3 rd Conference on QPE /QPF an
- Page 473 and 474:
3 rd Conference on QPE /QPF an
- Page 475 and 476:
QPF verification using object-orien
- Page 477 and 478:
measure the S and A components resp
- Page 479 and 480:
5. ConclusionsSeveral problems aris
- Page 481 and 482:
2.1 MethodologyIn the EOF analysis,
- Page 483 and 484:
calculated respectively, the compar
- Page 485 and 486:
IntroductionProbabilistic predictio
- Page 487 and 488:
Once the models are obtained, they
- Page 489 and 490:
REFERENCES- Charles Mutai: 2000, Di
- Page 491 and 492:
This paper selects the process of w
- Page 493 and 494:
(b1)cntl (b2)snd (b3)cmwFig.5the cl
- Page 495 and 496:
(2) There is no much difference in
- Page 497 and 498:
Analysis of Convective Precipitatio
- Page 499 and 500:
F(per/6min)30025020015010050F(per/6
- Page 501 and 502:
Research on the Relationship betwee
- Page 503 and 504:
Fig.1 The k-Z relationship for smal
- Page 505 and 506:
esearch on the correction for atten
- Page 507 and 508:
22224diction of the heavy precipita
- Page 509 and 510:
Study on Mechanism of an Extra Rain
- Page 511 and 512:
which promoted the shear line devel
- Page 513 and 514:
References[1] SUN Shu-Qing and ZHOU
- Page 515 and 516:
the main p oints in our estimation
- Page 517 and 518:
QC test to reject the bogus faulty
- Page 519 and 520:
-499-
- Page 521 and 522:
The Impact of Parameterization of C
- Page 523 and 524:
LinThompsonMilbrandt-YauMorrisonFig
- Page 525 and 526:
MOST (Grant No. GYHY20070 6036), th
- Page 527 and 528:
National Meteorological Center (NMC
- Page 529 and 530:
Fig. 4 Comparison of percentile are
- Page 531 and 532:
Impact of Different Boundary Layer
- Page 533 and 534:
(a)observed rainfall,(b)simulated r
- Page 535 and 536:
In te rms of ener getics, the hea v
- Page 537 and 538:
The Estimation of Rainstorm Forecas
- Page 539 and 540:
Fig. 2 TS Score of accumulated 24h
- Page 541 and 542:
Study on the 3D Structure of Typhoo
- Page 543 and 544:
abFig.1 (a) Total precipitation (mm
- Page 545 and 546:
satellite images at 12:00BST on 18