

confidence - Investing In Africa
confidence - Investing In Africa
confidence - Investing In Africa

Create successful ePaper yourself
Turn your PDF publications into a flip-book with our unique Google optimized e-Paper software.
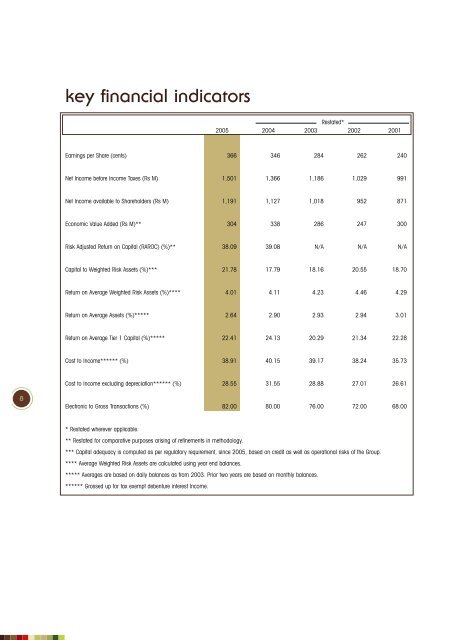
key financial indicatorsRestated*2005 2004 2003 2002 2001Earnings per Share (cents) 366 346 284 262 240Net <strong>In</strong>come before <strong>In</strong>come Taxes (Rs M) 1,501 1,366 1,186 1,029 991Net <strong>In</strong>come available to Shareholders (Rs M) 1,191 1,127 1,018 952 871Economic Value Added (Rs M)** 304 338 286 247 300Risk Adjusted Return on Capital (RAROC) (%)** 38.09 39.08 N/A N/A N/ACapital to Weighted Risk Assets (%)*** 21.78 17.79 18.16 20.55 18.70Return on Average Weighted Risk Assets (%)**** 4.01 4.11 4.23 4.46 4.29Return on Average Assets (%)***** 2.64 2.90 2.93 2.94 3.01Return on Average Tier 1 Capital (%)***** 22.41 24.13 20.29 21.34 22.28Cost to <strong>In</strong>come****** (%) 38.91 40.15 39.17 38.24 35.73Cost to <strong>In</strong>come excluding depreciation****** (%) 28.55 31.55 28.88 27.01 26.618Electronic to Gross Transactions (%) 82.00 80.00 76.00 72.00 68.00* Restated wherever applicable.** Restated for comparative purposes arising of refinements in methodology.*** Capital adequacy is computed as per regulatory requirement, since 2005, based on credit as well as operational risks of the Group.**** Average Weighted Risk Assets are calculated using year end balances.***** Averages are based on daily balances as from 2003. Prior two years are based on monthly balances.****** Grossed up for tax exempt debenture interest <strong>In</strong>come.


