

confidence - Investing In Africa
confidence - Investing In Africa
confidence - Investing In Africa

Create successful ePaper yourself
Turn your PDF publications into a flip-book with our unique Google optimized e-Paper software.
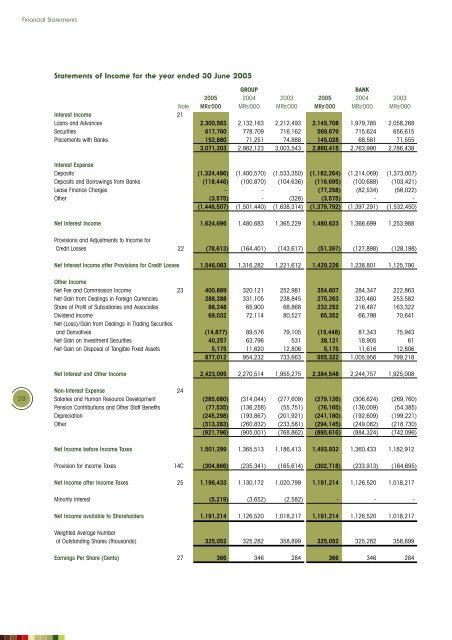
Financial StatementsStatements of <strong>In</strong>come for the year ended 30 June 2005GROUPBANK2005 2004 2003 2005 2004 2003Note MRs'000 MRs'000 MRs'000 MRs'000 MRs'000 MRs'000<strong>In</strong>terest <strong>In</strong>come 21Loans and Advances 2,300,563 2,132,163 2,212,493 2,145,708 1,979,785 2,058,268Securities 617,760 778,709 716,162 569,679 715,624 656,615Placements with Banks 152,880 71,251 74,888 145,028 68,581 71,5553,071,203 2,982,123 3,003,543 2,860,415 2,763,990 2,786,438<strong>In</strong>terest ExpenseDeposits (1,324,486) (1,400,570) (1,533,350) (1,182,264) (1,214,069) (1,373,007)Deposits and Borrowings from Banks (118,446) (100,870) (104,636) (116,695) (100,688) (103,421)Lease Finance Charges -- -- -- (77,258) (82,534) (56,022)Other (3,575) -- (328) (3,575) -- --(1,446,507) (1,501,440) (1,638,314) (1,379,792) (1,397,291) (1,532,450)Net <strong>In</strong>terest <strong>In</strong>come 1,624,696 1,480,683 1,365,229 1,480,623 1,366,699 1,253,988Provisions and Adjustments to <strong>In</strong>come forCredit Losses 22 (78,613) (164,401) (143,617) (51,397) (127,898) (128,198)Net <strong>In</strong>terest <strong>In</strong>come after Provisions for Credit Losses 1,546,083 1,316,282 1,221,612 1,429,226 1,238,801 1,125,790Other <strong>In</strong>comeNet Fee and Commission <strong>In</strong>come 23 400,889 320,121 252,981 354,607 284,347 222,863Net Gain from Dealings in Foreign Currencies 288,288 331,105 238,845 275,263 320,460 253,582Share of Profit of Subsidiaries and Associates 88,248 65,900 68,868 232,252 216,487 163,322Dividend <strong>In</strong>come 69,032 72,114 80,527 65,352 66,798 70,641Net (Loss)/Gain from Dealings in Trading Securitiesand Derivatives (14,877) 89,576 79,105 (15,448) 87,343 75,943Net Gain on <strong>In</strong>vestment Securities 40,257 63,796 531 38,121 18,905 61Net Gain on Disposal of Tangible Fixed Assets 5,175 11,620 12,806 5,175 11,616 12,806877,012 954,232 733,663 955,322 1,005,956 799,218Net <strong>In</strong>terest and Other <strong>In</strong>come 2,423,095 2,270,514 1,955,275 2,384,548 2,244,757 1,925,00828Non-<strong>In</strong>terest Expense 24Salaries and Human Resource Development (285,680) (314,044) (277,609) (279,126) (306,624) (269,760)Pension Contributions and Other Staff Benefits (77,535) (136,258) (55,751) (76,165) (136,009) (54,385)Depreciation (245,298) (193,867) (201,921) (241,180) (192,609) (199,221)Other (313,283) (260,832) (233,581) (294,145) (249,082) (218,730)(921,796) (905,001) (768,862) (890,616) (884,324) (742,096)Net <strong>In</strong>come before <strong>In</strong>come Taxes 1,501,299 1,365,513 1,186,413 1,493,932 1,360,433 1,182,912Provision for <strong>In</strong>come Taxes 14C (304,866) (235,341) (165,614) (302,718) (233,913) (164,695)Net <strong>In</strong>come after <strong>In</strong>come Taxes 25 1,196,433 1,130,172 1,020,799 1,191,214 1,126,520 1,018,217Minority <strong>In</strong>terest (5,219) (3,652) (2,582) -- -- --Net <strong>In</strong>come available to Shareholders 1,191,214 1,126,520 1,018,217 1,191,214 1,126,520 1,018,217Weighted Average Numberof Outstanding Shares (thousands) 325,052 325,282 358,899 325,052 325,282 358,899Earnings Per Share (Cents) 27 366 346 284 366 346 284


