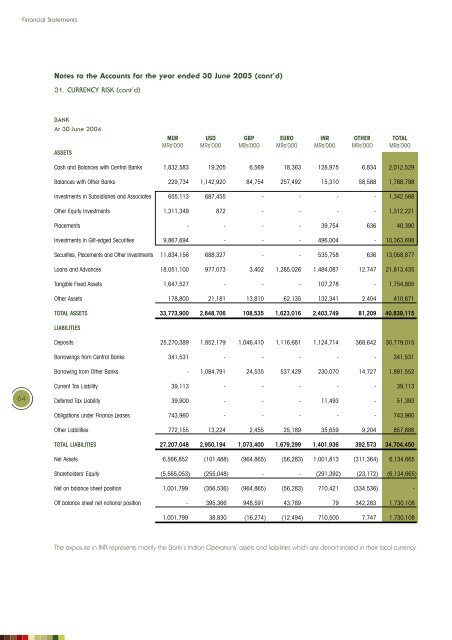
Financial StatementsNotes to the Accounts for the year ended 30 June 2005 (cont’d)31. CURRENCY RISK (cont’d)BANKAt 30 June 2004ASSETSMUR USD GBP EURO INR OTHER TOTALMRs’000 MRs’000 MRs’000 MRs’000 MRs’000 MRs’000 MRs’000Cash and Balances with Central Banks 1,832,583 19,205 6,569 18,363 128,975 6,834 2,012,529Balances with Other Banks 229,734 1,142,920 84,754 257,492 15,310 58,588 1,788,798<strong>In</strong>vestments in Subsidiaries and Associates 655,113 687,455 - - - - 1,342,568Other Equity <strong>In</strong>vestments 1,311,349 872 - - - - 1,312,221Placements - - - - 39,754 636 40,390<strong>In</strong>vestments in Gilt-edged Securities 9,867,694 - - - 496,004 - 10,363,698Securities, Placements and Other <strong>In</strong>vestments 11,834,156 688,327 - - 535,758 636 13,058,877Loans and Advances 18,051,100 977,073 3,402 1,285,026 1,484,087 12,747 21,813,435Tangible Fixed Assets 1,647,527 - - - 107,278 - 1,754,805Other Assets 178,800 21,181 13,810 62,135 132,341 2,404 410,671TOTAL ASSETS 33,773,900 2,848,706 108,535 1,623,016 2,403,749 81,209 40,839,115LIABILITIESDeposits 25,270,389 1,852,179 1,046,410 1,116,681 1,124,714 368,642 30,779,015Borrowings from Central Banks 341,531 - - - - - 341,531Borrowing from Other Banks - 1,084,791 24,535 537,429 230,070 14,727 1,891,552Current Tax Liability 39,113 - - - - - 39,11364Deferred Tax Liability 39,900 - - - 11,493 - 51,393Obligations under Finance Leases 743,960 - - - - - 743,960Other Liabilities 772,155 13,224 2,455 25,189 35,659 9,204 857,886TOTAL LIABILITIES 27,207,048 2,950,194 1,073,400 1,679,299 1,401,936 392,573 34,704,450Net Assets 6,566,852) (101,488) (964,865) (56,283) 1,001,813) (311,364) 6,134,665)Shareholders' Equity (5,565,053) (255,048) -) -) (291,392) (23,172) (6,134,665)Net on balance sheet position 1,001,799) (356,536) (964,865) (56,283) 710,421) (334,536) -)Off balance sheet net notional position -) 395,366) 948,591) 43,789) 79) 342,283) 1,730,108)1,001,799) 38,830) (16,274) (12,494) 710,500) 7,747) 1,730,108)The exposure in INR represents mainly the Bank’s <strong>In</strong>dian Operations’ assets and liabilities which are denominated in their local currency.
Financial StatementsNotes to the Accounts for the year ended 30 June 2005 (cont’d)32. INTEREST RATE RISKThe table below analyses the Group’s and Bank’s interest rate risk exposure at 30 June 2005 and 30 June 2004 in terms of theremaining period to the next contractual repricing date or to the maturity date, whichever is the earlier.The floating rate column represents the financial assets and liabilities which have floating rates of interest that do not reprice atset dates, but rather reprice whenever the underlying interest rate index changes.GROUPAt 30 June 2005ASSETSWithin 3 3-6 6-12 1-2 2-5 Over 5 Non-interestFloating Months Months Months Years Years Years Sensitive TotalMRs’000 MRs’000 MRs’000 MRs’000 MRs’000 MRs’000 MRs’000 MRs’000 MRs’000Cash and Balances with Central Banks - -) -) - - - - 1,894,720) 1,894,720Balances with Other Banks 4,064,594 1,880,466) -) - - - - 433,362) 6,378,422Equity <strong>In</strong>vestments in Subsidiariesand Associates - -) -) - - - - 666,502) 666,502)Other Equity <strong>In</strong>vestments - -) -) - - - - 1,652,948) 1,652,948)Placements - -) 466,261) - - - - -) 466,261)Loan to Associates - -) -) - - - - 9,263) 9,263)<strong>In</strong>vestments in Gilt-edged Securities - 1,211,023) 1,150,408) 4,540,203 1,914,692 280,000 301,106 -) 9,397,432)Securities, Placements and Other <strong>In</strong>vestments - 1,211,023) 1,616,669) 4,540,203 1,914,692 280,000 301,106 2,328,713) 12,192,406)Loans and Advances 20,384,299 2,797,118) 342,945) 454,642 369,592 413,699 274,865 90,921) 25,128,081)Less: Allowance for Credit Losses - -) -) - - - - (626,505) (626,505)Tangible Fixed Assets - -) -) - - - - 2,993,990) 2,993,990)Other Assets - -) -) - - - - 645,926) 645,926)TOTAL ASSETS 24,448,893 5,888,607) 1,959,614) 4,994,845 2,284,284 693,699 575,971 7,761,127) 48,607,040)LIABILITIES & SHAREHOLDERS’ EQUITY65Deposits 24,069,255 4,017,495) 1,344,445) 1,505,377 651,588 158,684 187 3,253,776) 35,000,807)Borrowings from Central Banks - 37,786) 30,148) 61,762 67,809 50,324 - -) 247,829)Borrowings from Other Banks - 2,765,600) 518,084) - - - - -) 3,283,684)Other Borrowings - 67,686) -) - - - - 11) 67,697)Current Tax Liability - -) -) - - - - 185,088) 185,088)Deferred Tax Liability - -) -) - - - - 483,324) 483,324)Other Liabilities - -) -) - - - - 1,134,782) 1,134,782)Shareholders' Equity and Minority <strong>In</strong>terest - - - - - - - 8,203,829) 8,203,829)TOTAL LIABILITIES & SHAREHOLDERS’ EQUITY 24,069,255 6,888,567) 1,892,677) 1,567,139 719,397 209,008 187 13,260,810) 48,607,040)<strong>In</strong>terest Rate Repricing Gap 379,638 (999,960) 66,937) 3,427,706 1,564,887 484,691 575,784 (5,499,683)Cumulative <strong>In</strong>terest Rate Repricing Gap 379,638 (620,322) (553,385) 2,874,321 4,439,208 4,923,899 5,499,683 -)