NATIONAL COMMUNITY PHARMACISTS ASSOCIATION
NATIONAL COMMUNITY PHARMACISTS ASSOCIATION
NATIONAL COMMUNITY PHARMACISTS ASSOCIATION
- No tags were found...

Create successful ePaper yourself
Turn your PDF publications into a flip-book with our unique Google optimized e-Paper software.
National Community Pharmacists AssociationFINANCIALS
2009 NCPA Digestsponsored by cardinal healthMember EditionProject EditorDonna West-Strum, RPh, PhDAssociate Professor, Department of Pharmacy AdministrationThe University of MississippiOxford, MississippiProject Director and Financial EditorDevin Stone, MAHealth Care EconomistNational Community Pharmacists AssociationAlexandria, VirginiaCreativeEnjua ClaudeSenior Director, CreativeSarah DiabSenior DesignerContributorsChris LinvilleDirector and Managing Editor, America’s PharmacistNational Community Pharmacists AssociationAlexandria, VirginiaBryan Ziegler, PharmD, MBAAssistant Dean and Clinical Assistant ProfessorSouth Carolina College of PharmacyColumbia, South CarolinaAmod AthavaleGraduate Student, Department of Pharmacy AdministrationThe University of MississippiOxford, MississippiCopyright © 2009 National Community Pharmacists Association (NCPA ® ), Alexandria, VA, USA.All Rights Reserved. No right of reproduction without the prior written consent of NCPA.
[October 2009]Dear Valued NCPA Member:We are pleased to present you with the complete financial information of the 2009 NCPA Digest, sponsored by CardinalHealth. In today’s pharmacy environment, it is more important than ever that you take an in-depth look at yourpharmacy’s financial picture against national pharmacy averages to come up with a real-world strategy for yourpharmacy’s future. Outlined here is an approach to assist you in successfully integrating the key Digest findings into anaction plan for your pharmacy.Step 1:Use your financial statements to assess your present situation and identify any significant trends. If you participated in thesurvey, then you will receive a free benchmarking analysis from NCPA using the data you submitted.Step 2:Compare your company’s current status to:• Your own past performance (prior years’ financial statements)• Ratios for the Top 25 percent (Tables 2–4)• Ratios for “All Pharmacies” (Tables 2–4)• Ratios for pharmacies in your sales category (Tables 5–7)Step 3:Identify the strengths and weaknesses of your company and identify possible causes for the problems. Refer to the Guideto Benchmarking available only to NCPA members at www.ncpanet.org/members/digest.php.Step 4:Set goals for the year and develop a written action plan for achieving better results.Step 5:Implement plan and monitor its progress. Review the plan monthly and evaluate its performance and focus on additionalareas that may require improvement. Revise the plan periodically if necessary.Step 6:Repeat the entire process, making corrections and adjustments for the differences between actual results and measurablegoals. Financial management is an ongoing process, not a short-term project.Step 7:Work with your fellow pharmacists, your internal management team, professional accountant, and outside businessadvisers to gain the most from their expertise and this process.We know that you will find the information contained in these pages useful for your pharmacy. For more informationabout NCPA’s various management offerings, including continuing education seminars, publications, and web resources,visit NCPA’s website at www.ncpanet.org or contact the NCPA Management Institute at 800-544-7447.
2009 NCPA Digestsponsored by cardinal healthTable of Contents6 Executive Summary9 Methodology10 Operating Results19 Sales Volume Summary25 Cost of Dispensing27 Third-Party Prescriptions34 Geographic Summary38 Rural versus Metropolitan Locations41 Overview of Financial Statements and Performance Measures
Figures1. Average annual sales (in thousands) per pharmacy location, 10-year trend • 72. Cost of Dispensing—By Geographical Region • 253. Third-Party Prescription Activity—Five-Year Trend • 27Tables1. Averages of pharmacy operations, 10-year trend • 72. 2008 Common-Sized (Average) Income Statement, Percentage of Total Sales • 163. 2008 Median Financial Benchmarks • 174. 2008 Common-Sized (Average) Balance Sheet, Percentage of Total Assets • 185. 2008 Common-Sized (Average) Income Statement, Percentage of Total Sales—By Sales Volume • 226. 2008 Median Financial Benchmarks—By Sales Volume • 237. 2008 Common-Sized (Average) Balance Sheet, Percentage of Total Assets—By Sales Volume • 248. Summary of Third-Party Prescription Activity • 279. 2008 Common-Sized (Average) Income Statement, Percentage of Total Sales—By Third-Party Prescription Activity • 2810. 2008 Median Financial Benchmarks—By Third-Party Prescription Activity • 2911. 2008 Common-Sized (Average) Balance Sheet, Percentage of Total Assets—By Third-Party Prescription Activity • 3012. 2008 Common-Sized (Average) Income Statement, Percentage of Total Sales—Portion of Prescriptions Covered by Medicare Part D • 3113. 2008 Median Financial Benchmarks—Portion of Prescriptions Covered by Medicare Part D • 3214. 2008 Common-Sized (Average) Balance Sheet, Percentage of Total Assets—Portion of Prescriptions Covered by Medicare Part D • 3315. 2008 Common-Sized (Average) Income Statement, Percentage of Total Sales—By Geographic Region • 3516. 2008 Median Financial Benchmarks—By Geographic Region • 3617. 2008 Common-Sized (Average) Balance Sheet, Percentage of Total Assets—By Geographic Region • 3718. 2008 Common-Sized (Average) Income Statement, Percentage of Total Sales—Metropolitan vs. Rural • 3819. 2008 Median Financial Benchmarks—Metropolitan vs. Rural • 3920. 2008 Common-Sized (Average) Balance Sheet, Percentage of Total Assets—Metropolitan vs. Rural • 40Table of Contents
Executive SummaryThe 2009 NCPA Digest, sponsored by Cardinal Healthprovides an annual overview of independent communitypharmacy, including a comprehensive review of the financialoperations of the nation’s independent community pharmaciesfor 2008.Independent community pharmacies are all pharmacistowned,privately held businesses but vary in practice setting.They include not only single-store operations butother independent community pharmacist-owned operationssuch as chain, franchise, compounding, long-termcare (LTC), specialty, and supermarket pharmacies. In2008, 14 percent of participating pharmacies had total salesover $6.5 million, 31 percent with sales between $3.5 and$6.5 million, 24 percent with sales between $2.5 and $3.5million, and 31 percent with sales under $2.5 million.Breakdown by Volume of SalesIndependent Community Pharmacy At-A-GlanceAverage number of pharmacies inwhich each independent owner hasownership20081.46Value of inventory as cost and as a percentage of salesPrescription inventory $242,621 6.3%Other inventory $39,963 1.0%Total inventory $282,584 7.3%Annual rate of inventory turnover 10.4Annual rate of prescriptioninventory turnover11.7Median sales per square footPrescription sales per square foot $3,732Other sales per square foot $85Total sales per square foot $1,161Number of prescriptions dispensed per pharmacy locationNew prescriptions 28,412 46%Renewed prescriptions 33,967 54%Total prescriptions 62,379 100%Average prescription charge $58.02In 2008 independent community pharmacy represented an$88 billion marketplace, with 93 percent of sales for independentsderived from prescription drugs. Although manyindependents continue to face slim margins from privatethird-party contracts and government reimbursementprograms, independents have strived to reduce their overheadcosts by operating a more efficient business, investingin labor-saving technologies, and keeping payroll costsdown. In 2008 there were 22,728 independent communitypharmacies employing over 260,000 workers and providinghigh quality services and niche markets which are greatlyvalued by patients.Number of hours and days per week per locationHours open per week 55Days open per week 6Sales activity per hour openPrescription sales per hour $1,266Other sales per hour $91Number of prescriptions dispensed22per hourPercentage of total prescriptions covered by:Government programs (Medicaid44%or Medicare Part D)Other third-party programs 44%Percentage of generic prescriptionsdispensed65%2009 NCPA Digest, sponsored by Cardinal Health
Figure 1 • Average Annual Sales (in Thousands) Per Pharmacy LocationAn overview of the average independent community pharmacyis provided in Table 1. In general, the average independentcommunity pharmacy location dispensed 62,379prescriptions (200 per day) in 2008, which is a slight increasefrom last year’s prescription volume of 61,052. This trend issimilar to what other indicators in the pharmacy marketplaceare showing. Thus, the average independent communitypharmacy is filling more prescriptions per day compared tolast year. Given this, independent community pharmacistsare looking for ways to create a more efficient pharmacy,often by implementing new technologies.Independents continue to operate multiple pharmacies.Twenty-five percent of independent owners have ownershipin two or more pharmacies and the average numberof pharmacies in which each independent owner hasownership is 1.46.The NCPA Digest, sponsored by Cardinal Health data havebeen collected for over 75 years, providing an opportunityto look at long-term trends for independent communitypharmacies. (Go to www.ncpanet.org for the history of theDigest.) Gross margins fell in the 1990s and since 1999 haveremained relatively flat at 22 to 24 percent. Alternatively, average sales per pharmacy location have increased 97percent since 1999.n Average sales per location for 2008 was $3,880,802,slightly up from 2007. This is most likely correlated with anincrease in prescription volume and an increase inaverageprescription charge.TABLE 1 • Averages of Pharmacy Operations1999 2000 2001 2002 2003 2004 2005 2006 2007 2008Sales 100% 100% 100% 100% 100% 100% 100% 100% 100% 100%Cost of goods sold 76% 76.7% 77% 76.5% 76% 77.9% 76.4% 77.2% 76.8% 76.8%Gross profit 24% 23.3% 23% 23.5% 24% 22.1% 23.6% 22.8% 23.2% 23.2%Payroll expenses 12.8% 12.2% 12.5% 13.1 13.2% 12.2% 13.4% 13.6% 13.7% 13.5%Other operating expenses 7.6% 7.9% 6.9% 6.6% 6.8% 6.3% 6.5% 6.4% 6.5% 6.5%Total expenses 20.4% 20.1% 19.4% 19.7% 20% 18.5% 19.9% 20% 20.2% 20%Net operating income 3.6% 3.2% 3.6% 3.8% 4% 3.6% 3.7% 2.8% 3.0% 3.2%Executive Summary
n Gross margin remained constant as in 2007 at 23.2percent.n Payroll expenses, as a percentage of sales, decreasedby 0.2 percentage points in 2008 to 13.5 percent. Thenumber of employees also decreased which allowed payrollexpenses to decrease. As prescription volume increased,pharmacists were challenged with becoming more efficient;thereby filling more prescriptions with less staff.n All other operating expenses remained at 6.5 percent.n Through attempts by independents to lower their payrollexpenses and control operating expenses, the average netoperating income increased to 3.2 percent. However, thenet operating income dollars before tax remained similarto 2007.It is important to note that this year’s Digest data reflect themarketplace in 2008, the third year for the Medicare Part Dprescription drug benefit. In 2008, 30 percent of prescriptionsin independent community pharmacies were coveredby Medicare Part D, a 4 percentage point increase fromlast year. Thus, the role of government programs such asMedicare Part D and Medicaid continues to increase whileprivate third-party plans have been declining since 2005.Viability of IndependentCommunity PharmacyIndependent community pharmacies are working hard toimprove their financial position. Historically, before theimplementation of Medicare Part D in 2006, an averageof 12.4 percent of independent community pharmacies operated at a loss between 2001 and 2005. In 2006 the profitabilityof pharmacytooka strong hit, 22.9 percent ofindependent community pharmacies operated at a loss forthe fiscal year in 2006 while over 1,100 pharmacies endedup closing their doors. In 2007 independent communitypharmacy saw a slight improvement compared to the previousyear, with 19.2 percent of pharmacies operating at aloss for the fiscal year 2007.Viability of Independent PharmacyNet Profit as a Percent of Sales Percentage ofPharmaciesAccumulatedPercentagesOperating at a loss 14.7% 14.7%Less than 2% 28.9% 43.6%2 to 4% 21.8% 65.4%4% to 6% 12.8% 78.2% 6% to 8% 10% 88.2%8% and over 11.8% 100%In2008, 14.7percentof independentcommunity pharmacies operated at a loss. Independent community pharmacistsare finding ways to remain financially viable. Forexample, independents this year reduced their payrollexpenses, increased the use of technology, and obtainedrevenue for medication therapy management (MTM)services provided.Distribution of Pharmacies Over Time by Net Profit 2009 NCPA Digest, sponsored by Cardinal Health
Operating Results To determine how the participating pharmacies performedfinancially, the financial information from the survey wassummarized and presented in three basic statements: common-sizedincome statement, median financial benchmarks,and common-sized balance sheet. These statementsare provided in Tables 2, 3, and 4, respectively. From thesetables, we have provided a summary of the results.2008 Highlightsn Average sales for all participating pharmacies was over9.7 percent higher than sales for the Top 25 Percent,suggesting that smaller pharmacies are maintainingcosts and generating profits more efficiently than largerpharmacies.n Gross margin remained constant as in 2007 at 23.2percent for all pharmacies. The Top 25 Percent experienceda decrease in gross profit margin of 0.9 percentagepoints; however, they still had higher gross marginsthan all pharmacies (at 24.5 percent compared to 23.2percent for all pharmacies).n Median net operating income decreased by 0.27 percentage Over the past few years, gross profit margins have slightlypoints to 2.70 percent, and yet the median net operating increased or decreased from year to year. For 2008, grossincome dollars for 2008 stayed basically the same as 2007. profit margins remained constant at 23.2 percent. It appearsthat independent community pharmacy owners The Top 25 Percent experienced an increase in median netoperating income percentage and an increase in $101,172 in attempt to maintain a gross margin of 23 percent in ordermedian net operating income dollars before tax. to maintain their business.n Return on investment for all pharmacies decreased from30 percent to 23 percent in 2008.n For all pharmacies and the Top 25 Percent, the currentratio and quick ratio increased, indicating more liquidityand less potential for cash flow problems. This may be dueAll Pharmacies to the improved reimbursement time for Medicare PartD plans and independent pharmacists’ ability to adapt tocash flow problems.ProfitabilityThe charts below show what happens to each sales dollarfor the “average” pharmacy versus the average independentcommunity pharmacy in the top 25 percentile.The Top 25 Percent have 7.1 percent in net operatingincome (compared to 3.2 percent, the average for allpharmacies). To assess the real impact of their operatingefficiency, apply this 3.9 percent difference to average salesof $3.8 million for all pharmacies. The result is more than$148,000 of added operating income dollars if the expensecontrols of the Top 25 Percent can be met. Their profit advantagecomes from managing cost of goods sold, payrollexpenses, and other operating expenses.Gross Profit MarginThe Top 25 Percent have a 1.3 percent gross profit advantageby managing cost of goods sold and pricing. Theirgross profit margin was 24.5 percent compared to 23.2 percent for all participating pharmacies. Still, the Top 25Percent saw gross profit margins as a percentage of sales fallTop 25 percent 102009 NCPA Digest, sponsored by Cardinal Health
Sales Mix—Average for All Pharmacies2006 2007 2008Prescription sales $3,169,010 92.4% $3,344,571 92.8% $3,619,354 93.3%All other sales $260,654 7.6% $259,842 7.2% $261,448 6.7%Total sales $3,429,664 100% $3,604,413 100% $3,880,802 100%Cost of goods sold $2,647,701 77.2% $2,768,231 76.8% $2,981,572 76.8%Gross profit margin $781,963 22.8% $836,183 23.2% $899,230 23.2%Sales Mix— Average for Top 25 Percent2006 2007 2008Prescription sales $2,500,048 94% $3,126,113 95.2% $3,328,345 94.1%All other sales $159,578 6% $157,626 4.8% $207,690 5.9%Total sales $2,659,625 100% $3,283,739 100% $3,536,035 100%Cost of goods sold $1,962,804 73.8% $2,449,838 74.6% $2,668,603 75.5%Gross profit margin $696,821 26.2% $833,901 25.4% $867,432 24.5%by 1.7 percentage points since 2006. Even the most efficientpharmacies are finding it difficult to maintain acceptablegross margins to pay the personnel and operating costs ofmanaging a pharmacy.To determine how the Top 25 Percent achieved their marginadvantage, we assessed the sales mix and gross profit marginsfor prescriptions separate from other sales. Prescriptionsales increased for all pharmacies and the Top 25Percent, while other sales decreased slightly for all pharmacies.Independent community pharmacies continue to focusmainly on prescriptions for the majority of their sales.Gross Profit Margin by DepartmentAs was mentioned earlier, the average gross profit marginfor all participating pharmacies remained the same thisyear, while gross profit margin for the Top 25 Percentdecreased by 0.9 percentage points. To evaluate trends ingross margin, we assessed how gross margins differed forprescription sales as compared to other sales.All pharmacies’ gross profit margin for prescription salesincreased while gross margin on other sales decreased.The Top 25 Percent experienced a different trend. Theysaw gross margin on both prescription sales and othersales decrease. It appears gross margin on other sales aredeclining as independents community pharmacists striveto remain competitive. Because over 90 percent of salesin an independent community pharmacy are attributedto prescription sales, the overall gross profit margintrend usually follows the prescription sales gross profitmargin trend.Gross Profit Margin by DepartmentAV E R AG E FO R A L L P H A R M AC I E SAV E R AG E FO R TO P 2 5 P E R C E N T2006 2007 2008 2006 2007 2008Gross margin on prescription sales 21.5% 22.1% 22.6% 25.3% 24.3% 23.9%Gross margin on all other sales 38.2% 37.5% 30.1% 40% 46.8% 35.4%Overall gross profit margin 22.8% 23.2% 23.2% 26.2% 25.4% 24.5%Percent of sales dispensed generically 58.4% 60.6% 64.5% 59.8% 62.6% 66.4%Operating Results11
Operating Expense ManagementWe evaluated two separate components of operatingexpenses—payroll expenses and other operating expenses.Payroll expenses include all wages, employee taxes, andbenefits for all staff including owners. Other operatingexpenses include advertising, insurance, store supplies,containers and labels, delivery expenses, office postage,pharmacy computer expense, rent, utilities and telephone,and “all other operating expenses.” These are the itemsfrequently referred to as overhead.Payroll expenses, as a percentage of sales including owners,decreased by 0.2 percentage points in 2008 to 13.5percent for all pharmacies. The number of employees alsodecreased which allowed payroll expenses as a percentageof total sales to decrease. As prescription volume increased,pharmacists were challenged with becoming more efficient;thereby filling more prescriptions with less staff. For 2008,average payroll expenses as a percentage of sales declinedby 2.2 percentage points for the Top 25 Percent. Otheroperating expenses remained relatively the same at 6.5percent for all pharmacies and 5.6 percent for the Top 25Percent of pharmacies.Staff Costs Per EmployeeStaff cost per employee represents on average the amountof compensation, taxes and employee benefits paid duringthe year for each non-owner employee. Independent communitypharmacies paid median staff costs of $42,804 peremployee. That’s a 6.7 percent decrease since last year.Staff costs per employee for the Top 25 Percent remainedalmost constant in 2008. However, staff costs per employeefor the Top 25 Percent were 4.1 percent lower than the costsfor all pharmacies at $41,046 (compared to $42,804 for allpharmacies). Their staff were also more productive, that is,they generated more sales per employee ($455,306 for theTop 25 Percent compared to $447,344 for all pharmacies). STAFF COST PER EMPLOYEE PAY R O L L E X P E N S E S AS A P E R C E N TAG E O F SA L E S 122009 NCPA Digest, sponsored by Cardinal Health
Pharmacy Staff Positions2006 2007 2008Non-owner pharmacists 1.9 1.6 1.6Technicians 4.6 3.7 3.8Other positions 5.6 5 3.9Total non-owner employees 12.1 10.3 9.3Working owners—pharmacists and other positions 1.3 1 1.2Total workforce 13.4 FTE Employees 11.3 FTE Employees 10.5 FTE EmployeesHourly wages for staff pharmacists, technicians and clerkscontinued to increase in 2008. Staff pharmacist wagesincreased to $50.45 and pharmacy technician wages increasedto $13.24. Clerk/cashier wages increased slightly to$9.05 per hour.Pharmacies reported the number of full-time equivalent(FTE) employees working during the year. Averageresponses showed staff decreases for 2008. This may bedue to the necessity of controlling employee costs as grossmargins remain flat. For purposes of this report, each2,080 hours of work is considered one FTE (full-timeequivalent) employee.ProductivityOptimum productivity is the result of efficiently controllingpayroll expenses while maximizing results, or sales(that is, the effectiveness of workers’ efforts). Total payrollexpenses as a percentage of sales is a benchmark for measuringcost efficiency. “Sales Per Employee” is a benchmarkfor measuring employee productivity.In 2008, for all participating pharmacies, sales per employeeincreased to $447,344. The Top 25 Percent had 1.8percent higher productivity than the average for all pharmaciesas measured by the sales-per-employee ratio.Operating Results 13
Financial PositionManaging Assets and Controlling DebtManaging assets and controlling debt enhances financialposition. By efficiently managing assets, the amount ofsales and profits generated from the pharmacy’s investmentin assets increases. The largest and most important asset tothe independent community pharmacy is its investmentin inventory and is more thoroughly evaluated in the nextsection—Cash Flow. Here we assess the overall asset efficiencyconsidering all assets of pharmacies. Asset Efficiency RatiosFor purposes of this study, we measured asset efficiencyusing the sales to assets ratio. Refer to the Guide to Benchmarkingfor a review of how this ratio is computed andinterpreted. You can download the Guide by visiting www.ncpanet.org/members/digest.php.Sales toassetsDebt ManagementOverall, pharmacies had low risk as measured by thedebt to worth ratio. The debt to worth ratio for theTop 25 Percent shows that for every dollar owners haveinvested in their business, the creditors have providedabout 20 cents as compared to 48 cents for all pharmacies.The Top 25 Percent is “less risky” as measured bythe debt to worth ratio.Return on investment (ROI) decreased in 2008 forindependent community pharmacies. For every dollarowners invested, they earned 23 cents in net operatingincome, which is worse than 2007 but better than 2006.Alternatively, ROI for the Top 25 Percent increased in2008 from 45.8 percent to 63 percent. The return oninvestment ratio for the Top 25 Percent shows that forevery dollar the owner has invested in the business, theyM E D I A N FO RM E D I A N FO Rearned about 63 cents in net operating income afterA L L P H A R M AC I E STO P 2 5 P E R C E N T compensation to owners but before tax. This compares2006 2007 2008 2006 2007 2008 to only 23 cents for all pharmacies. Even though the$5.44 $5.09 $5.47 $5.53 $5.19 $5.66 Top 25 Percent are operating with more of their ownmoney (a bigger investment), their higher profits resultM E D I A N FO R A L L P H A R M AC I E SM E D I A N FO R TO P 2 5 P E R C E N TRatio Computation 2006 2007 2008 2006 2007 2008Debt to worth Total liabilities ÷ Net worth 0.53 0.66 0.48 0.3 0.3 0.21Return on investment Net operating income ÷ Net worth 16.7% 30% 23% 43.5% 45.8% 63%SA L E S P E R E M P LOY E E142009 NCPA Digest, sponsored by Cardinal Health
Cash FlowManaging Working CapitalThe amount of working capital, or cash flowing throughthe business, indicates liquidity. The current ratio is acommon benchmark for measuring cash flow or liquidity.This ratio shows that the Top 25 Percent have $4.43 incurrent assets on hand for every $1.00 in current liabilities,and all pharmacies have $3.60 in current assets on handfor every $1.00 in current liabilities. The quick ratio is theother ratio that measures the companies’ ability to generatecash quickly—without selling inventory. The Top 25Percent had $2.47 in cash and accounts receivable on handfor every $1.00 in current liabilities compared to $1.55 forall pharmacies.Both the current ratio and quick ratio for the Top 25Percent and for all pharmacies increased in 2008. This isan indication that pharmacies may be overcoming someof their cash flow problems. Additionally, due to pressure,third-party plans, including those administering benefitsthrough Medicare Part D, are reimbursing pharmacistsmore timely.Working capital is a cycle of funds moving through thepharmacy. The primary elements of the working capitalcycle are inventory, accounts receivable, and accounts payable.These are the primary uses and sources of cash flow.We typically measure how efficiently the cycle is managedby assessing the number of days cash is consumedby inventory and accounts receivable or provided by tradeaccount creditors (vendors).Inventory was held in stock for 35 days in 2008, 2 daysshorter than in 2007. The accounts receivable collectionperiod also decreased from 22 days to 15 days for allpharmacies and from 19 to 17 days for the Top 25 Percent.This is reflected in the improvement in liquidity. The Top25 Percent continued to pay their bills quicker than themedian for all pharmacies.Inventory ControlThe goal of inventory management is to minimize theinvestment in inventory as sales rise while ensuring thatinventory is available when needed. Benchmarks for assessinginventory are inventory turnover (the number oftimes inventory is used up during the year), and inventoryturn days. Turn days converts the inventory turnover ratiointo the average number of days’ worth of stock on hand.The inventory benchmarks for independent communitypharmacies are displayed below.Prescription inventory for all pharmacies turned fasterthan the overall turnover of all merchandise combined, aswould be expected since over-the-counter medicines andother merchandise tend to turn more slowly. Prescriptionstock stayed on hand for 31 days (compared to 35 daysfor all inventory). The Top 25 Percent maintained similarturnover rates compared to all pharmacies.M E D I A N FO R A L L P H A R M AC I E SM E D I A N FO R TO P 2 5 P E R C E N T2006 2007 2008 2006 2007 2008Cash flow is used for…Inventory turn days 35 days 37 days 35 days 35 days 37 days 37 daysAccounts receivable collection period 19 days 22 days 15 days 19 days 19 days 17 daysFor a total of… 54 days 59 days 50 days 54 days 56 days 54 daysCash flow is provided by…Accounts payable payment days 15 days 16 days 15 days 12 days 15 days 10 daysNet days in cycle 39 days 43 days 35 days 42 days 41 days 44 daysM E D I A N FO R A L L P H A R M AC I E SM E D I A N FO R TO P 2 5 P E R C E N T2006 2007 2008 2006 2007 2008Inventory turnover (annual) 10.3 9.8 10.4 10.6 9.9 10Inventory turnover days 35 days 37 days 35 days 35 days 37 days 37 daysPrescription inventory turnover (annual) 11.7 12.1 11.7 11.3 11.5 10.3Prescription inventory turnover days 31 days 30 days 31 days 32 days 32 days 35 daysOperating Results15
Table 2 • 2008 Common-Sized (Average) Income Statement—Percentage of Total SalesA L L P H A R M AC I E STO P 2 5 P E R C E N T2006 2007 2008 2008 Avg ($) 2006 2007 2008 2008 Avg ($)SalesPrescription sales 92.4% 92.8% 93.3% $3,619,354 94% 95.2% 94.1% $3,328,345All other sales 7.6% 7.2% 6.7% $261,448 6% 4.8% 5.9% $207,690Total Sales 100% 100% 100% $3,880,802 100% 100% 100% $3,536,035Cost of Goods SoldPrescriptions costs 72.5% 72.3% 72.1% $2,800,434 70.2% 72% 71.7% $2,534,439All other costs 4.7% 4.5% 4.7% $181,138 3.6 2.6% 3.8% $134,164Total Cost of Goods Sold 77.2% 76.8% 76.8% $2,981,572 73.8% 74.6% 75.5% $2,668,603Gross Profit 22.8% 23.2% 23.2% $899,230 26.2% 25.4% 24.5% $867,432Operating ExpensesPayroll ExpensesSalaries, wages 11.8% 11.8% 11.8% $457,356 12.2% 12.5% 10.2% $361,029Payroll taxes, workers’ comp,employee benefits1.7% 1.9% 1.7% $68,435 1.7% 1.5% 1.6% $56,156Payroll Expenses 13.6% 13.7% 13.5% $525,791 13.9% 14.0% 11.8% $417,185Other Operating ExpensesAdvertising 0.5% 0.5% 0.5% $17,562 0.4% 0.4% 0.3% $12,578Insurance 0.4% 0.3% 0.3% $13,457 0.4% 0.3% 0.3% $10,243Store supplies, containers,labels0.4% 0.4% 0.5% $17,373 0.4% 0.4% 0.4% $14,159Office postage 0.1% 0.1% 0.1% $4,468 0.1% 0.1% 0.1% $3,123Delivery service 0.2% 0.2% 0.2% $8,853 0.3% 0.2% 0.3% $9,225Pharmacy computer expense 0.3% 0.4% 0.4% $15,689 0.3% 0.4% 0.4% $14,276Rent 1.2% 1.2% 1.2% $46,742 1.2% 0.8% 1.0% $33,966Utilities, telephone 0.5% 0.5% 0.4% $16,443 0.4% 0.4% 0.4% $14,054All other operating expenses 2.8% 2.9% 2.9% $110,878 2% 2.1% 2.4% $86,744Total Other Operating Expenses 6.4% 6.5% 6.5% $251,465 5.5% 5.1% 5.6% $198,368Total Operating Expenses 20% 20.2% 20% $777,256 19.4% 19.1% 17.4% $615,553Net Operating Income 2.8% 3.0% 3.2% $121,974 6.8% 6.3% 7.1% $251,879162009 NCPA Digest, sponsored by Cardinal Health
Profitability RatiosNet operating income percentage= Net profit before tax ÷ SalesNet operating income dollars before tax= Net profit before taxTable 3 • 2008 Median Financial BenchmarksA L L P H A R M AC I E STO P 2 5 P E R C E N T2006 2007 2008 2006 2007 20082% 2.97% 2.7% 5.9% 6.52% 8.6%$69,180 $89,000 $89,210 $151,677 $153,576 $254,748Productivity RatiosSales per employee= Sales ÷ # of employees including ownersStaff costs per employee= Non-owner wage, tax, benefits ÷ # of employees excluding ownersPrescription sales per square foot= Prescription sales ÷ Prescription dept square feetAll other sales per square foot= All other sales ÷ Square feet excluding prescription deptTotal sales per square foot= Total sales ÷ Square feetMedian sales= Group middle point$400,000 $423,718 $447,344 $412,910 $465,806 $455,306$42,255 $45,883 $42,804 $37,836 $41,564 $41,046$3,940 $3,637 $3,732 $3,383 $3,855 $3,477$80 $80 $85 $74 $70 $98$1,153 $1,134 $1,161 $1,337 $2,500 $2,067$3,429,664 $3,059,350 $3,329,164 $2,659,625 $2,803,432 $2,838,603Financial Position RatiosSales to assets= Sales ÷ Total assetsReturn on investment= Net operating income dollars ÷ Net worthDebt to worth= Total liabilities ÷ Net worth5.44 5.09 5.47 5.53 5.19 5.6616.7% 30% 23% 43.5% 45.8% 63%0.53 0.66 0.48 0.30 0.30 0.21Cash Flow RatiosCurrent ratio= Current assets ÷ Current liabilitiesQuick ratio= Cash + accounts receivable ÷ Current liabilitiesInventory turnover (annual)= Cost of goods sold ÷ InventoryInventory turnover (days)= 365 ÷ Inventory turnoverPrescription inventory turnover= Prescription cost of goods sold ÷ Prescription inventoryPrescription inventory turnover (days)= 365 ÷ Prescription inventory turnoverAccounts receivable turnover (annual)= Credit sales ÷ Accounts receivableAccounts receivable collection (days)= 365 ÷ Accounts receivable turnoverAccounts payable turnover (annual)= Cost of goods sold ÷ Accounts payableAccounts payable turnover (days)= 365 ÷ Accounts payable turnover3.79 2.89 3.60 5.24 3.71 4.431.62 1.30 1.55 2.71 2.04 2.4710.3 9.8 10.4 10.6 9.9 1035 days 37 days 35 days 35 days 37 days 37 days11.7 12.1 11.7 11.3 11.5 10.331 days 30 days 31 days 32 days 32 days 35 days18.7 16.6 23.7 18.4 19.5 22.119 days 22 days 15 days 19 days 19 days 17 days25.1 22.4 24.1 30.1 24.8 36.615 days 16 days 15 days 12 days 15 days 10 daysOperating Results17
Table 4 • 2008 Common-Sized (Average) Balance Sheet, Percentage of Total AssetsA L L P H A R M AC I E STO P 2 5 P E R C E N T2006 2007 2008 2006 2007 2008AssetsCurrent AssetsCash and cash equivalents 15.7% 15.5% 18.5% 22.6% 24.4% 22.8%Accounts receivable 23% 25.7% 23.4% 20.3% 19.9% 22.7%Inventory 43.1% 37.3% 38.8% 42.7% 36.5% 38.5%Other current assets 4.7% 3.7% 5% 3.7% 6.1% 6.9%Total Current Assets 86.6% 82.2% 85.7% 89.3% 86.9% 90.9%Net fixed assets 9.6% 11.5% 10.2% 8.4% 7.3% 5.6%Other assets 3.8% 6.3% 4.1% 2.3% 5.8% 3.5%Total Assets 100% 100% 100% 100% 100% 100%Liabilities and Owners’ EquityCurrent LiabilitiesNotes payable (within one year) 5.4% 8.7% 7.5% 1.6% 2.5% 4.4%Accounts payable 17.4% 15.8% 16% 12.2% 16.1% 11.1%Other current liabilities 6.1% 8.1% 5.8% 4.1% 7.1% 3.5%Total Current Liabilities 28.9% 32.6% 29.3% 17.9% 25.7% 19.0%Long-Term LiabilitiesNotes payable to owner(s) 9.5% 8% 8.3% 7.6% 7.7% 5.2%Other long-term liabilities 9% 10.5% 11.1% 8.3% 3% 8.9%Total Long-Term Liabilities 18.5% 18.5% 19.4% 16.0% 10.7% 14.1%Total Liabilities 47.4% 51.1% 48.7% 33.9% 36.4% 33.1%Total Owners’ Equity 52.6% 48.9% 51.3% 66.1% 63.6% 66.9%Total Liabilities and Owners’ Equity 100% 100% 100% 100% 100% 100%182009 NCPA Digest, sponsored by Cardinal Health
Sales Volume SummarySales indicate the size of the pharmacy and can influence financial performance. To determine how a pharmacy’s ratioschange as sales increase, we sorted the pharmacies intofour separate groups based on their annual sales.n Less than $2.5 millionn $2.5 million to $3.5 millionn $3.5 million to $6.5 millionn More than $6.5 million The three basic statements (common-sized [average]income statement, median financial benchmarks, and common-sizedbalance sheet) for these sales categories appearin Tables 5, 6, and 7. This information shows some significanttrends. Our observations follow.ProductivitySales Per EmployeePharmacies with sales between $3.5 and $6.5 million hadthe highest productivity, followed by pharmacies with salesover $6.5 million. This high employee productivity is asignificant driver of the industry’s profitability.SALES PER EMPLOYEEPharmacies Have Higher Staff Cost Per EmployeeAs Sales GrowThe additional productivity comes at a higher cost. Medianstaff costs per employee for pharmacies with sales between$3.5 million and $6.5 million and sales over $6.5 millionwere the highest of all the sales categories. This is likelydue to the additional management and administrativestaffrequired to operate larger pharmacies.Pharmacy Productivity Per Square FootProductivity of floor space increased substantially as salesincreased. It is important for pharmacy owners to maximizetheir space to generate sales.Pharmacy Productivity per square footUnder $2.5M to $3.5M to Over $2.5M $3.5M $6.5M $6.5M Prescription sales per $2,687 $3,709 $4,543 $6,759prescription square foot All other sales pernonprescription$66$81 $103$143square footAverage sales persquare foot $821 $1,138 $1,395 $1,838Average overallsquare feet2,622 2,844 4,345 5,656 STAFF COST PER EMPLOYEESales Volume Summary19
ProfitabilityExpense ManagementThe table below shows sales mix and gross margins forpharmacies in the four sales categories. ProfitabilityUnder$2.5M$2.5M to$3.5M$3.5M to$6.5MOver$6.5MThe charts show how payroll expenses and other operatingexpenses change as sales increase. In 2008, the payrollexpense (including owners) as a percentage of sales was highest in pharmacies with sales over $6.5 million. As payrollexpenses increased to support the higher sales, the netoperating income percentages decreased. Prescription sales 92.8% 93.9% 93.1% 93.4%All other sales 7.2% 6.1% 6.9% 6.6%Total sales 100% 100% 100% 100%Average cost of goods sold 77.9% 75.9% 76.9% 76.9%Average Gross Margin 22.1% 24.1% 23.1% 23.1%Sales mix between prescription sales and other sales variedamong the sales groups; however, all pharmacies had greaterthan 90 percent in prescription sales. The highest averagegross margins were earned by pharmacies with $2.5 millionto $3.5 million in sales at 24.1 percent. While the marginsare higher, since the volume is low, the net dollars to the pharmacy are significantly lower when compared to largerpharmacies. It is also important to note that pharmacies with sales less than $2.5 million have higher cost of goodssold and thus lower gross margins.PAYROLL EXPENSESInventory ControlInventory turns increased as sales increased, with the pharmacieswith sales more than $6.5 million being the mostefficient at inventory control. Pharmacies with sales morethan $6.5 million turned their inventory the fastest, withstock staying on hand for only 28 days. Smaller pharmacies(having sales under $2.5 million) held stock almost 43 percentlonger for a total of 40 days. Efficient management of prescription inventory had a significant impact on the trendof increasing overall inventory turnover as sales increased. OTHER OPERATING EXPENSESInventory Control Under$2.5M$2.5M to$3.5M$3.5M to$6.5MOver$6.5M Inventory turnover (annual) 9.2 10.4 10.8 12.9Inventory turnover (days) 40 days 35 days 34 days 28 daysPrescription inventoryturnover (annual)10.210.812.713.5 Prescription inventory 36 days 34 days 29 days 27 daysturnover (days)202009 NCPA Digest, sponsored by Cardinal Health
In general,other operating expenses (overhead) rangedfrom 6.3 percent to 7.0 percent in the various sales categories,with the lowest sales category having the highest oper-ating expenses as a percent of sales. This observation is notsurprising given the effect of fixed expenses. Fixed expensesdo not grow in relation to sales. Instead, they stay the sameas sales increase and over the long-term will stair-step up. Assales grow and costs stay the same, costs as a percentage ofsales decrease. Again we find that as sales grow, companiesmay become less efficient as they step up their costs to supportthe larger pharmacies.Net Operating Income Before TaxThe group of pharmacies with sales between $2.5 million and $3.5 million showed the highest net operating income as a percentage of sales. For pharmacies with sales over $6.5million, profits as a percentage of sales were lower due tohigher payroll expenses and other operating expenses. However,their median net operating dollars were higher. AVERAGE NET OPERATING INCOME PERCENTAGESales Volume Summary21
Table 5 • 2008 Common-Sized (Average) Income Statement, Percentage of Total Sales—By Sales VolumeUnder $2.5M $2.5M to $3.5M $3.5M to $6.5M Over $6.5MSalesPrescription sales 92.8% 93.9% 93.1% 93.4%All other sales 7.2% 6.1% 6.9% 6.6%Total Sales 100% 100% 100% 100%Cost of Goods SoldPrescriptions costs 73% 72.1% 72.5% 71.6%All other costs 4.9% 3.8% 4.4% 5.3%Total Cost of Goods Sold 77.9% 75.9% 76.9% 76.9%Gross Profit 22.1% 24.1% 23.1% 23.1%Operating ExpensesPayroll expensesSalaries, wages 11.2% 12% 11.6% 12.9%Payroll taxes, workers’ comp, employee benefits 1.6% 1.8% 1.8% 1.9%Payroll Expenses 12.8% 13.8% 13.4% 14.8%Other Operating ExpensesAdvertising 0.5% 0.4% 0.5% 0.5%Insurance 0.5% 0.3% 0.4% 0.3%Store supplies, containers, labels 0.5% 0.4% 0.5% 0.5%Office postage 0.1% 0.1% 0.1% 0.2%Delivery service 0.2% 0.2% 0.2% 0.4%Pharmacy computer expense 0.5% 0.3% 0.4% 0.4%Rent 1.4% 1.3% 1.1% 1.2%Utilities, telephone 0.6% 0.5% 0.4% 0.3%All other operating expenses 2.7% 2.8% 3.1% 2.8%Total Other Operating Expenses 7.0% 6.3% 6.7% 6.6%Total Operating Expenses 19.8% 20.1% 20.1% 21.4%Net Operating Income 2.3% 4.0% 3.0% 1.7%222009 NCPA Digest, sponsored by Cardinal Health
Table 6 • 2008 Median Financial Benchmarks—By Sales VolumeUnder $2.5M $2.5M to $3.5M $3.5M to $6.5M Over $6.5MProfitability RatiosNet operating income percentage 3.10% 3.80% 2.36% 2.34%Net operating income dollars before tax $53,473 $107,727 $99,916 $215,164Productivity RatiosSales per employee $363,048 $405,172 $423,564 $419,344Staff costs per employee $36,552 $42,875 $44,945 $52,158Prescription sales per square foot $2,687 $3,709 $4,543 $6,759All other sales per square foot $66 $81 $103 $143Total sales per square foot $821 $1,138 $1,395 $1,838Median sales $1,913,036 $2,968,396 $4,321,317 $8,253,056Financial Position RatiosSales to assets 5.16 5.57 5.38 6.89Return on investment 23% 25.9% 23.3% 25.9%Debt to worth 0.37 0.46 0.48 0.58Cash Flow RatiosCurrent ratio 4.09 3.45 3.89 2.79Quick ratio 1.50 1.41 1.76 1.30Inventory turnover (annual) 9.2 10.4 10.8 12.9Inventory turnover (days) 40 days 35 days 34 days 28 daysPrescription inventory turnover (annual) 10.2 10.8 12.7 13.5Prescription inventory turnover (days) 36 days 34 days 29 days 27 daysAccounts receivable turnover (annual) 24 25.9 23.1 20.0Accounts receivable collection (days) 15 days 14 days 16 days 18 daysAccounts payable turnover (annual) 24.5 26.3 22.6 26.6Accounts payable turnover (days) 15 days 14 days 16 days 14 daysSales Volume Summary23
Table 7 • 2008 Common-Sized (Average) Balance Sheet, Percentage of Total Assets—By Sales VolumeUnder $2.5M $2.5M to $3.5M $3.5M to $6.5M Over $6.5MAssetsCurrent AssetsCash and cash equivalents 17.4% 19.5% 19.8% 14.5%Accounts receivable 19.5% 20.4% 23.8% 30.9%Inventory 44.4% 40.7% 37% 36%Other current assets 3.5% 7% 4.2% 5.5%Total Current Assets 84.8% 87.6% 84.8% 86.9%Net fixed assets 8.5% 8.3% 11.2% 9.7%Other assets 6.7% 4.1% 4% 3.4%Total Assets 100% 100% 100% 100%Liabilities and Owners’ EquityCurrent LiabilitiesNotes payable (within one year) 6.8% 5.9% 5.1% 12.2%Accounts payable 12.5% 15.4% 18.4% 13.8%Other current liabilities 5.2% 5.3% 3.7% 9.3%Total Current Liabilities 24.5% 26.6% 27.2% 35.3%Long-Term LiabilitiesNotes payable to owner(s) 6.4% 11.8% 9.4% 3.1%Other long-term liabilities 10.9% 15.7% 11% 7.1%Total Long-Term Liabilities 17.3% 27.5% 20.4% 10.2%Total Liabilities 41.8% 54.1% 47.6% 45.5%Total Owners’ Equity 58.2% 45.9% 52.4% 54.5%Total Liabilities and Owners’ Equity 100% 100% 100% 100%242009 NCPA Digest, sponsored by Cardinal Health
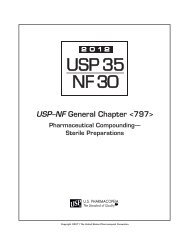
Cost of DispensingOne definition of “profit” is the monetary difference betweenwhat it costs to produce and sell a product and therevenue from its sale. In the pharmacy, knowing your costof dispensing is an indispensable tool in maintaining orimproving cash flow and profitability.To determine the cost of dispensing, the pharmacy owneror manager needs to conduct a departmental cost analysisthat assigns direct costs and allocates indirect costs tothe prescription department. The total cost allocated tothe prescription department divided by the number ofprescriptions dispensed is the average cost of dispensing.This average cost of dispensing is the average amount thatit costs the pharmacy to dispense a prescription.Cost ofDispensingTotal annualcosts allocatedto prescriptiondepartmentTotal annualnumber ofprescriptionsdispensedCost of dispensing includes all direct costs (e.g., prescriptionbottles and labels, delivery service, and pharmacycomputer expense) related to operating a prescriptiondepartment and a share of the indirect costs. The share ofindirect costs (e.g., rent, salaries, and advertising) is estimatedby allocating a portion of the cost to the prescriptiondepartment. There are multiple methods that canbe used to allocate costs. Although there is no universallyaccepted method for allocating indirect costs, the basis ofallocation should seem logical. In pharmacy, the followingmethods have been used to allocate indirect expenses:the prescription department, the cost of dispensing canbe estimated. As previously stated, the cost to dispense aprescription is found by dividing the total cost of operatingthe prescription department by the total number ofprescriptions dispensed.AnalysesWe used the Digest data to calculate the cost of dispensingfor 2008. It is important to note that this calculation onlycovers the cost of dispensing and does not include a profit.The 2009 Digest pharmacy’s cost of dispensing for allpharmacies is $11.01, up from $10.89 last year. Expensesincreased as hourly wages increased, operating expensesincreased, and pharmacists provided value-added services.The slight increase in prescription volume did not offsetthe increasing expenses; thus resulting in a slightly highercost of dispensing for all pharmacies. The Top 25 percenthad a lower cost of dispensing at $10.10 (compared to$11.01 for all pharmacies). We also calculated the costof dispensing in various geographic regions, as shownin Figure 2. The Northeast region has the highest cost ofdispensing at $12.83, and the East Central region has thelowest at $10.54.Figure 2 • Cost of Dispensing—By Geographic Regionn A percentage of prescription sales to total salesn A percentage of prescription department square feet tototal square feetn A percentage of prescription department inventory tototal inventoryn A percentage of time the asset is used for the prescriptiondepartment activities to total time usedPharmacy owners and managers can select one method touse or they can use multiple methods to allocate indirectexpenses. Having classified all costs that are associated withCost of Dispensing25
If a pharmacy is to make a profit, the reimbursement rateor the price charged must cover the product cost, the costof dispensing, plus a surplus for profit. Thus, for pharmacyowners and managers to make sound business decisionson whether to accept a contract or not, they need to knowwhat it costs them to dispense a prescription. It is suggestedthat pharmacy owners estimate their own cost ofdispensing and then carefully evaluate each third-partycontract before signing. Additionally, all usual and customarycharges should include the cost of dispensing, andpharmacy benefit managers should reimburse to cover costof dispensing.262009 NCPA Digest, sponsored by Cardinal Health
Third-Party PrescriptionsThe most significant external pressure on the business ofindependent community pharmacy is third-party prescriptioncoverage and the plans that administer drug coverage,pharmacy benefit managers (PBMs). For communitypharmacies, public and private third-party payers dictateprescription drug reimbursement payments and introduceadditional operational and financial challenges to thepharmacy. For most community pharmacies, achieving afunctional and fair working relationship with third- partypayers is essential to attain long-term profitability and overallbusiness survival. Table 8 provides the percent of thirdpartyactivity as well as the average gross margin related tothird-party plans.Figure 3 • Third-Party PrescriptionActivity—Five-Year TrendAccording to Figure 3, third-party activity increased to 88percent of the total prescription volume for the averageDigest pharmacy. Medicare Part D pays for approximately29.6 percent of the prescriptions filled in independent community pharmacies. The percent covered by Medicaiddecreased slightly to 14.5 percent. However, with nearly halfof the prescriptions filled by independents being paid forby a government program, the reimbursement strategies ofgovernment programs significantly affect the financial viabilityof independent community pharmacy. Prescriptions paid for by other third parties decreased to43.7 percent, which is partially due to the shift of people togovernment programs like Medicaid and Medicare. It mayalso be due in part to independent community pharmacyowners rejecting contracts that do not reimburse pharmacistsadequately for their time and service.Results for pharmacies that reported low (less than 80percent), average (80–90 percent) and high (more than 90percent) third-party prescription volume as a percentage oftotal prescriptions filled are contrasted in Tables 9, 10, and11 on the pages that follow.Pharmacies with high third-party activity had highermedian sales at $3,597,873 compared to $3,073,295 forcompanies with less than 80 percent of total prescriptionsfilled under third-party contract arrangements. Theseadditional sales were at lower gross profit margins (22.8percent compared to 25.2 percent for pharmacies with lessthan 80 percent third-party). Pharmacies with less than 80percent third-party prescription sales had higher mediannet operating income percentages and more income dollars(before tax).TABLE 8 • Third-Party Prescription Activity2006 2007 2008MedicaidPercentage of total prescriptions 15% 13.6% 14.5%Average gross margin 19.6% 20.3% 20.3%Medicare Part DPercentage of total prescriptions 24% 25.7% 29.6%Average gross margin 16% 18.7% 18.5%Other third-party programsPercentage of total prescriptions 52% 48.1% 43.7%Average gross margin 18.5% 19.1% 19.3%Third-Party Prescriptions27
TABLE 9 • 2008 Common-Sized (Average) Income StatementPercentage of Total Sales—By Third-Party Prescription ActivityLess than 80% Third Party 80% to 90% Third Party 90% or more Third PartySalesPrescription sales 93.2% 93.3% 93.4%All other sales 6.8% 6.7% 6.6%Total Sales 100% 100% 100%Cost of Goods SoldPrescriptions costs 70.8% 72.4% 72.1%All other costs 4% 4.2% 5.1%Total Cost of Goods Sold 74.8% 76.6% 77.2%Gross Profit 25.2% 23.4% 22.8%Operating ExpensesPayroll expensesSalaries, wages 11.6% 11.7% 11.6%Payroll taxes, workers’ comp, employee benefits 1.8% 1.8% 1.6%Payroll Expenses 13.4% 13.5% 13.2%Other Operating ExpensesAdvertising 0.5% 0.5% 0.5%Insurance 0.5% 0.4% 0.4%Store supplies, containers, labels 0.5% 0.5% 0.5%Office postage 0.1% 0.1% 0.1%Delivery service 0.4% 0.2% 0.2%Pharmacy computer expense 0.5% 0.4% 0.4%Rent 1.2% 1.2% 1.2%Utilities, telephone 0.4% 0.4% 0.5%All other operating expenses 3.7% 3.2% 2.9%Total Other Operating Expenses 7.8% 6.9% 6.7%Total Expenses 21.2% 20.4% 19.9%Net Operating Income 4.0% 3.0% 2.9%282009 NCPA Digest, sponsored by Cardinal Health
Table 10 • 2008 Median Financial Benchmarks—By Third-Party Prescription ActivityLess than 80% Third Party 80% to 90% Third Party 90% or more Third PartyProfitability RatiosNet operating income percentage 3.32% 2.80% 2.94%Net operating income dollars before tax $127,620 $83,565 $101,873Productivity RatiosSales per employee $385,184 $393,483 $424,282Staff costs per employee $47,500 $39,696 $44,364Prescription sales per square foot $3,900 $3,862 $3,631Other sales per square foot $72 $88 $86Total sales per square foot $1,203 $1,302 $1,113Median sales $3,073,295 $3,113,643 $3,597,873Financial Position RatiosSales to assets 5.23 5.73 5.29Return on investment 30% 21% 31.6%Debt to worth 0.30 0.48 0.71Cash Flow RatiosCurrent ratio 4.20 3.97 3.22Quick ratio 2.07 1.57 1.56Inventory turnover (annual) 10.5 10.3 10.1Inventory turnover (days) 35 days 36 days 36 daysPrescription inventory turnover (annual) 12.9 10.9 11.6Accounts receivable turnover (annual) 21.7 25.1 21.6Accounts receivable collection (days) 17 days 15 days 17 daysAccounts payable turnover (annual) 25.6 24.8 22.1Accounts payable turnover (days) 12 days 15 days 17 daysThird-Party Prescriptions29
AssetsTABLE 11 • 2008 Common-Sized (Average) Balance SheetPercentage of Total Assets—By Third-Party Prescription ActivityLess than 80% Third Party 80% to 90% Third Party 90% or more Third PartyCurrent AssetsCash and cash equivalents 8.9% 19.3% 14.6%Accounts receivable 33.4% 22.8% 23.6%Inventory 35.7% 39.4% 40.8%Other current assets 5.4% 5.3% 3.7%Total Current Assets 83.4% 86.8% 82.7%Net fixed assets 11.7% 8.9% 13.4%Other assets 4.9% 4.3% 3.9%Total Assets 100% 100% 100%Liabilities and Owners’ EquityCurrent LiabilitiesNotes payable (within one year) 9.6% 7.4% 5.2%Accounts payable 13.9% 14.7% 17.8%Other current liabilities 6.9% 3.8% 7.2%Total Current Liabilities 30.4% 25.9% 30.2%Long-Term LiabilitiesNotes payable to owner(s) 3.8% 11.8% 6.6%Other long-term liabilities 17.6% 9.8% 11%Total Long-Term Liabilities 21.4% 21.6% 17.6%Total Liabilities 51.8% 47.5% 47.8%Total Owners’ Equity 48.2% 52.5% 52.2%Total Liabilities and Owners’ Equity 100% 100% 100%Medicare Part D PrescriptionsIn 2006, independent community pharmacy experiencedthe introduction of Medicare Part D prescription coverage.Results are reported specific to the portion of prescriptionscovered by Medicare Part D are presented in the followingtables. Pharmacies were classified as less than 20 percent,20 percent to 40 percent, and more than 40 percent MedicarePart D prescription volume as a percentage of totalprescriptions.Results appear in Tables 12, 13, and 14 on the pages thatfollow.Highlights of the Medicare Part D Prescriptions:n Unlike last year, for the average pharmacy, prescriptionsales as a percentage of total sales did not increase alongwith the increase in percentage of prescriptions filledunder Medicare Part D.n Median net operating income percentage was the lowestat 2.47 percent for pharmacies with more than 40 percentof prescriptions covered by Medicare Part D. However, thelowest median net income dollars was for those with 20percent to 40 percent covered under Medicare.n Median sales decrease as the percentage of MedicarePart D prescriptions increase.302009 NCPA Digest, sponsored by Cardinal Health
TABLE 12 • 2008 Common-Sized (Average) Income StatementPercentage of Total Sales—Portion of Prescriptions Covered By Medicare Part DLess than 20% 20% to 40% More than 40%SalesPrescription sales 93.2% 93.7% 93.5%All other sales 6.8% 6.3% 6.5%Total Sales 100% 100% 100%Cost of Goods SoldPrescriptions costs 72.5% 72.6% 71.1%All other costs 4.1% 4.4% 5.2%Total Cost of Goods Sold 76.6% 77% 76.3%Gross Profit 23.4% 23% 23.7%Operating ExpensesPayroll expensesSalaries, wages 10.9% 12% 12.1%Payroll taxes, workers’ comp, employee benefits 1.7% 1.7% 1.7%Payroll Expenses 12.6% 13.7% 13.8%Other Operating ExpensesAdvertising 0.5% 0.5% 0.4%Insurance 0.4% 0.3% 0.4%Store supplies, containers, labels 0.5% 0.4% 0.5%Office postage 0.1% 0.1% 0.1%Delivery service 0.3% 0.2% 0.4%Pharmacy computer expense 0.4% 0.4% 0.5%Rent 1.4% 1.1% 1.0%Utilities, telephone 0.4% 0.4% 0.4%All other operating expenses 3.1% 3% 3.4%Total Other Operating Expenses 7.1% 6.4% 7.1%Total Expenses 19.7% 20.1% 20.9%Net Operating Income 3.7% 2.9% 2.8%Third-Party Prescriptions31
TABLE 13 • 2008 Median Financial Benchmarks — Portion of Prescriptions Covered by Medicare Part DLess than 20% 20% to 40% More than 40%Profitability RatiosNet operating income percentage 3.20% 2.91% 2.47%Net operating income dollars before tax $97,000 $79,880 $93,139Productivity RatiosSales per employee $410,263 $397,337 $406,989Staff costs per employee $44,530 $40,240 $44,857Prescription sales per square foot $4,600 $3,524 $4,262All other sales per square foot $91 $75 $105Total sales per square foot $1,262 $1,061 $1,366Median sales $3,425,369 $3,101,816 $3,099,307Financial Position RatiosSales to assets 5.79 5.32 5.06Return on investment 28% 17.4% 38%Debt to worth 0.56 0.41 0.48Cash Flow RatiosCurrent ratio 2.62 3.98 4.59Quick ratio 1.13 1.77 2.08Inventory turnover (annual) 10.2 10.4 10.1Inventory turnover (days) 36 days 35 days 36 daysPrescription inventory turnover (annual) 11.5 11.7 11.2Accounts receivable turnover (annual) 22.6 24.1 21.2Accounts receivable collection (days) 16 days 15 days 17 daysAccounts payable turnover (annual) 20.2 26.3 26.6Accounts payable turnover (days) 18 days 14 days 14 days322009 NCPA Digest, sponsored by Cardinal Health
AssetsTABLE 14 • 2008 Common Sized (Average) Balance SheetPercentage of Total Assets—By Prescriptions Covered By Medicare Part DLess than 20% 20% to 40% More than 40%Current AssetsCash and cash equivalents 12.1% 18.7% 15.8%Accounts receivable 26.3% 23% 27.3%Inventory 40.7% 38.1% 38.6%Other current assets 4.1% 4.3% 6.3%Total Current Assets 83.2% 84.1% 88%Net fixed assets 14.5% 11.3% 5.4%Other assets 2.3% 4.6% 6.6%Total Assets 100% 100% 100%Liabilities and Owners’ EquityCurrent LiabilitiesNotes payable (within one year) 6.9% 4.8% 11.5%Accounts payable 20.6% 13.7% 12%Other current liabilities 4.7% 6.6% 4.7%Total Current Liabilities 32.2% 25.1% 28.2%Long-Term LiabilitiesNotes payable to owner(s) 10.5% 10.1% 3.2%Other long-term liabilities 8.7% 14.3% 11.2%Total Long-Term Liabilities 19.2% 24.4% 14.4%Total Liabilities 51.4% 49.5% 42.6%Total Owners’ Equity 48.6% 50.5% 57.4%Total Liabilities and Owners’ Equity 100% 100% 100%Third-Party Prescriptions33
Geographic SummaryConditions of the geographic region can influenceoperations of an independent community pharmacy,particularly in today’s economic times. To determinehow pharmacies’ results differ by geographic region, wesorted the pharmacies into five regions. The three basicstatements (common-sized income statement, medianfinancial benchmarks, and common-sized balance sheet)for these geographical regions are contained in Tables 15,16, and 17.n West (ak, az, ca, hi, id, nv, nm, or, ut, wa)n West-Central (ar, co, ia, ks, mn, mo, mt, ne, nd, ok, sd,tx, wi, wy)n East-Central (il, in, mi, oh, pa, wv)n Northeast (ct, de, dc, me, md, ma, nh, nj, ny, ri, vt, va)n Southeast (al, fl, ga, ky, la, ms, nc, sc, tn)Hourly rates for staff pharmacists were highest for pharmaciesin the West and Northeast.Gross profit onprescription salesGross profit on allother salesOverall GrossProfit MarginMargins by Geographic RegionWestWest-CentralEast-CentralNortheastSoutheast24.2% 21.9% 22% 22.5% 22.3%33.8% 37.9% 43.1% 43.8% 28.6%24.9% 23.0% 23.4% 24.9% 22.6%Median net operating income ranged by region from a highof 3.79 percent (in the West-Central region) to a low of 2.26percent (in the West). High gross profit margin along withlow operating costs drive the higher before-tax profits forthe West-Central region. The West again had the highestmedian sales of any region at almost $4.6 million.Payroll expense (including owners) as a percentage of saleswas the lowest in the Southeast region at 13.3 percent. Thehighest payroll costs were in the Northeast region at 15.0 percent.Pharmacies provided their average hourly rates of payfor their non-owner employees working as staff pharmacists,pharmacy technicians, and clerks. Average responses follow:Average Hourly Rate of Pay for Pharmacy PositionsWestWest-CentralEast-CentralNortheastSoutheastStaff pharmacists $56.21 $50.31 $47.94 $53.27 $51.16Pharmacytechnicians$16.92 $12.78 $12.37 $13.69 $12.49Sales clerks $10.72 $9.56 $9.24 $10.47 $9.19The West region and Northeast region had the highest overallgross profit margin at 24.9 percent driven by their strongmargins on both prescription and other sales. The Southeastpharmacies had the lowest gross margin at 22.6 percent.342009 NCPA Digest, sponsored by Cardinal Health
TABLE 15 • 2008 Common-Sized (Average) Income StatementPercentage of Total Sales—By Geographic RegionWest West-Central East-Central Northeast SoutheastSalesPrescription sales 92.3% 93.4% 93.5% 88.8% 95.8%All other sales 7.7% 6.6% 6.5% 11.2% 4.2%Total Sales 100% 100% 100% 100% 100%Cost of Goods SoldPrescriptions costs 70% 72.9% 72.9% 68.8% 74.4%All other costs 5.1% 4.1% 3.7% 6.3% 3%Total Cost of Goods Sold 75.1% 77% 76.6% 75.1% 77.4%Gross Profit 24.9% 23% 23.4% 24.9% 22.6%Operating ExpensesPayroll expensesSalaries, wages 12.9% 11.6% 12.1% 12.8% 11.6%Payroll tax, workers’ comp, employee benefits 2% 1.8% 1.8% 2.2% 1.7%Payroll Expenses 14.9% 13.4% 13.9% 15% 13.3%Other Operating ExpensesAdvertising 0.5% 0.6% 0.5% 0.2% 0.4%Insurance 0.3% 0.4% 0.3% 0.4% 0.4%Store supplies, containers, labels 0.7% 0.5% 0.3% 0.4% 0.4%Office postage 0.2% 0.1% 0.1% 0.2% 0.1%Delivery service 0.3% 0.3% 0.3% 0.4% 0.2%Pharmacy computer expense 0.7% 0.4% 0.5% 0.3% 0.3%Rent 1.4% 1.1% 1% 1.6% 1.1%Utilities, telephone 0.5% 0.4% 0.4% 0.3% 0.4%All other operating expenses 3% 3.2% 3.3% 2% 2.9%Total Other Operating Expenses 7.6% 7% 6.7% 5.8% 6.2%Total Operating Expenses 22.5% 20.4% 20.6% 20.8% 19.5%Net Operating Income 2.4% 2.6% 2.8% 4.1% 3.1%Geographic Summary35
TABLE 16 • 2008 Median Financial Benchmarks—By Geographic RegionWest West-Central East-Central Northeast SoutheastProfitability RatiosNet operating income percentage 2.26% 3.79% 2.43% 2.97% 2.30%Net operating income dollars before tax $110,222 $122,621 $78,000 $86,484 $54,030Productivity RatiosSales per employee $382,390 $404,531 $363,533 $415,113 $427,700Staff costs per employee $47,143 $42,697 $41,032 $45,894 $44,528Prescription sales per square foot $4,932 $3,702 $3,786 $4,783 $3,223Other sales per square foot $111 $81 $104 $230 $62Total sales per square foot $1,389 $1,102 $1,075 $1,698 $1,072Median sales $4,588,675 $3,199,990 $3,671,317 $4,135,798 $2,846,299Financial Position RatiosSales to assets 6.04 5.06 5.16 6.56 5.82Return on investment 26.6% 25.5% 15.6% 19.9% 17%Debt to worth 0.55 0.33 0.45 0.67 0.47Cash Flow RatiosCurrent ratio 2.88 4.20 3.02 2.47 3.87Quick ratio 1.05 1.82 1.57 1.28 1.48Inventory turnover (annual) 10.2 10.1 9.45 11.2 11.3Inventory turnover (days) 36 days 36 days 39 days 33 days 32 daysPrescription inventory turnover (annual) 12.9 11.5 11.6 13 11.8Accounts receivable turnover (annual) 22.6 25.7 19.1 21.3 25.4Accounts receivable collection (days) 16 days 14 days 19 days 17 days 14 daysAccounts payable turnover (annual) 19.6 26.4 24.9 19 32.2Accounts payable turnover (days) 19 days 14 days 15 days 19 days 11 days362009 NCPA Digest, sponsored by Cardinal Health
AssetsTABLE 17 • 2008 Common Sized (Average) Balance SheetPercentage of Total Assets—By Geographic RegionWest West-Central East-Central Northeast SoutheastCurrent AssetsCash and cash equivalents 12.9% 20.3% 16.1% 13.1% 19.3%Accounts receivable 20.6% 21.8% 34.3% 27.8% 22.1%Inventory 42.4% 38.2% 34.7% 44% 37.1%Other current assets 9% 5.1% 2.4% 7.6% 4.1%Total Current Assets 84.9% 85.4% 87.5% 92.5% 82.6%Net fixed assets 11.5% 10.4% 10.2% 2.4% 10.6%Other assets 3.6% 4.2% 2.3% 5.1% 6.8%Total Assets 100% 100% 100% 100% 100%Liabiities and Owners’ EquityCurrent LiabilitiesNotes payable (within one year) 7.8% 5% 13.2% 8.9% 7.1%Accounts payable 19.3% 13.6% 14.3% 23.1% 11.8%Other current liabilities 2.3% 5.1% 7.3% 16% 4.9%Total Current Liabilities 29.4% 23.7% 34.8% 48.0% 23.8%Long-Term LiabilitiesNotes payable to owner(s) 4.9% 9.9% 4.2% 5.7% 13.3%Other long-term liabilities 18.6% 14.5% 4% 12.8% 8%Total Long-Term Liabilities 23.5% 24.4% 8.2% 18.5% 21.3%Total Liabilities 52.9% 48.1% 43% 66.5% 45.1%Total Owners’ Equity 47.1% 51.9% 57% 33.5% 54.9%Total Liabilities and Owners’ Equity 100% 100% 100% 100% 100%Geographic Summary37
Rural/Metro Pharmacy LocationPharmacies defined their market type based upon thepopulation of their region. The categories were:n Population less than 20,000n Population from 20,000 to 50,000n Population more than 50,000Over 50 percent of independent community pharmaciesare located in an area with a population of less than 20,000.Financial statements comparing pharmacies in these categoriesare provided in Tables 18, 19, and 20.The common-sized income statement shows that thepharmacies in areas with less than 50,000 people had lowergross margins than pharmacies in areas with a populationgreater than 50,000. These same pharmacies in areas witha population of less than 50,000 also experienced higherpayroll expenses as a percentage of sales. This may be dueto the pharmacist shortage, and pharmacies having topay more to attract a pharmacist to rural areas. Becausepharmacies in areas with population greater than 50,000had higher gross margins and maintained their expenses,they had a greater average net operating income percentageat 3.9 percent.Median sales for pharmacies with populations over 50,000were higher in the pharmacies in areas over 50,000 at$3,975,570. Yet with the median net operating incomepercentage, these pharmacies were able to earn $80,210 inmedian net operating income dollars before tax. Pharmaciesin rural areas of less than 20,000 had median sales of$3,101,707 and earned $94,861 in median net operatingincome dollars before tax.TABLE 18 • 2008 Common-Sized (Average)Income Statement, Percentage of Total Sales—Metropolitan vs. RuralPopulationlessthan 20,000Population of20,000 to50,000Populationmorethan 50,000SalesPrescription sales 92.8% 93.4% 93.4%All other sales 7.2% 6.6% 6.6%Total Sales 100% 100% 100%Cost of Goods SoldPrescriptions costs 71.7% 70.7% 71.7%All other costs 4.6% 5.8% 4.1%Total Cost of Goods Sold 76.3% 76.5% 75.8%Gross Profit 23.7% 23.5% 24.2%Operating ExpensesPayroll expensesSalaries, wages 11.8% 12.3% 11.7%Payroll taxes, workers’comp, employee benefits1.8% 1.9% 1.7%Payroll Expenses 13.6% 14.2% 13.4%Other Operating ExpensesAdvertising 0.5% 0.5% 0.4%Insurance 0.4% 0.4% 0.4%Store supplies, containers,labels0.5% 0.4% 0.4%Office postage 0.1% 0.1% 0.1%Delivery service 0.2% 0.2% 0.5%Pharmacy computerexpense0.4% 0.4% 0.5%Rent 1.2% 1.3% 1.2%Utilities, telephone 0.4% 0.4% 0.4%All other operating3.1% 2.7% 3%expensesTotal Other OperatingExpenses6.8% 6.4% 6.9%Total Expenses 20.4% 20.6% 20.3%Net Operating Income 3.3% 2.9% 3.9%382009 NCPA Digest, sponsored by Cardinal Health
TABLE 19 • 2008 Median Financial Benchmarks—Metropolitan vs. RuralPopulation lessthan 20,000Population of20,000 to 50,000Population morethan 50,000Profitability RatiosNet operating income percentage 3.18% 1.68% 2.81%Net operating income dollars before tax $94,861 $63,574 $80,210Productivity RatiosSales per employee $399,625 $402,861 $397,476Staff costs per employee $42,036 $42,300 $45,416Prescription sales per square foot $3,733 $4,003 $3,697All other sales per square foot $81 $103 $102Total sales per square foot $1,063 $1,624 $1,333Median sales $3,101,707 $3,806,203 $3,975,570Financial Position RatiosSales to assets 5.29 5.29 6.14Return on investment 25.4% 20.7% 16.3%Debt to worth 0.42 0.49 0.65Cash Flow RatiosCurrent ratio 4.08 3.72 2.53Quick ratio 1.78 1.77 1.14Inventory turnover (annual) 10.1 10.7 10.5Inventory turnover (days) 36 days 34 days 35 daysPrescription inventory turnover (annual) 11.6 12.1 12.2Accounts receivable turnover (annual) 22.7 26.1 24.5Accounts receivable collection (days) 16 days 14 days 15 daysAccounts payable turnover (annual) 25.2 26.4 21.8Accounts payable turnover (days) 14 days 14 days 17 daysRural/Metro Pharmacy Location39
AssetsTABLE 20 • 2008 Common Sized (Average) Balance SheetPercentage of Total Assets—Metropolitan vs. RuralPopulation lessthan 20,000Population of20,000 to 50,000Population morethan 50,000Current AssetsCash and cash equivalents 17.8% 17.4% 15.5%Accounts receivable 22.1% 24.3% 29.7%Inventory 39.9% 40.7% 35.2%Other current assets 4.4% 4.3% 6.8%Total Current Assets 84.2% 86.7% 87.2%Net fixed assets 10.4% 9.7% 10.3%Other assets 5.4% 3.6% 2.5%Total Assets 100% 100% 100%Liabilities and Owners’ EquityCurrent LiabilitiesNotes payable (within one year) 6.3% 4.1% 13.7%Accounts payable 14.3% 18.8% 13.9%Other current liabilities 4.2% 2.8% 10.5%Total Current Liabilities 24.8% 25.7% 38.1%Long-Term LiabilitiesNotes payable to owner(s) 10.2% 10.8% 4.1%Other long-term liabilities 10.2% 11.9% 11.6%Total Long-Term Liabilities 20.4% 22.7% 15.7%Total Liabilities 45.2% 48.4% 53.8%Total Owners’ Equity 54.8% 51.6% 46.2%Total Liabilities and Owners’ Equity 100% 100% 100%402009 NCPA Digest, sponsored by Cardinal Health
Overview of Financial Statementsand Performance MeasuresFinancial StatementsThe information gathered in the survey is summarized andpresented in three basic statements:n Common-sized income statement—percent of total salesn Median financial benchmarksn Common-sized balance sheet—percent of total assetsWhat Is A Common-Sized Statement?Common-sizing financial statement information is aprocess by which each item on the financial statement isreduced to its relationship to the whole statement. Forexample, the average balance sheet presents each balancesheet item as a percentage of total assets. The averageincome statement presents each item as a percentage oftotal sales.The average common-sized statement is computed by determiningan average value for the entire group of respondents.For example, when computing the average balancesheet, the cash balance of each pharmacy was totaled, andthe assets of each pharmacy were totaled. Then total cash isdivided by total assets to arrive at an average percentage oftotal assets for cash. Each item on the balance sheet gets totaledseparately and its percent of total assets is computedin this manner.The result of this process is an average common-sizedstatement. Average values can be affected by one unusualpharmacy. This possibility should be considered when usingaverage common-sized statements in the analysis process.Since each number is calculated separately as an average,the subtotals may not add up to the sum of the detailsdue to rounding. This applies to both the common-sizedincome statements and the common-sized balance sheets.Common-Sized Income StatementThe income statement, also referred to as the profit and lossor P&L, measures the results of operations for a specificperiod of time (one year). The key financial issues relatingto the income statement are pricing, gross margin maintenance,staff costs control, and operating expense control.The common-sized income statement displays each item asa percentage of total sales. By focusing on the relationship tosales, this statement shows how much of each sales dollar isspent on the various expenses.For example, where cost of goods sold are 73.9 percent forevery $1.00 in sales, about 74 cents (73.9 percent of $1.00)is spent on costs of goods, leaving 16 cents in gross profitto cover all other expenses and any profit for the owner.By using this average income statement, pharmacies withdifferent sales volumes can be evaluated for profitability andexpense control in common-sized or comparable terms.Median Financial BenchmarksFinancial statement information can be used to measurethe health and progress of a business and the efficiency ofits financial management. These measurements are quantifiedin standard financial benchmarks.A ratio is simply a comparison of one number to another.By comparing certain numbers from the financial statements,key financial issues can be evaluated, such as: a)efficiency in generating sales from assets, b) efficiency ingenerating profits from sales, or c) efficiency in structuringliabilities and net worth. For definitions and explanationsof the financial operating ratios presented in thisreport, refer to the Guide to Benchmarking. The guide isspecially designed as an educational companion piece tothe 2009 NCPA Digest, sponsored by Cardinal Health. NCPAmembers can download a copy of the guide by visiting theNCPA website at www.ncpanet.org.The median is determined by computing the ratio for eachpharmacy, and the results are ranked in order from highestto lowest. The ratio that falls in the exact middle of the listis at the median. The median is preferred to an averagevalue, since it is not distorted by a few unusually high orlow values.Median ratios are useful management information becausethey designate the “half-way point” of the respondents. Comparingan individual pharmacy’s ratio to the median revealswhether its performance places it in the top or bottom halfof the sample for the specific condition being measured.Overview of Financial Statements and Performance Measures41
Common-Sized Balance SheetThe balance sheet represents the most important informationabout a business with respect to its financial healthand its ability to continue operations. While the incomestatement measures performance for one year, the balancesheet displays the financial condition of the business afterall its years of operations. The two sides of the balancesheet are:n Assets—what the business owns.n Liabilities and Net Worth—what the business owes (tothose who supplied the funds to buy the assets—thecreditors and the owners).The key financial issues related to the balance sheet includesolvency, liquidity, risk and efficiency of generating sales,profits and cash flow from assets.Performance MeasuresFinancial performance is measured by making comparisonsbetween items found on the income statement orbalance sheet, and sometimes by using other non-financialstatistics. Comparing one number to another produces aratio. This report contains a number of ratios designed toevaluate the financial health of a independent communitypharmacy. For an explanation of how specific ratios arecalculated and interpreted, refer to the Guide to Benchmarking.The Guide is designed to be an informative companionpiece to the Digest and can be downloaded fromthe Digest section of the NCPA web site at www.ncpanet.org/members/digest.php.For purposes of this report, financial performance is measuredin these four critical areas:n Profitability—gross profits, net profits, and expense controln Productivity—staff and facilitiesprofit margin and net operating income percentage.Expense controls improve profitability, so expenses andgroups of expenses are also monitored (as a percentageof sales). The Digest’s reporting of profitability, both inpercentage and dollars, is after compensation to ownersbut before tax.Productivity—Managing efficiency of staff and facilitiesMaintaining reasonable levels of staff for a given sales volumeand controlling payroll expenses represents a key areaof financial efficiency. Optimum productivity is the resultof efficiency in payroll expense control, balanced with effectivenessof staff’s efforts. Staff cost per employee or asa percentage of sales are benchmarks for measuring costefficiency. Sales per employee is a benchmark for measuringthe effectiveness of staff efforts. Sales per square footmeasures the productivity of facility space.Financial Position—Balance sheet management andefficiency of generating sales and profits from your investmentin assetsEfficiency of asset use can be measured by comparing salesto assets. The return on investment ratios measure howefficiently the companies generate profit from the owners’investment. Debt management is measured by the debt toworth ratio.Cash Flow Management—Managing the uses of cash andliquid assets in the ongoing operations of the businessInventory, accounts receivable, and accounts payableproblems are controllable, and management efficienciesin these areas can be measured. The common benchmarksfor measuring these efficiencies are inventory turnover andturn days, accounts receivable turnover and turn days, andaccounts payable turnover and turn days. The liquidity,or short-term solvency of the business, is measured by thecurrent and quick ratios.n Financial position—asset use and managing debtn Cash flow—managing the elements of the workingcapital cycleProfitability—Efficiency in generating profits from salesSavings through managing cost of goods sold fall straightto the bottom line as increased net profits. Other opportunitiesfor increased profitability come from controllingpayroll expenses, operating expenses, and interest expense.Benchmarks for measuring profitability include gross422009 NCPA Digest, sponsored by Cardinal Health
100 Daingerfield Road • Alexandria, VA 22314 • Phone: 703-683-8200 • Fax: 703-683-3619 • www.ncpanet.org