NATIONAL COMMUNITY PHARMACISTS ASSOCIATION
NATIONAL COMMUNITY PHARMACISTS ASSOCIATION
NATIONAL COMMUNITY PHARMACISTS ASSOCIATION
- No tags were found...

Create successful ePaper yourself
Turn your PDF publications into a flip-book with our unique Google optimized e-Paper software.
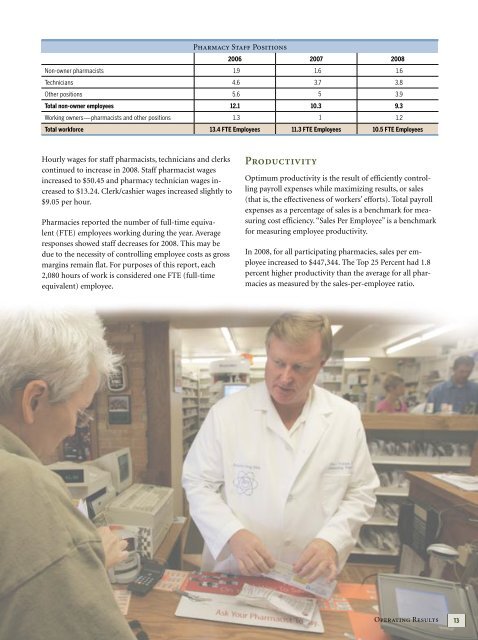
Pharmacy Staff Positions2006 2007 2008Non-owner pharmacists 1.9 1.6 1.6Technicians 4.6 3.7 3.8Other positions 5.6 5 3.9Total non-owner employees 12.1 10.3 9.3Working owners—pharmacists and other positions 1.3 1 1.2Total workforce 13.4 FTE Employees 11.3 FTE Employees 10.5 FTE EmployeesHourly wages for staff pharmacists, technicians and clerkscontinued to increase in 2008. Staff pharmacist wagesincreased to $50.45 and pharmacy technician wages increasedto $13.24. Clerk/cashier wages increased slightly to$9.05 per hour.Pharmacies reported the number of full-time equivalent(FTE) employees working during the year. Averageresponses showed staff decreases for 2008. This may bedue to the necessity of controlling employee costs as grossmargins remain flat. For purposes of this report, each2,080 hours of work is considered one FTE (full-timeequivalent) employee.ProductivityOptimum productivity is the result of efficiently controllingpayroll expenses while maximizing results, or sales(that is, the effectiveness of workers’ efforts). Total payrollexpenses as a percentage of sales is a benchmark for measuringcost efficiency. “Sales Per Employee” is a benchmarkfor measuring employee productivity.In 2008, for all participating pharmacies, sales per employeeincreased to $447,344. The Top 25 Percent had 1.8percent higher productivity than the average for all pharmaciesas measured by the sales-per-employee ratio.Operating Results 13