NATIONAL COMMUNITY PHARMACISTS ASSOCIATION
NATIONAL COMMUNITY PHARMACISTS ASSOCIATION
NATIONAL COMMUNITY PHARMACISTS ASSOCIATION
- No tags were found...

Create successful ePaper yourself
Turn your PDF publications into a flip-book with our unique Google optimized e-Paper software.
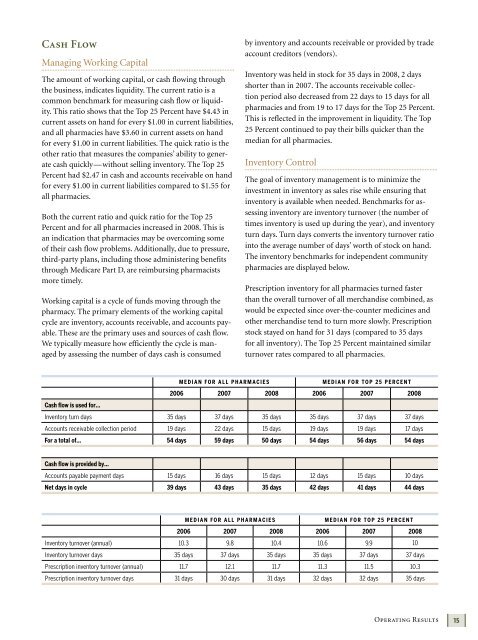
Cash FlowManaging Working CapitalThe amount of working capital, or cash flowing throughthe business, indicates liquidity. The current ratio is acommon benchmark for measuring cash flow or liquidity.This ratio shows that the Top 25 Percent have $4.43 incurrent assets on hand for every $1.00 in current liabilities,and all pharmacies have $3.60 in current assets on handfor every $1.00 in current liabilities. The quick ratio is theother ratio that measures the companies’ ability to generatecash quickly—without selling inventory. The Top 25Percent had $2.47 in cash and accounts receivable on handfor every $1.00 in current liabilities compared to $1.55 forall pharmacies.Both the current ratio and quick ratio for the Top 25Percent and for all pharmacies increased in 2008. This isan indication that pharmacies may be overcoming someof their cash flow problems. Additionally, due to pressure,third-party plans, including those administering benefitsthrough Medicare Part D, are reimbursing pharmacistsmore timely.Working capital is a cycle of funds moving through thepharmacy. The primary elements of the working capitalcycle are inventory, accounts receivable, and accounts payable.These are the primary uses and sources of cash flow.We typically measure how efficiently the cycle is managedby assessing the number of days cash is consumedby inventory and accounts receivable or provided by tradeaccount creditors (vendors).Inventory was held in stock for 35 days in 2008, 2 daysshorter than in 2007. The accounts receivable collectionperiod also decreased from 22 days to 15 days for allpharmacies and from 19 to 17 days for the Top 25 Percent.This is reflected in the improvement in liquidity. The Top25 Percent continued to pay their bills quicker than themedian for all pharmacies.Inventory ControlThe goal of inventory management is to minimize theinvestment in inventory as sales rise while ensuring thatinventory is available when needed. Benchmarks for assessinginventory are inventory turnover (the number oftimes inventory is used up during the year), and inventoryturn days. Turn days converts the inventory turnover ratiointo the average number of days’ worth of stock on hand.The inventory benchmarks for independent communitypharmacies are displayed below.Prescription inventory for all pharmacies turned fasterthan the overall turnover of all merchandise combined, aswould be expected since over-the-counter medicines andother merchandise tend to turn more slowly. Prescriptionstock stayed on hand for 31 days (compared to 35 daysfor all inventory). The Top 25 Percent maintained similarturnover rates compared to all pharmacies.M E D I A N FO R A L L P H A R M AC I E SM E D I A N FO R TO P 2 5 P E R C E N T2006 2007 2008 2006 2007 2008Cash flow is used for…Inventory turn days 35 days 37 days 35 days 35 days 37 days 37 daysAccounts receivable collection period 19 days 22 days 15 days 19 days 19 days 17 daysFor a total of… 54 days 59 days 50 days 54 days 56 days 54 daysCash flow is provided by…Accounts payable payment days 15 days 16 days 15 days 12 days 15 days 10 daysNet days in cycle 39 days 43 days 35 days 42 days 41 days 44 daysM E D I A N FO R A L L P H A R M AC I E SM E D I A N FO R TO P 2 5 P E R C E N T2006 2007 2008 2006 2007 2008Inventory turnover (annual) 10.3 9.8 10.4 10.6 9.9 10Inventory turnover days 35 days 37 days 35 days 35 days 37 days 37 daysPrescription inventory turnover (annual) 11.7 12.1 11.7 11.3 11.5 10.3Prescription inventory turnover days 31 days 30 days 31 days 32 days 32 days 35 daysOperating Results15