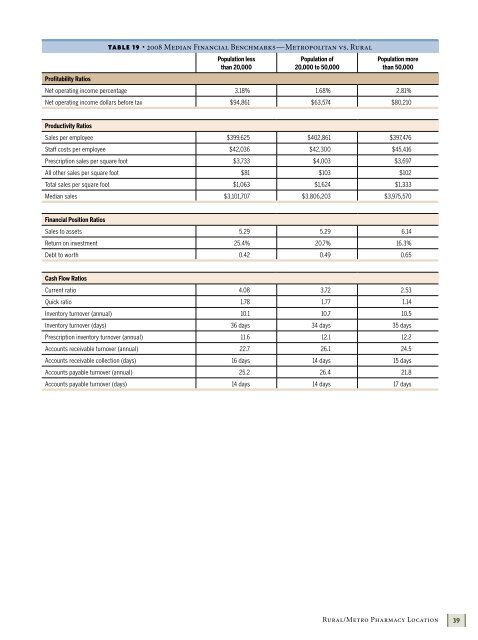
Rural/Metro Pharmacy LocationPharmacies defined their market type based upon thepopulation of their region. The categories were:n Population less than 20,000n Population from 20,000 to 50,000n Population more than 50,000Over 50 percent of independent community pharmaciesare located in an area with a population of less than 20,000.Financial statements comparing pharmacies in these categoriesare provided in Tables 18, 19, and 20.The common-sized income statement shows that thepharmacies in areas with less than 50,000 people had lowergross margins than pharmacies in areas with a populationgreater than 50,000. These same pharmacies in areas witha population of less than 50,000 also experienced higherpayroll expenses as a percentage of sales. This may be dueto the pharmacist shortage, and pharmacies having topay more to attract a pharmacist to rural areas. Becausepharmacies in areas with population greater than 50,000had higher gross margins and maintained their expenses,they had a greater average net operating income percentageat 3.9 percent.Median sales for pharmacies with populations over 50,000were higher in the pharmacies in areas over 50,000 at$3,975,570. Yet with the median net operating incomepercentage, these pharmacies were able to earn $80,210 inmedian net operating income dollars before tax. Pharmaciesin rural areas of less than 20,000 had median sales of$3,101,707 and earned $94,861 in median net operatingincome dollars before tax.TABLE 18 • 2008 Common-Sized (Average)Income Statement, Percentage of Total Sales—Metropolitan vs. RuralPopulationlessthan 20,000Population of20,000 to50,000Populationmorethan 50,000SalesPrescription sales 92.8% 93.4% 93.4%All other sales 7.2% 6.6% 6.6%Total Sales 100% 100% 100%Cost of Goods SoldPrescriptions costs 71.7% 70.7% 71.7%All other costs 4.6% 5.8% 4.1%Total Cost of Goods Sold 76.3% 76.5% 75.8%Gross Profit 23.7% 23.5% 24.2%Operating ExpensesPayroll expensesSalaries, wages 11.8% 12.3% 11.7%Payroll taxes, workers’comp, employee benefits1.8% 1.9% 1.7%Payroll Expenses 13.6% 14.2% 13.4%Other Operating ExpensesAdvertising 0.5% 0.5% 0.4%Insurance 0.4% 0.4% 0.4%Store supplies, containers,labels0.5% 0.4% 0.4%Office postage 0.1% 0.1% 0.1%Delivery service 0.2% 0.2% 0.5%Pharmacy computerexpense0.4% 0.4% 0.5%Rent 1.2% 1.3% 1.2%Utilities, telephone 0.4% 0.4% 0.4%All other operating3.1% 2.7% 3%expensesTotal Other OperatingExpenses6.8% 6.4% 6.9%Total Expenses 20.4% 20.6% 20.3%Net Operating Income 3.3% 2.9% 3.9%382009 NCPA Digest, sponsored by Cardinal Health
TABLE 19 • 2008 Median Financial Benchmarks—Metropolitan vs. RuralPopulation lessthan 20,000Population of20,000 to 50,000Population morethan 50,000Profitability RatiosNet operating income percentage 3.18% 1.68% 2.81%Net operating income dollars before tax $94,861 $63,574 $80,210Productivity RatiosSales per employee $399,625 $402,861 $397,476Staff costs per employee $42,036 $42,300 $45,416Prescription sales per square foot $3,733 $4,003 $3,697All other sales per square foot $81 $103 $102Total sales per square foot $1,063 $1,624 $1,333Median sales $3,101,707 $3,806,203 $3,975,570Financial Position RatiosSales to assets 5.29 5.29 6.14Return on investment 25.4% 20.7% 16.3%Debt to worth 0.42 0.49 0.65Cash Flow RatiosCurrent ratio 4.08 3.72 2.53Quick ratio 1.78 1.77 1.14Inventory turnover (annual) 10.1 10.7 10.5Inventory turnover (days) 36 days 34 days 35 daysPrescription inventory turnover (annual) 11.6 12.1 12.2Accounts receivable turnover (annual) 22.7 26.1 24.5Accounts receivable collection (days) 16 days 14 days 15 daysAccounts payable turnover (annual) 25.2 26.4 21.8Accounts payable turnover (days) 14 days 14 days 17 daysRural/Metro Pharmacy Location39