NATIONAL COMMUNITY PHARMACISTS ASSOCIATION
NATIONAL COMMUNITY PHARMACISTS ASSOCIATION
NATIONAL COMMUNITY PHARMACISTS ASSOCIATION
- No tags were found...

Create successful ePaper yourself
Turn your PDF publications into a flip-book with our unique Google optimized e-Paper software.
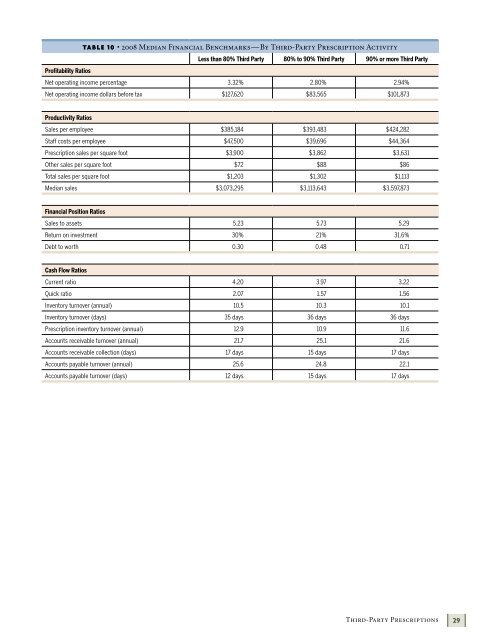
Table 10 • 2008 Median Financial Benchmarks—By Third-Party Prescription ActivityLess than 80% Third Party 80% to 90% Third Party 90% or more Third PartyProfitability RatiosNet operating income percentage 3.32% 2.80% 2.94%Net operating income dollars before tax $127,620 $83,565 $101,873Productivity RatiosSales per employee $385,184 $393,483 $424,282Staff costs per employee $47,500 $39,696 $44,364Prescription sales per square foot $3,900 $3,862 $3,631Other sales per square foot $72 $88 $86Total sales per square foot $1,203 $1,302 $1,113Median sales $3,073,295 $3,113,643 $3,597,873Financial Position RatiosSales to assets 5.23 5.73 5.29Return on investment 30% 21% 31.6%Debt to worth 0.30 0.48 0.71Cash Flow RatiosCurrent ratio 4.20 3.97 3.22Quick ratio 2.07 1.57 1.56Inventory turnover (annual) 10.5 10.3 10.1Inventory turnover (days) 35 days 36 days 36 daysPrescription inventory turnover (annual) 12.9 10.9 11.6Accounts receivable turnover (annual) 21.7 25.1 21.6Accounts receivable collection (days) 17 days 15 days 17 daysAccounts payable turnover (annual) 25.6 24.8 22.1Accounts payable turnover (days) 12 days 15 days 17 daysThird-Party Prescriptions29