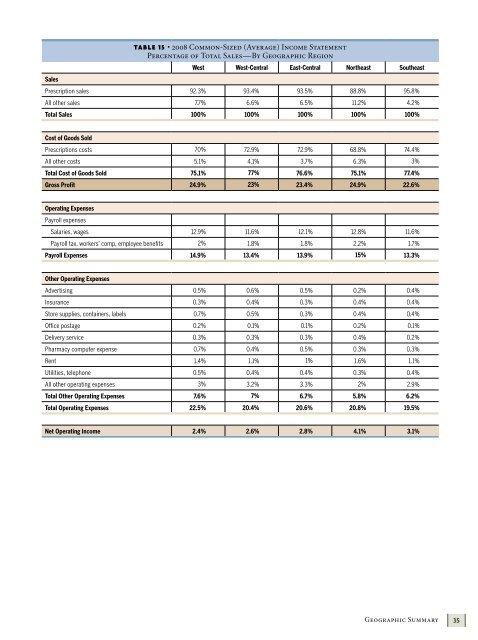
Geographic SummaryConditions of the geographic region can influenceoperations of an independent community pharmacy,particularly in today’s economic times. To determinehow pharmacies’ results differ by geographic region, wesorted the pharmacies into five regions. The three basicstatements (common-sized income statement, medianfinancial benchmarks, and common-sized balance sheet)for these geographical regions are contained in Tables 15,16, and 17.n West (ak, az, ca, hi, id, nv, nm, or, ut, wa)n West-Central (ar, co, ia, ks, mn, mo, mt, ne, nd, ok, sd,tx, wi, wy)n East-Central (il, in, mi, oh, pa, wv)n Northeast (ct, de, dc, me, md, ma, nh, nj, ny, ri, vt, va)n Southeast (al, fl, ga, ky, la, ms, nc, sc, tn)Hourly rates for staff pharmacists were highest for pharmaciesin the West and Northeast.Gross profit onprescription salesGross profit on allother salesOverall GrossProfit MarginMargins by Geographic RegionWestWest-CentralEast-CentralNortheastSoutheast24.2% 21.9% 22% 22.5% 22.3%33.8% 37.9% 43.1% 43.8% 28.6%24.9% 23.0% 23.4% 24.9% 22.6%Median net operating income ranged by region from a highof 3.79 percent (in the West-Central region) to a low of 2.26percent (in the West). High gross profit margin along withlow operating costs drive the higher before-tax profits forthe West-Central region. The West again had the highestmedian sales of any region at almost $4.6 million.Payroll expense (including owners) as a percentage of saleswas the lowest in the Southeast region at 13.3 percent. Thehighest payroll costs were in the Northeast region at 15.0 percent.Pharmacies provided their average hourly rates of payfor their non-owner employees working as staff pharmacists,pharmacy technicians, and clerks. Average responses follow:Average Hourly Rate of Pay for Pharmacy PositionsWestWest-CentralEast-CentralNortheastSoutheastStaff pharmacists $56.21 $50.31 $47.94 $53.27 $51.16Pharmacytechnicians$16.92 $12.78 $12.37 $13.69 $12.49Sales clerks $10.72 $9.56 $9.24 $10.47 $9.19The West region and Northeast region had the highest overallgross profit margin at 24.9 percent driven by their strongmargins on both prescription and other sales. The Southeastpharmacies had the lowest gross margin at 22.6 percent.342009 NCPA Digest, sponsored by Cardinal Health
TABLE 15 • 2008 Common-Sized (Average) Income StatementPercentage of Total Sales—By Geographic RegionWest West-Central East-Central Northeast SoutheastSalesPrescription sales 92.3% 93.4% 93.5% 88.8% 95.8%All other sales 7.7% 6.6% 6.5% 11.2% 4.2%Total Sales 100% 100% 100% 100% 100%Cost of Goods SoldPrescriptions costs 70% 72.9% 72.9% 68.8% 74.4%All other costs 5.1% 4.1% 3.7% 6.3% 3%Total Cost of Goods Sold 75.1% 77% 76.6% 75.1% 77.4%Gross Profit 24.9% 23% 23.4% 24.9% 22.6%Operating ExpensesPayroll expensesSalaries, wages 12.9% 11.6% 12.1% 12.8% 11.6%Payroll tax, workers’ comp, employee benefits 2% 1.8% 1.8% 2.2% 1.7%Payroll Expenses 14.9% 13.4% 13.9% 15% 13.3%Other Operating ExpensesAdvertising 0.5% 0.6% 0.5% 0.2% 0.4%Insurance 0.3% 0.4% 0.3% 0.4% 0.4%Store supplies, containers, labels 0.7% 0.5% 0.3% 0.4% 0.4%Office postage 0.2% 0.1% 0.1% 0.2% 0.1%Delivery service 0.3% 0.3% 0.3% 0.4% 0.2%Pharmacy computer expense 0.7% 0.4% 0.5% 0.3% 0.3%Rent 1.4% 1.1% 1% 1.6% 1.1%Utilities, telephone 0.5% 0.4% 0.4% 0.3% 0.4%All other operating expenses 3% 3.2% 3.3% 2% 2.9%Total Other Operating Expenses 7.6% 7% 6.7% 5.8% 6.2%Total Operating Expenses 22.5% 20.4% 20.6% 20.8% 19.5%Net Operating Income 2.4% 2.6% 2.8% 4.1% 3.1%Geographic Summary35