NATIONAL COMMUNITY PHARMACISTS ASSOCIATION
NATIONAL COMMUNITY PHARMACISTS ASSOCIATION
NATIONAL COMMUNITY PHARMACISTS ASSOCIATION
- No tags were found...

Create successful ePaper yourself
Turn your PDF publications into a flip-book with our unique Google optimized e-Paper software.
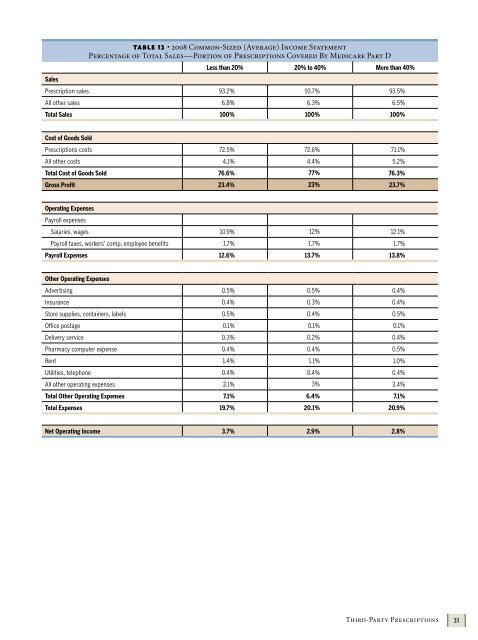
TABLE 12 • 2008 Common-Sized (Average) Income StatementPercentage of Total Sales—Portion of Prescriptions Covered By Medicare Part DLess than 20% 20% to 40% More than 40%SalesPrescription sales 93.2% 93.7% 93.5%All other sales 6.8% 6.3% 6.5%Total Sales 100% 100% 100%Cost of Goods SoldPrescriptions costs 72.5% 72.6% 71.1%All other costs 4.1% 4.4% 5.2%Total Cost of Goods Sold 76.6% 77% 76.3%Gross Profit 23.4% 23% 23.7%Operating ExpensesPayroll expensesSalaries, wages 10.9% 12% 12.1%Payroll taxes, workers’ comp, employee benefits 1.7% 1.7% 1.7%Payroll Expenses 12.6% 13.7% 13.8%Other Operating ExpensesAdvertising 0.5% 0.5% 0.4%Insurance 0.4% 0.3% 0.4%Store supplies, containers, labels 0.5% 0.4% 0.5%Office postage 0.1% 0.1% 0.1%Delivery service 0.3% 0.2% 0.4%Pharmacy computer expense 0.4% 0.4% 0.5%Rent 1.4% 1.1% 1.0%Utilities, telephone 0.4% 0.4% 0.4%All other operating expenses 3.1% 3% 3.4%Total Other Operating Expenses 7.1% 6.4% 7.1%Total Expenses 19.7% 20.1% 20.9%Net Operating Income 3.7% 2.9% 2.8%Third-Party Prescriptions31