NATIONAL COMMUNITY PHARMACISTS ASSOCIATION
NATIONAL COMMUNITY PHARMACISTS ASSOCIATION
NATIONAL COMMUNITY PHARMACISTS ASSOCIATION
- No tags were found...

Create successful ePaper yourself
Turn your PDF publications into a flip-book with our unique Google optimized e-Paper software.
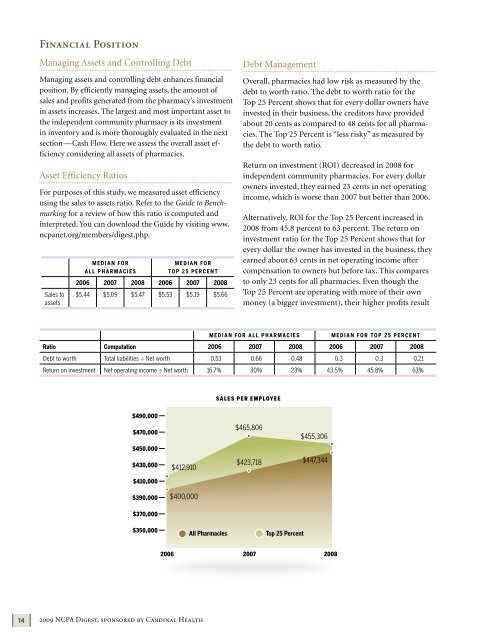
Financial PositionManaging Assets and Controlling DebtManaging assets and controlling debt enhances financialposition. By efficiently managing assets, the amount ofsales and profits generated from the pharmacy’s investmentin assets increases. The largest and most important asset tothe independent community pharmacy is its investmentin inventory and is more thoroughly evaluated in the nextsection—Cash Flow. Here we assess the overall asset efficiencyconsidering all assets of pharmacies. Asset Efficiency RatiosFor purposes of this study, we measured asset efficiencyusing the sales to assets ratio. Refer to the Guide to Benchmarkingfor a review of how this ratio is computed andinterpreted. You can download the Guide by visiting www.ncpanet.org/members/digest.php.Sales toassetsDebt ManagementOverall, pharmacies had low risk as measured by thedebt to worth ratio. The debt to worth ratio for theTop 25 Percent shows that for every dollar owners haveinvested in their business, the creditors have providedabout 20 cents as compared to 48 cents for all pharmacies.The Top 25 Percent is “less risky” as measured bythe debt to worth ratio.Return on investment (ROI) decreased in 2008 forindependent community pharmacies. For every dollarowners invested, they earned 23 cents in net operatingincome, which is worse than 2007 but better than 2006.Alternatively, ROI for the Top 25 Percent increased in2008 from 45.8 percent to 63 percent. The return oninvestment ratio for the Top 25 Percent shows that forevery dollar the owner has invested in the business, theyM E D I A N FO RM E D I A N FO Rearned about 63 cents in net operating income afterA L L P H A R M AC I E STO P 2 5 P E R C E N T compensation to owners but before tax. This compares2006 2007 2008 2006 2007 2008 to only 23 cents for all pharmacies. Even though the$5.44 $5.09 $5.47 $5.53 $5.19 $5.66 Top 25 Percent are operating with more of their ownmoney (a bigger investment), their higher profits resultM E D I A N FO R A L L P H A R M AC I E SM E D I A N FO R TO P 2 5 P E R C E N TRatio Computation 2006 2007 2008 2006 2007 2008Debt to worth Total liabilities ÷ Net worth 0.53 0.66 0.48 0.3 0.3 0.21Return on investment Net operating income ÷ Net worth 16.7% 30% 23% 43.5% 45.8% 63%SA L E S P E R E M P LOY E E142009 NCPA Digest, sponsored by Cardinal Health