NATIONAL COMMUNITY PHARMACISTS ASSOCIATION
NATIONAL COMMUNITY PHARMACISTS ASSOCIATION
NATIONAL COMMUNITY PHARMACISTS ASSOCIATION
- No tags were found...

You also want an ePaper? Increase the reach of your titles
YUMPU automatically turns print PDFs into web optimized ePapers that Google loves.
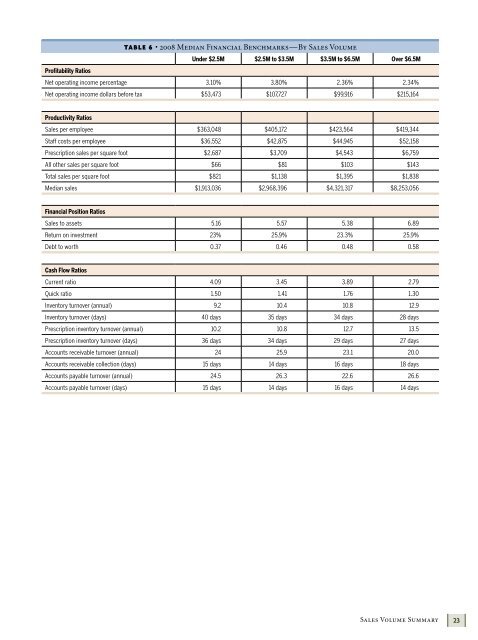
Table 6 • 2008 Median Financial Benchmarks—By Sales VolumeUnder $2.5M $2.5M to $3.5M $3.5M to $6.5M Over $6.5MProfitability RatiosNet operating income percentage 3.10% 3.80% 2.36% 2.34%Net operating income dollars before tax $53,473 $107,727 $99,916 $215,164Productivity RatiosSales per employee $363,048 $405,172 $423,564 $419,344Staff costs per employee $36,552 $42,875 $44,945 $52,158Prescription sales per square foot $2,687 $3,709 $4,543 $6,759All other sales per square foot $66 $81 $103 $143Total sales per square foot $821 $1,138 $1,395 $1,838Median sales $1,913,036 $2,968,396 $4,321,317 $8,253,056Financial Position RatiosSales to assets 5.16 5.57 5.38 6.89Return on investment 23% 25.9% 23.3% 25.9%Debt to worth 0.37 0.46 0.48 0.58Cash Flow RatiosCurrent ratio 4.09 3.45 3.89 2.79Quick ratio 1.50 1.41 1.76 1.30Inventory turnover (annual) 9.2 10.4 10.8 12.9Inventory turnover (days) 40 days 35 days 34 days 28 daysPrescription inventory turnover (annual) 10.2 10.8 12.7 13.5Prescription inventory turnover (days) 36 days 34 days 29 days 27 daysAccounts receivable turnover (annual) 24 25.9 23.1 20.0Accounts receivable collection (days) 15 days 14 days 16 days 18 daysAccounts payable turnover (annual) 24.5 26.3 22.6 26.6Accounts payable turnover (days) 15 days 14 days 16 days 14 daysSales Volume Summary23