NATIONAL COMMUNITY PHARMACISTS ASSOCIATION
NATIONAL COMMUNITY PHARMACISTS ASSOCIATION
NATIONAL COMMUNITY PHARMACISTS ASSOCIATION
- No tags were found...
You also want an ePaper? Increase the reach of your titles
YUMPU automatically turns print PDFs into web optimized ePapers that Google loves.
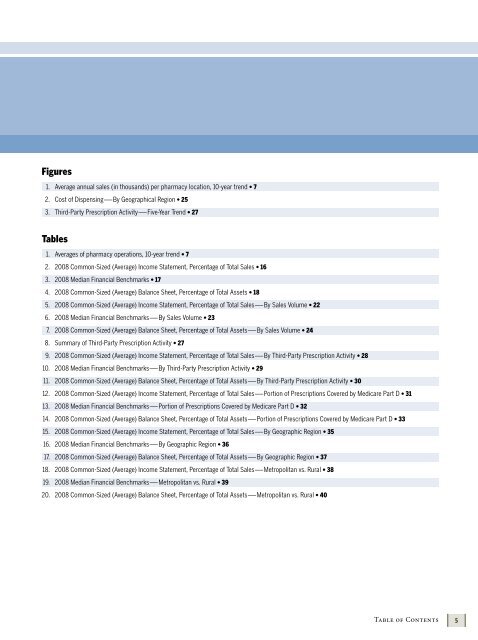
Figures1. Average annual sales (in thousands) per pharmacy location, 10-year trend • 72. Cost of Dispensing—By Geographical Region • 253. Third-Party Prescription Activity—Five-Year Trend • 27Tables1. Averages of pharmacy operations, 10-year trend • 72. 2008 Common-Sized (Average) Income Statement, Percentage of Total Sales • 163. 2008 Median Financial Benchmarks • 174. 2008 Common-Sized (Average) Balance Sheet, Percentage of Total Assets • 185. 2008 Common-Sized (Average) Income Statement, Percentage of Total Sales—By Sales Volume • 226. 2008 Median Financial Benchmarks—By Sales Volume • 237. 2008 Common-Sized (Average) Balance Sheet, Percentage of Total Assets—By Sales Volume • 248. Summary of Third-Party Prescription Activity • 279. 2008 Common-Sized (Average) Income Statement, Percentage of Total Sales—By Third-Party Prescription Activity • 2810. 2008 Median Financial Benchmarks—By Third-Party Prescription Activity • 2911. 2008 Common-Sized (Average) Balance Sheet, Percentage of Total Assets—By Third-Party Prescription Activity • 3012. 2008 Common-Sized (Average) Income Statement, Percentage of Total Sales—Portion of Prescriptions Covered by Medicare Part D • 3113. 2008 Median Financial Benchmarks—Portion of Prescriptions Covered by Medicare Part D • 3214. 2008 Common-Sized (Average) Balance Sheet, Percentage of Total Assets—Portion of Prescriptions Covered by Medicare Part D • 3315. 2008 Common-Sized (Average) Income Statement, Percentage of Total Sales—By Geographic Region • 3516. 2008 Median Financial Benchmarks—By Geographic Region • 3617. 2008 Common-Sized (Average) Balance Sheet, Percentage of Total Assets—By Geographic Region • 3718. 2008 Common-Sized (Average) Income Statement, Percentage of Total Sales—Metropolitan vs. Rural • 3819. 2008 Median Financial Benchmarks—Metropolitan vs. Rural • 3920. 2008 Common-Sized (Average) Balance Sheet, Percentage of Total Assets—Metropolitan vs. Rural • 40Table of Contents


